
Geoinformation as an innovative decision support tool in fighting COVID-19 – using wastewater data.

Data is increasingly defining us – everything in our built and natural world has a geospatial component. Over the years, spatial data has become more ubiquitous and detailed. Geographical data drives many decisions and location intelligence has proven to enhance analytics. Hence, it is useful in uncovering powerful insights, making inferences by combining all other useful information, which might otherwise go unnoticed.
Since the COVID-19 pandemic, public health organizations have sort ways to make informed strategic decisions about the virus. Wastewater data proves to be useful in the forecast of COVID-19 infection in communities and geographical information science (GIS) as a tool has helped bolster this discovery.
Why is monitoring COVID-19 in wastewater important?
SARS-CoV-2 RNA (ribonucleic acid), the virus that carries the COVID-19 disease, has been detected in human faeces. It is also found in asymptomatic – one-fourth of SARS-CoV-2 infections (Alene et al., 2021), pre- symptomatic and symptomatic people. In many people, viral shedding begins before they experience symptoms. Wastewater testing can indicate an increase in the infection rate before clinical oral testing does. Studies have shown that the SARS-CoV-2 RNA viral signal can be detected in wastewater several days before clinical cases are identified.

Photo by Erik Mclean on Unsplash
“You spread the virus when you go to the bathroom, even if you don’t know you are infected yet,” said Ana Maria de Roda Husman, Head of Environment at the National Institute for Public Health and the Environment, Netherlands.
Wastewater treatment plants collect faecal matter transported from the sewage system. Researchers collect and test faecal samples in the laboratory. By collecting wastewater treatment plant samples, they can gain insights into changes in infection rates in a community. Furthermore, it is a cost-effective way of collecting data from everyone within the community the wastewater treatment plant serves, including those who lack access to healthcare. Thus, wastewater data surveillance is very useful as an early warning, non-invasive, system in predicting the spread of the virus.
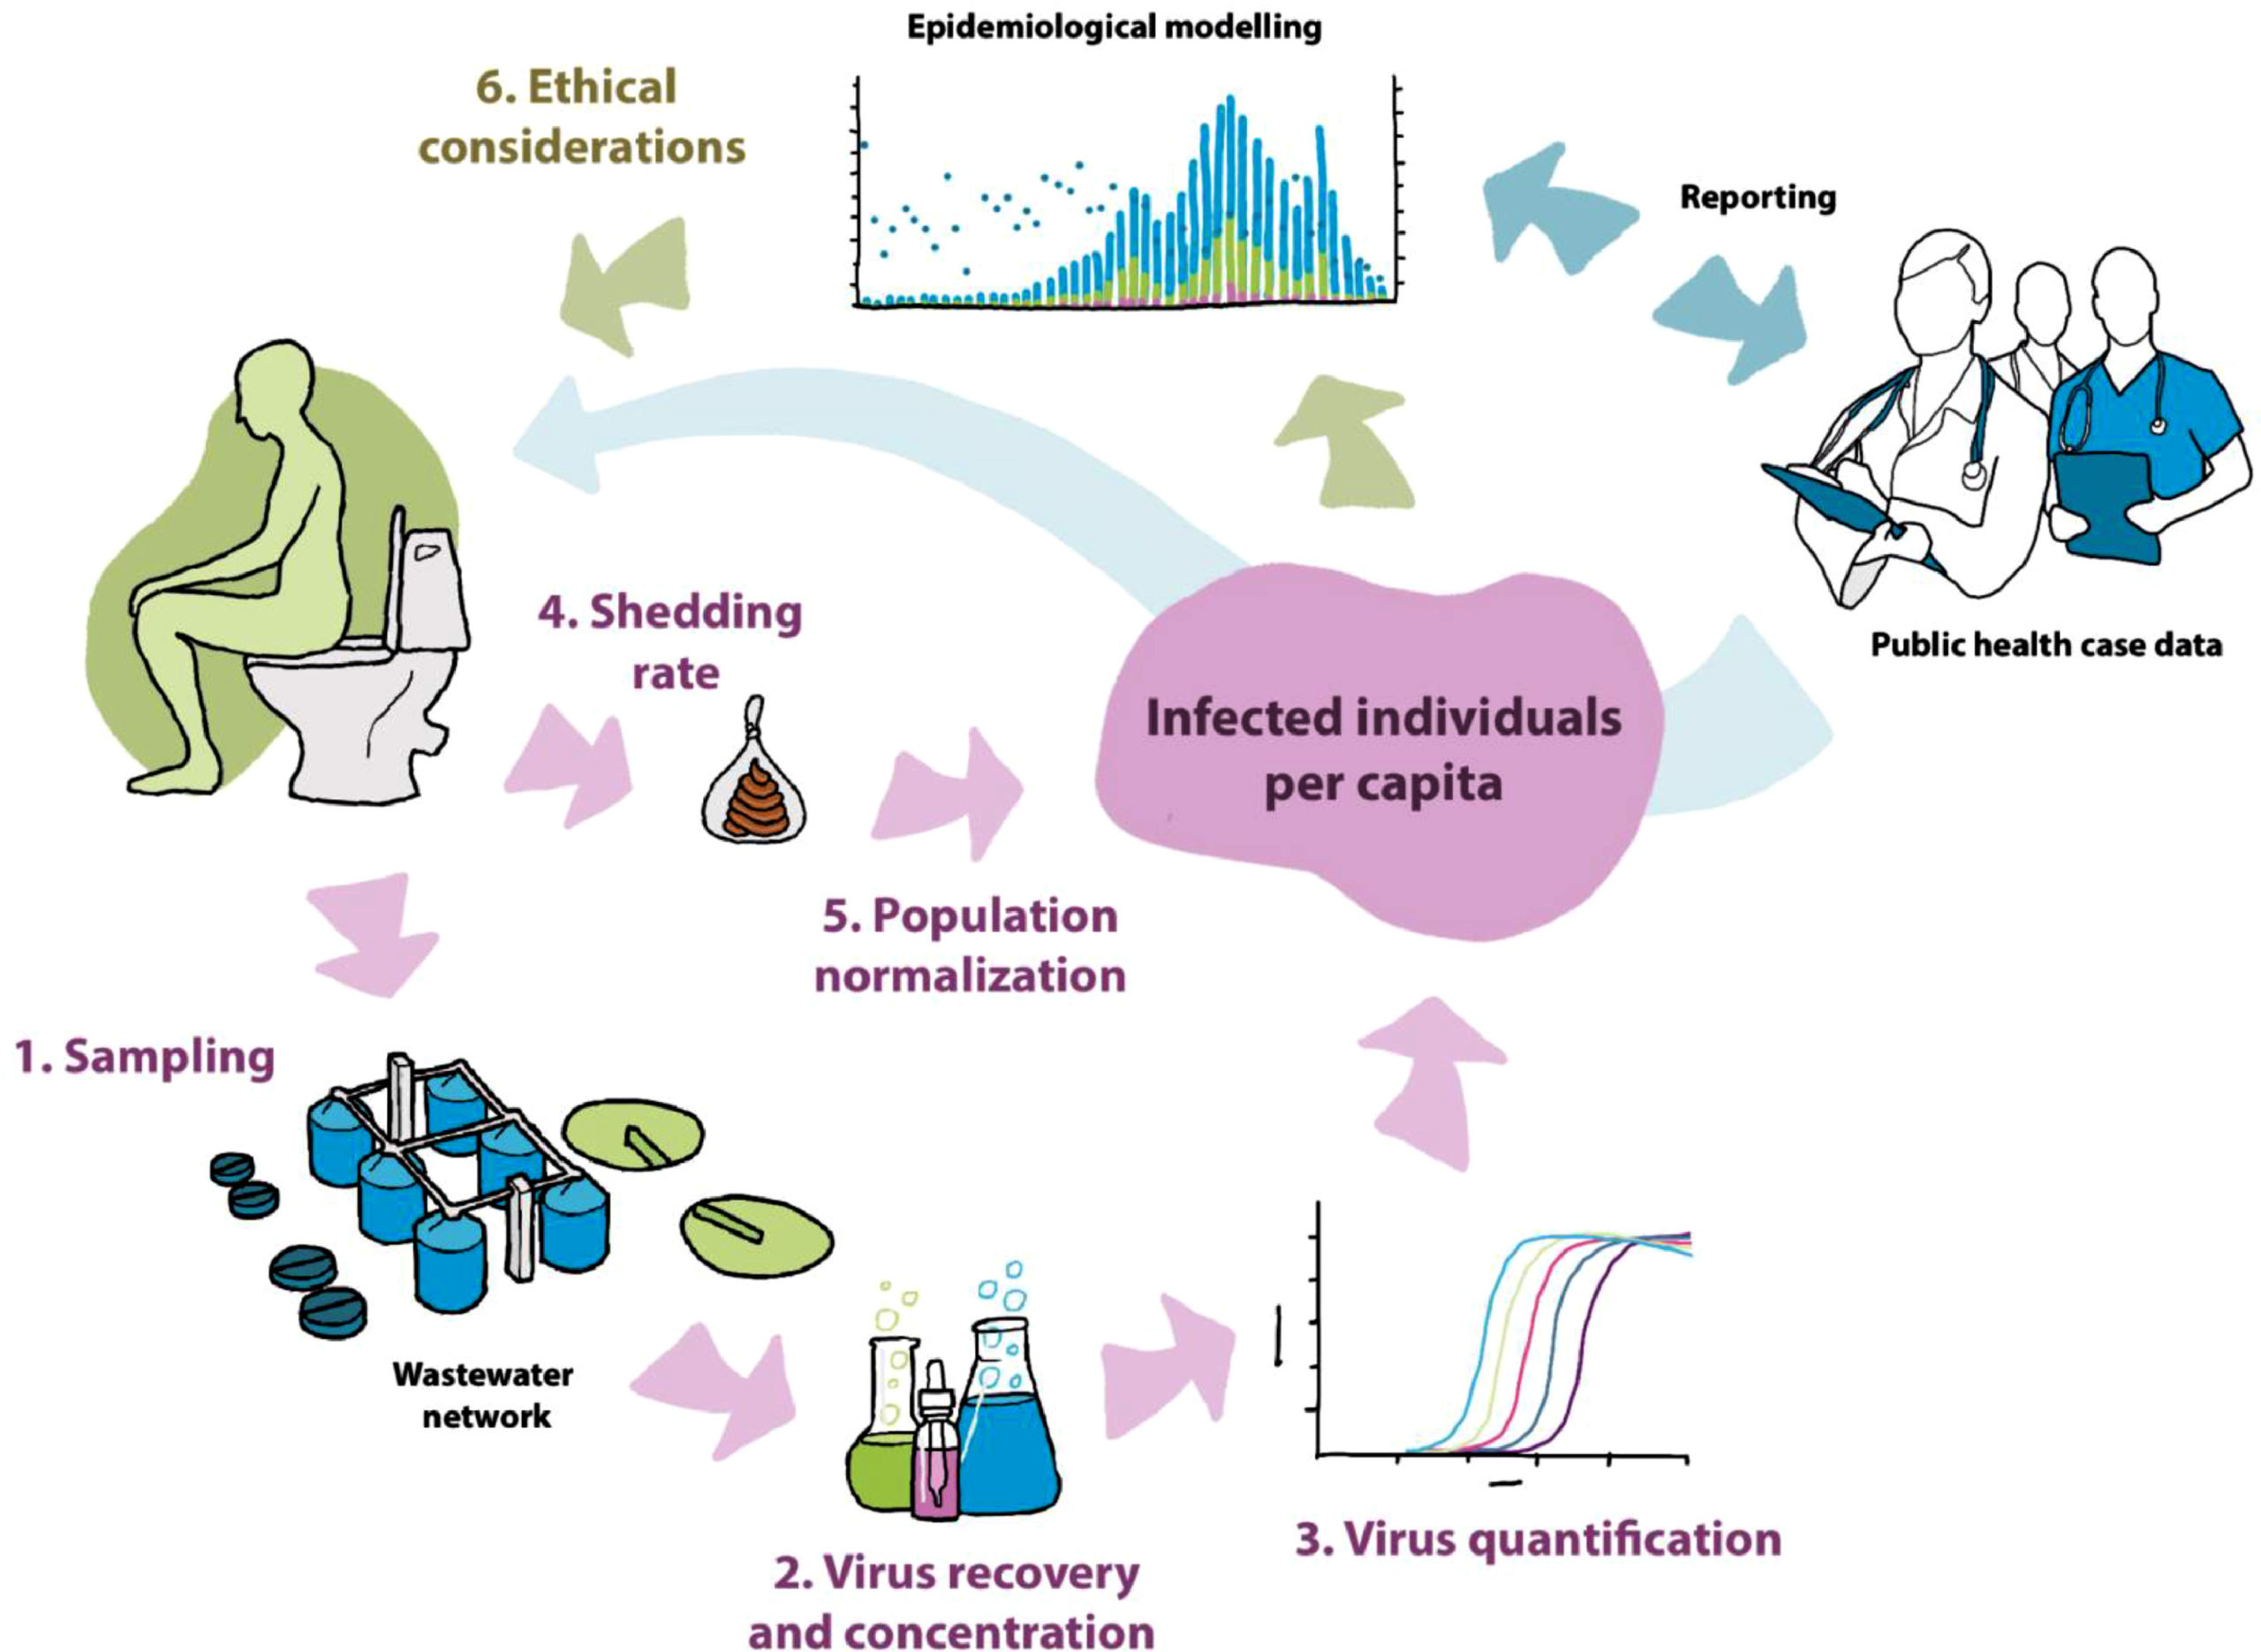
A structured approach to wastewater-based epidemiology (WBE) as used community COVID-19 surveillance. (Polo et al., 2020)
In addition, monitoring wastewater to keep track of infection levels provides a means for data-informed decisions and strategic planning. It also provides a snapshot and a holistic insight about the health of a community.
“Wastewater testing and monitoring should be implemented in every city, so we can see and monitor viruses before they become a pandemic,” said Rosa Inchausti, Director of Strategic Management and Diversity at the City of Tempe.
What role is GIS playing in wastewater surveillance against COVID-19?
How do we connect data to place? GIS leverages on several capabilities. These include, data organization, querying, visualization, management and automation for repeatability and reproducibility. Therefore, this process can be applied to different communities at different scales – for example, national to sub-national level.
Geospatial intelligence provides an immersion and an avenue to visualize community locations and a trend of the viral load per population simultaneously, hence providing additional insights. For example, through dashboards and spatiotemporal mapping to understand the data. Furthermore, visualizing the locations of wastewater treatment plants, helps to understand the distribution of these treatment plants. It is also valuable to compare several areas/communities and contextualize the data in the real world. Therefore, connecting this data with supplementary information health indicators and metrics such as positive cases, hospital admissions, deaths and other socio- economic indicators provide additional value and a comprehensive explanation in understanding the spatial and temporal trends of the virus across different spatial scales.
Geoinformation is also very useful in the processing of complex models that explain the relationship between the health indicators and other supplementary information.
Use case examples
- In an innovative partnership to prevent and reduce the spread of COVID-19, the City of Tempe is working in partnership with Arizona State University (ASU) to study the city’s wastewater. Supported by the Tempe City Council’s Innovation Fund, they have employed the use of story maps including, spatial data driven dashboards to inform the public about the virus in wastewater.
“If we break up some of the collection areas into smaller ones, it would allow us to get more focused results about where concentrations are the highest and to better understand the populations being impacted,” said Dr. Stephanie Deitrick, Enterprise GIS & Analytics manager at the City of Tempe.
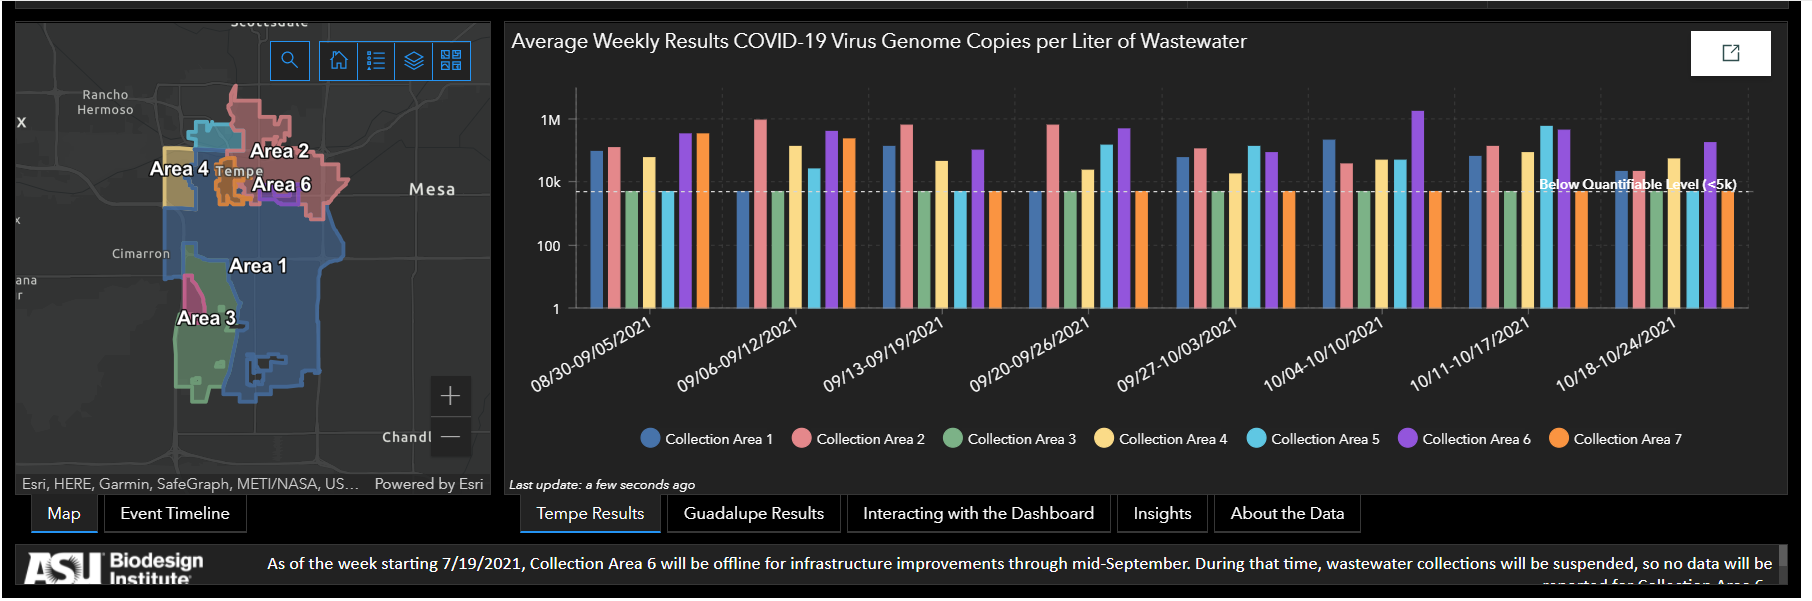
Using geoinformation tools to illustrate the trends of the signal of the weekly average of COVID-19 genome copies per liter of wastewater in Tempe’s sewage. (Source: Tempe’s Covid-19 Wastewater Results Dashboard)
- The Missouri Department of Health and Senior Services (DHSS), Missouri Department of Natural Resources (DNR), and the University of Missouri (MU) developed the Sewershed Surveillance Project , testing COVID-19 viral load in the wastewater of more than 50 participating community water systems. This project aims to mitigate COVID-19 impacts by using wastewater data to identify the geographic distribution of SARS-CoV-2 in Missouri. Additionally, they employed GIS tools to visualize the trend of viral loads in wastewater treatment plant to make deductions on the trends of the viral load over time and monitor the virus indicators for surge or resurgence within communities.
“As the outbreak continues, this program remains an effective tool for trends analysis to be used with other measures of viral spread in a monitored population,” said Jeff Wenzel, bureau chief of DHSS’s Bureau of Environmental Epidemiology.
- University of California San Diego (UCSD) used GIS-powered infrastructure maps to monitor their wastewater. To effectively communicate cases, sewage sample testing results link to a geographical information system to relate which buildings have had a positive case. Overall, this enabled them to offer on-campus housing throughout most of the pandemic.
- Natural Environment Research Council (NERC) in the UK, funded by UKRI have been working on a government-led project using wastewater data to track the spread of the COVID-19 disease. GIS has been useful in mapping infection through the sewers and identifying hotspots to contain the outbreak.
Call to Action
Open data helps in understanding the trends and spread of the virus better, if socio-economic and epidemiological indicators are easily available across different communities or regions. It allows a more focused target area together with results from the trend and analysis of the wastewater data.
Cross-sector collaboration would foster a more strategic approach in using wastewater to predict virus spread with geoinformation technologies. Moreover, a combination of ideas and understanding the key considerations from the academia, councils, and a geographical information perspective would be useful to enrich insights about the virus trends and health of the population.
Finally, there is still a lot of research about wastewater surveillance on COVID-19, geoinformation science as a tool proves to be useful decision support system in understanding the virus spread over time. Thus, helping public officials understand vulnerable populations and communities that need immediate interventions.
References
Alene, M., Yismaw, L., Assemie, M.A., Ketema, D.B., Mengist, B., Kassie, B. and Birhan, T.Y., 2021. Magnitude of asymptomatic COVID-19 cases throughout the course of infection: A systematic review and meta-analysis. PloS one, 16(3), p.e0249090.
ArcGIS StoryMaps. 2021. The Sewershed Surveillance Project. [online] Available at: <https://storymaps.arcgis.com/stories/f7f5492486114da6b5d6fdc07f81aacf> [Accessed 21 September 2021].
ArcGIS StoryMaps. 2020. Fighting Coronavirus/COVID-19 with Public Health Data. [online] Available at: <https://storymaps.arcgis.com/stories/e6a45aad50c24e22b7285412d2d6ff2a> [Accessed 21 September 2021].
Geraghty, E., 2021. It’s in the Wastewater: How UC San Diego Senses and Maps COVID-19. [online] Esri. Available at: <https://www.esri.com/about/newsroom/blog/ucsd-senses-maps-covid-19/> [Accessed 18 September 2021].
Lindemann, J., 2020. COVID-19: Tempe Tests Wastewater to Provide Early Warnings. [Blog] ESRI BLOG, Available at: <https://www.esri.com/about/newsroom/blog/covid-19-tempe-tests-wastewater/> [Accessed 22 September 2021].
Newseu.cgtn.com. 2019. Netherlands leads the way with nationwide COVID-19 sewage testing. [online] Available at: <https://newseu.cgtn.com/news/2020-07-21/Netherlands-leads-the-way-with-nationwide-COVID-19-sewage-testing-ShzEz63aMg/index.html> [Accessed 21 September 2021].
Polo, D., Quintela-Baluja, M., Corbishley, A., Jones, D., Singer, A., Graham, D. and Romalde, J., 2020. Making waves: Wastewater-based epidemiology for COVID-19 – approaches and challenges for surveillance and prediction. Water Research, 186, p.116404.
Ukri.org. 2020. UKRI-funded research supports COVID-19 sewage tracking system. [online] Available at: <https://www.ukri.org/news/ukri-funded-research-supports-covid-19-sewage-tracking-system/> [Accessed 19 September 2021].


#Ideas

Next article

By now, most of you have heard the big news – Mark from Facebook would really like us to call Facebook by its new name – ‘Meta’. Let’s step aside from all the reasons behind this move and focus on one particular sentence from his announcement i.e. “But over time, I hope we are seen as a metaverse company.”.
You are probably wondering what does Facebook becoming a ‘metaverse company’ have to do with the geospatial industry? Actually quite a lot. When internet became a thing, the then-GIS industry slowly got into the act and rolled out ‘Web GIS’, while the newer entrants simply reimagined maps for the digital world opening up an entire new market. Now, Metaverse is being labelled as the next big thing for the internet by Big Tech and wealthy investors. Facebook and Big Tech are already envision the future of the virtual world. Are we maybe on the cusp on other huge technological revolution that will impact the geospatial market just like internet has done so far? IMHO the answer is yes.
But if I am being honest, the 1st question that needs to be answered before diving into the endless possibilities for geospatial industry in the metaverse is – ‘what the awesomeness is metaverse again?’.
Metaverse is basically… let me allow the experts to talk here.
Cesium CEO Patrick Cozzi and Marc Petit, VP and General Manager of Unreal Engine at Epic Games, recently launched Building the Open Metaverse, a podcast where technologists come together to share insights as they build the metaverse. And luckily for me, their very 1st episode is focused on defining the “metaverse”—what it is, how to explain it to people not working in technology, and whether or not it’s here today.
Check it out!

