Why did Facebook acquire geospatial startup Mapillary?

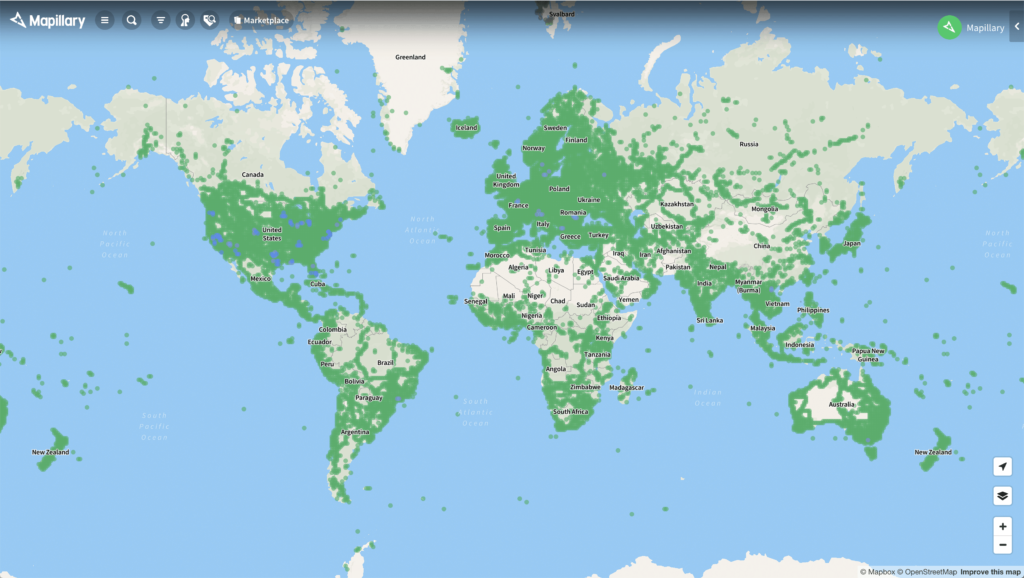
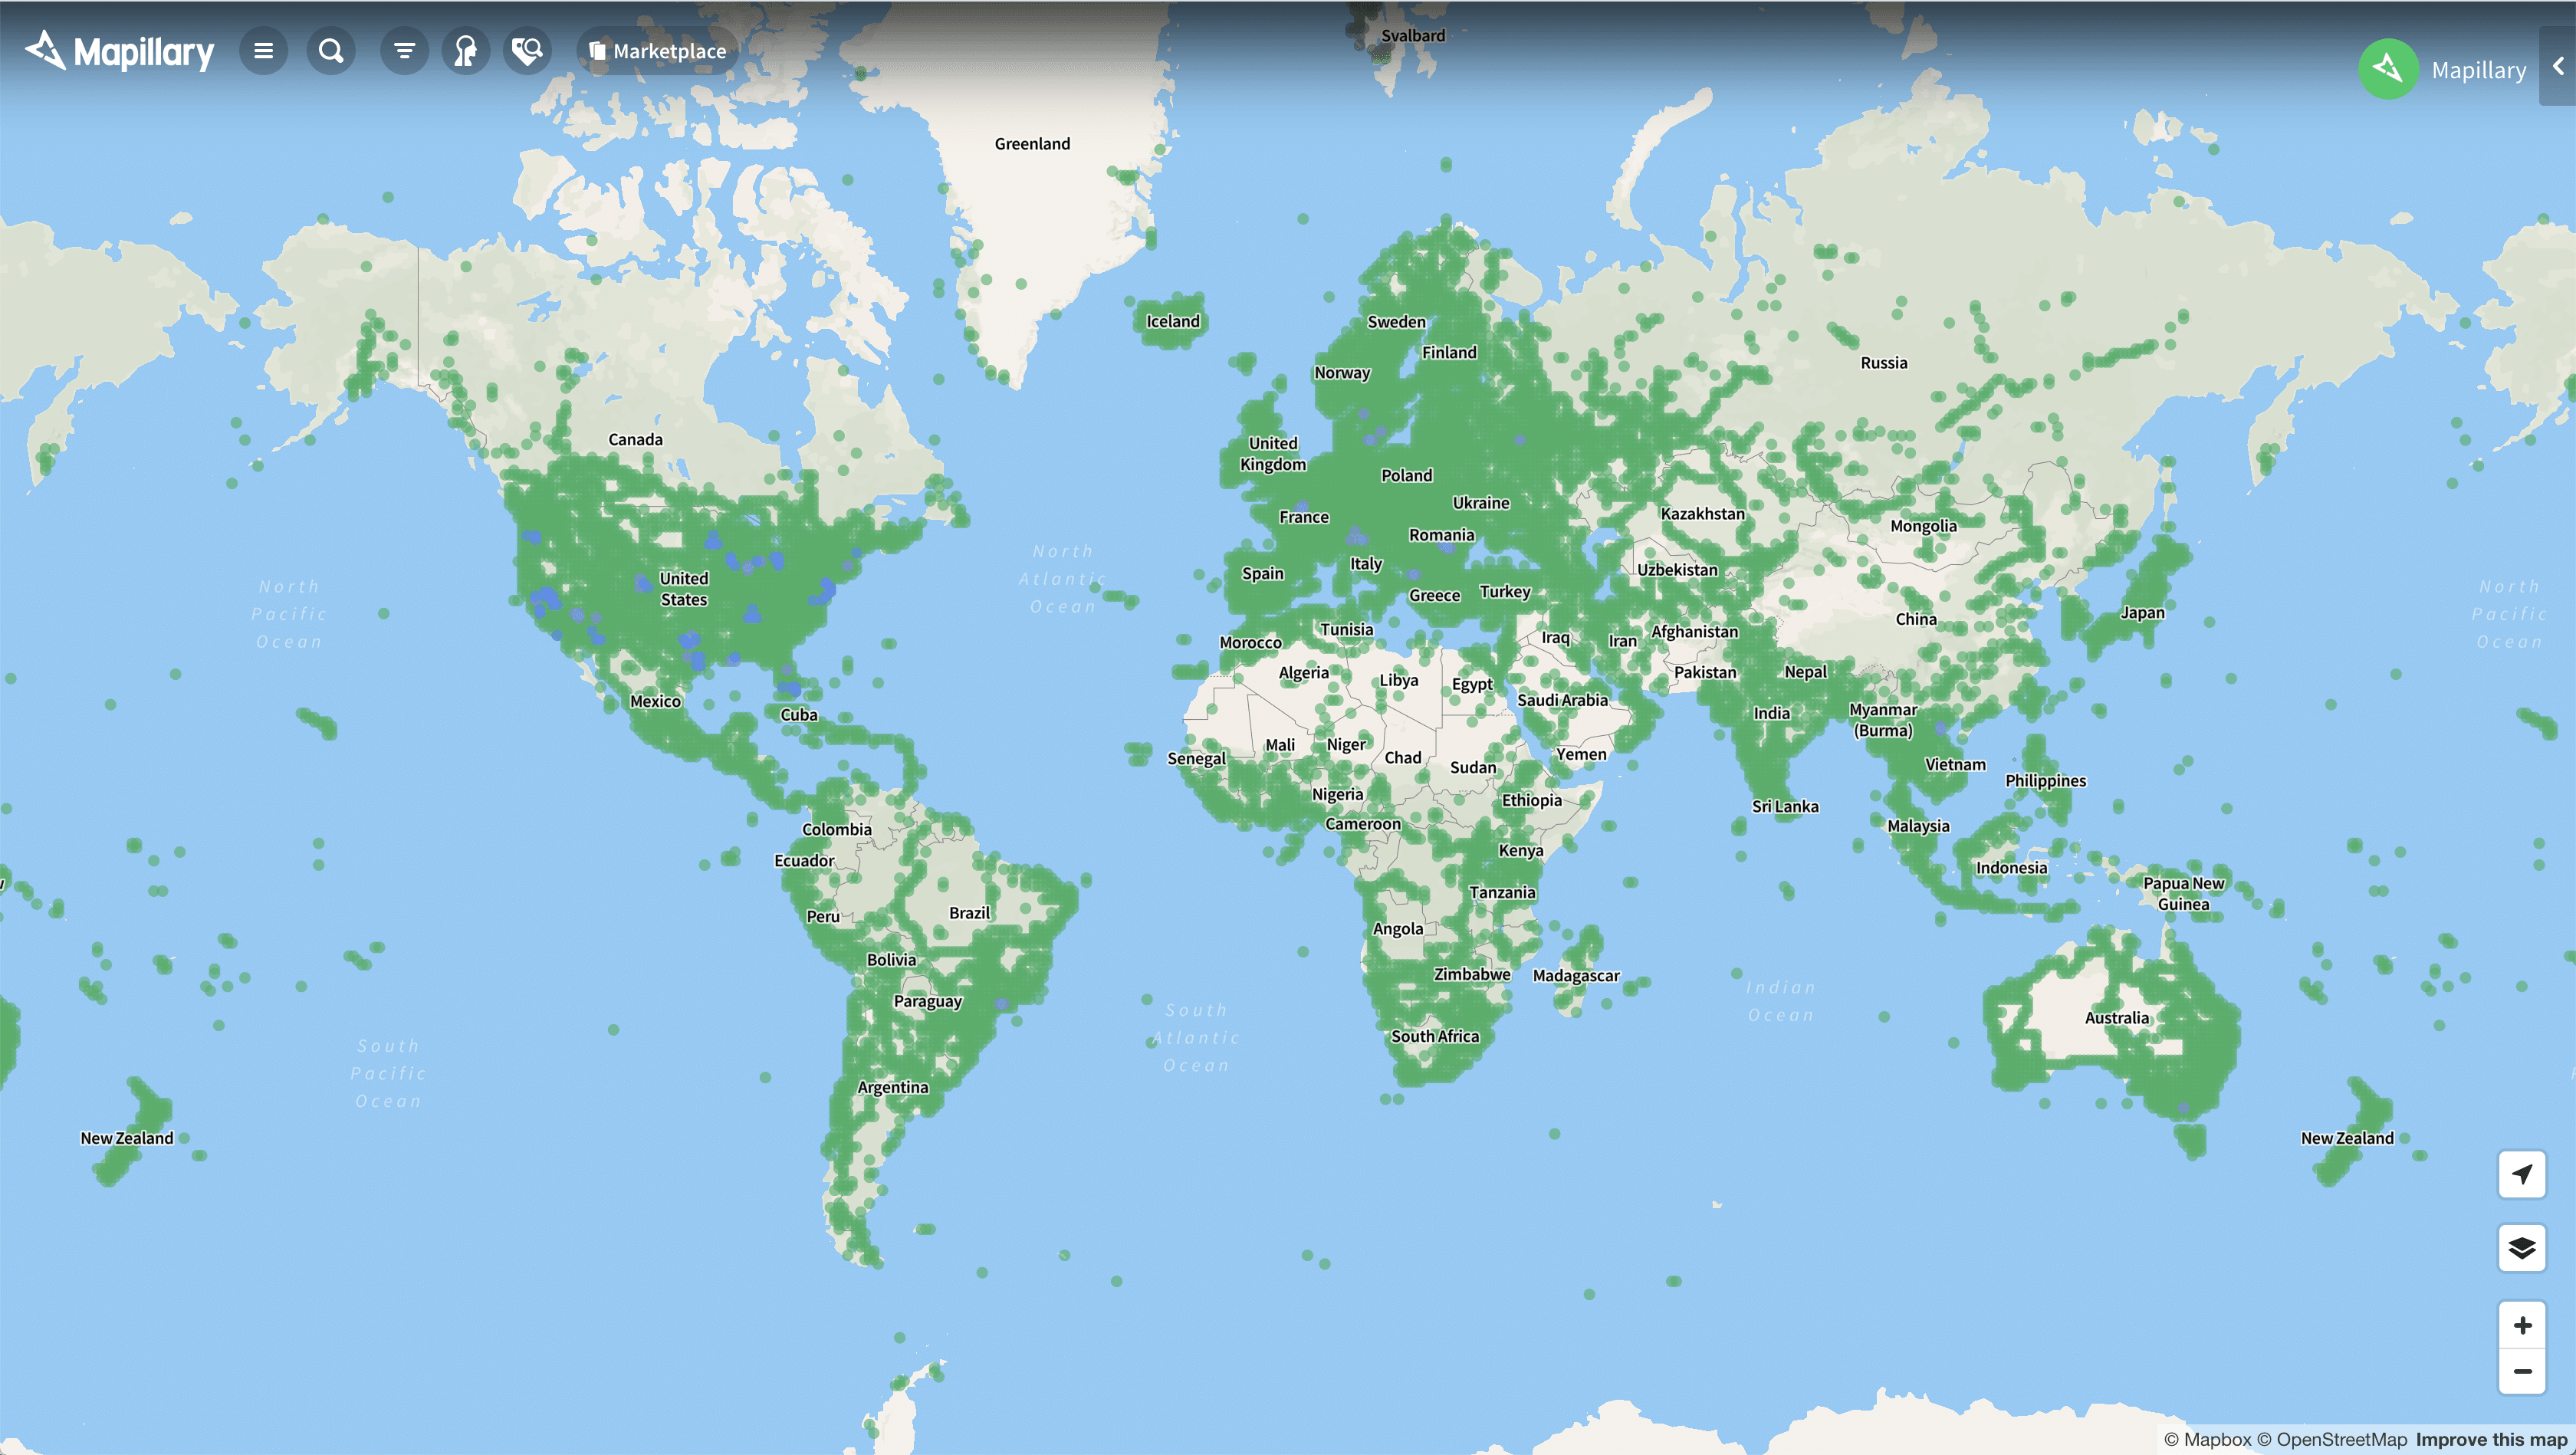
Mapillary map coverage as of June 2020
Geospatial startup Mapillary has been scooped up by Facebook. Sweden-based Mapillary, which has been featured by Geoawesomeness in the Top 100 Geospatial Companies and Startups List, has created a crowdsourced database of street-level imagery. By using computer vision and deep learning technologies, the company has been able to detect and plot dozens of object types as point features on maps.
Mapillary is also deeply committed to OpenStreetMap, aka the Wikipedia of mapping. Mapillary makes all its images and derived metadata available to the OSM community to enhance map edits, and also works closely with the Humanitarian OSM Team to map the under-mapped regions of the world.
Why did Facebook acquire Mapillary?
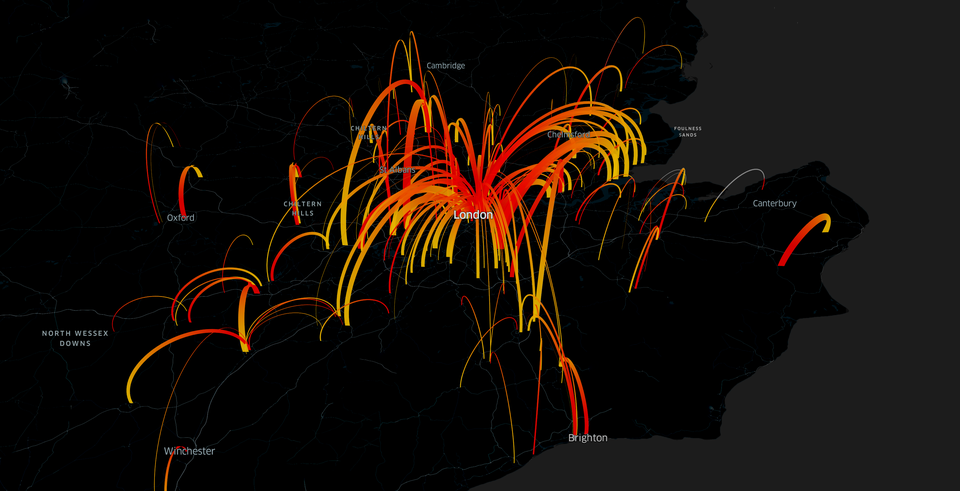
Facebook is getting pretty serious about maps. Its Data for Good team has been creating map products since 2017, arming nonprofits and humanitarian agencies with a range of anonymized location datasets amassed from 2.5 billion active users of the social networking platform. These include location density maps, movement maps, and network coverage maps that provide disaster relief agencies with near-real-time information of affected sites.

Facebook map shows movement between Greater London and surrounding areas by day
Facebook also creates map products that aim to improve health outcomes for communities around the world. Its Disease Prevention Maps – that include insights on population density with demographic estimates, population movement and movement range, cellular network coverage, social connectedness index, and the probability of people in one area coming in contact with people from another area – are helping inform disease forecasting efforts and protective measures in the fight against COVID-19.
Also see: Facebook creates COVID-19 symptom tracking map for the US
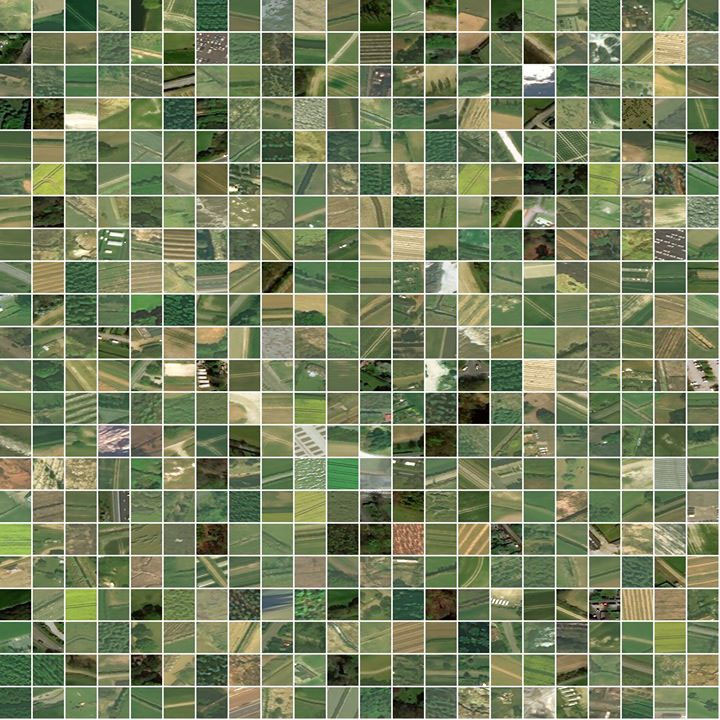
Moreover, Facebook has been using artificial intelligence to supercharge the creation of maps around the world, including training the system to identify possible roads and highlighting them in OSM’s mapping tool for volunteers to verify.

Facebook’s AI system labeled these tiles as not containing a building
In this vein, the rich map data and crowdsourced street-level imagery (1.1 billion and counting) that Mapillary has acquired to date, along with its machine learning prowess, will surely help Facebook to improve its map products.
Street-level imagery could also play a significant role in powering Facebook Marketplace, a platform that allows users to buy things from people and businesses in their area. Facebook should likely be able to leverage Mapillary data for augmented reality products in the times to come too.
“At Mapillary, we’re building the tools for creating a living and visual representation of every place in the world, made available for anyone to update the maps they care about,” says Jan Erik, Mapillary CEO and co-founder. “By merging our efforts, we will further improve the ways that people and machines can work with both aerial and street-level imagery to produce map data. Lots of exciting results will come out of this, including the data we all need to make better maps.”
Mapillary data becomes free for commercial use
Historically, Mapillary imagery has been open and free for anyone to use for non-commercial purposes. Moving forward, this data will be free to use for commercial users as well. This is quite interesting because the move will directly challenge Google’s monopoly in street-level imagery data, even as it allows Facebook to ramp up its own mapping efforts. Mapillary’s volunteer community, admittedly, has mixed feelings about this.
But, thankfully, the company’s commitment to OpenStreetMap stays intact. The rights given to OSM editors will remain unchanged and Mapillary will continue to collaborate with OSM communities and companies – without having to look for ways to monetize the business model.

Volunteers in Lesotho during a campaign run by HOT and Mapillary
“So much of the world still needs to be mapped, and so many of the world’s maps still require updates. As the world changes, our maps need to change with it. Together with Facebook, we’ll be able to build the tools that will keep our maps detailed, accurate, and up to date – for everyone, everywhere,” Erik sums up.


