Exploring the World of Google Earth Engine Through Time-Series Visualizations

In the age of big data and cloud computing, Google Earth Engine (GEE) stands out as a handy environmental monitoring and analysis tool. This platform combines an extensive archive of satellite imagery with advanced capabilities, enabling researchers, policymakers, and geo enthusiasts to address some of the planet’s most pressing challenges.
Let’s examine the world of GEE, exploring its satellite imagery datasets in time-series visualizations!
GEE as a source of EO data
At the heart of Google Earth Engine lies its vast repository of satellite imagery. GEE hosts petabytes of data from various satellite missions, including Landsat, Sentinel, MODIS, and more. These datasets span decades, providing a rich historical perspective invaluable for long-term environmental monitoring.
The Google Earth Engine Catalog includes a comprehensive collection of satellite imagery, geospatial datasets, and environmental data from various sources. It provides access to datasets covering diverse topics like climate, vegetation, soil, water, and urban areas, enabling users to analyze and visualize changes over time. Multi-temporal data from satellite missions such as MODIS, Landsat, Sentinel, and more are organized into “ImageCollections” which contain a sequence of images over time for the same geographic area.
Visualizing Time-Series Data
Google Earth Engine allows users to create time series visualizations and export them as GIF files, enabling dynamic monitoring of environmental changes over time. Built-in charting capabilities to visualize time-series data extracted from ImageCollections enable visualizations such as line charts and animated visualizations to be created.
However, it’s important to note that some optical datasets in GEE can be affected by cloud coverage, which may obscure the visual data in certain frames.
Time series is crucial for analyzing trends, patterns, and seasonal variations over time, allowing for more accurate forecasting and decision-making in various fields such as agriculture, environmental science, and urban planning. It helps in identifying long-term trends, cyclical behaviors, and anomalies.
Example:
A. NDWI index
The Normalized Difference Water Index (NDWI) is an index used to measure and monitor water content in vegetation and the presence of water bodies. It is calculated using the near-infrared (NIR) and green wavelengths of light reflected by surfaces, with the formula:
NDWI = (G-NIR)/(G+NIR)
G is the green band and NIR is the near-infrared band.
In an image, you can plot the theNDWI time-series for a specific location to analyze the water content in vegetation and soil moisture. This makes it easier to distinguish between water bodies and land and is useful for tracking changes in water bodies, monitoring drought conditions, and managing water resources.
The two visualizations below show changes in water content in agricultural fields over a year. A significant change is noticeable in spring – an increase in humidity due to meltwater – and in summer, i.e. a time with less rainfall. Both areas are concentrated in areas with developed agriculture.
NDWI index, California, Jun 2022 – Jun 2023, Sentinel-2
NDWI index, Ebro River, Spain, Jun 2022 – Jun 2023, Sentinel-2
C. NDVI index
The Normalized Difference Vegetation Index (NDVI) is a widely-used remote sensing index that quantifies vegetation health and density by comparing the difference between near-infrared (which vegetation strongly reflects) and red light (which vegetation absorbs). It can be used for crop health monitoring or land classification.
The visualizations below show the change in the NDVI index over several months. The first concerns the area of Kenya and the impact of the rainy season on the increase in the vegetation index in the area of local national parks, including Mount Kenya (red dot on the green background). Interestingly, the vegetation map can indicate water reservoirs. In this visualization, they appear as black areas where the NDVI value is zero – these are Lake Naivasha and Lake Baringo.
The second visualization shows the NDVI index in an urban environment, in the city of Omaha in the USA. It can help in planning and arranging the city and examining the condition of trees in city parks and grasslands.
NDVI index, Kenia, Jan 2023 – Dec 2023, MODIS
NDVI index, Omaha, Iowa, Apr 2023 – Oct 2023, MODIS
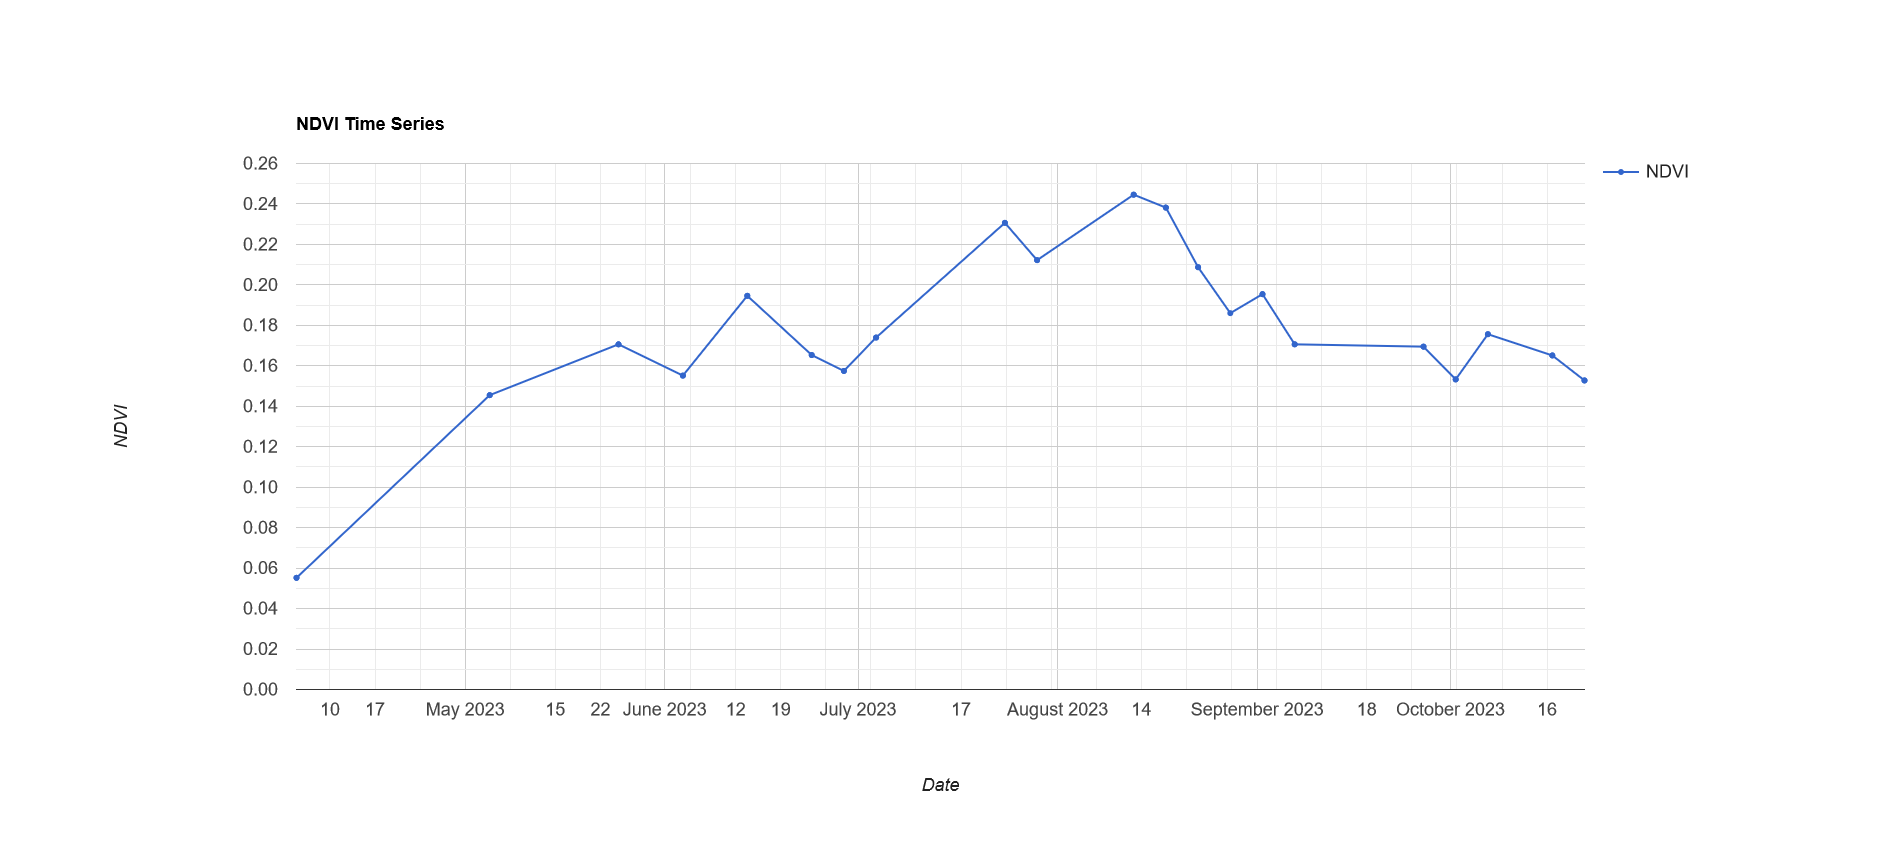
NDVI chart, Omaha
C. Optical imagery
Optical satellite imagery plays a role in observing and analyzing Earth’s surface by capturing images using visible and near-infrared light. For example, it is extensively used in urban monitoring to track city growth and infrastructure development, and in iceberg monitoring, such as tracking the formation and movement of icebergs, providing data for environmental and navigational safety.
The first of the visualizations below shows the Eye of the Sahara – a circular geological structure resembling a crater. Over time, even the desert area changes its face!
Eye of Sahara, 2018 – 2024, Sentinel-2
The next visualization is the effect of humans’ negative impact on global warming – the calving event in Antarctica. Iceberg A-83 was formed on May 20, 2024. Thanks to satellite imagery, it is possible to monitor such objects and provide early warning of such events.
Halloween Crack, Iceberg A-83 breaks
The latest visualization of satellite optical images reveals the agglomeration of Paris in 2020-2023. The use of such imagery is useful for urban planning and analysis of city development.
Paris agglomeration, 2020-2023, Sentinel-2
D. Radar imagery
Sentinel-1 radar imagery provides all-weather, day-and-night EO capabilities, making it invaluable for monitoring environmental changes, land cover, and emergency response activities. Its SAR technology is beneficial for mapping surface deformations, ice monitoring, and maritime surveillance due to its ability to penetrate clouds and darkness.
The time-series below showcases the movement of floating objects in the Upper Bay in New York in the period from 2020 to 2023. The detection capabilities of radar technology, regardless of the time of day or weather, are used to track objects and monitor changes on the earth’s surface.
Upper Bay, New York, 2020-2023, Sentinel-1
GEE for Everyone
One of Google Earth Engine’s most significant strengths is its accessibility. It is designed to be accessible to a wide range of users, not just traditional remote sensing experts.
Users can interact with the platform through a user-friendly web interface or programmatically using the GEE API, which supports multiple programming languages such as JavaScript and Python.
Additionally, GEE offers extensive documentation, tutorials, and an active user community, making it easier for newcomers to get started. When searching the Internet, you can find many studies of satellite data using GEE, which emphasizes the importance of this tool in the development of algorithms. Based on the EO Hub Report, approximately one-fifth of users use GEE in their daily work. This shows that it is a competitive tool for Esri products or open-source QGIS.
Conclusion
Google Earth Engine represents a monumental leap forward in our ability to understand and manage Earth’s environment. By combining a collection of satellite imagery with analytical tools, GEE enables us to tackle complex environmental challenges with efficiency and scale!
Getting back to time-series visualizations, which phenomena would you like to present using the Google Earth Engine?

#Environment
Next article
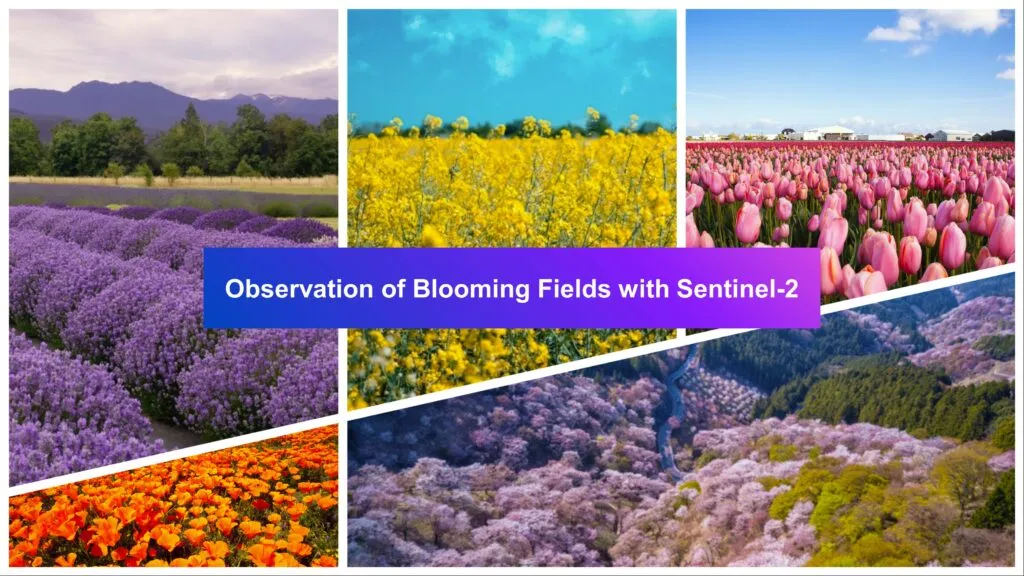
Spring is the time when nature is reborn after winter. On social media we can notice plenty of images of blooming trees and flowers in parks and meadows. Is there any scientific explanation for a flood of photos on social media? Well, there is. Did you know that in May and June in Europe, we can notice the highest NDVI index rate? The main cause of this phenomenon is the fact that a balanced amount of rainfall and optimal temperature enhance plant growth and vegetation.
The term “blooming earth” generally refers to the seasonal blooming of flowers, plants, and vegetation across different regions of the planet. It captures the vibrant and colorful displays of blooming that occur during spring and other times of the year.
People love flowers, making the whole world more colorful. Seeing flower fields from the ground is common, but have you ever wondered what blooming meadows look like from space?
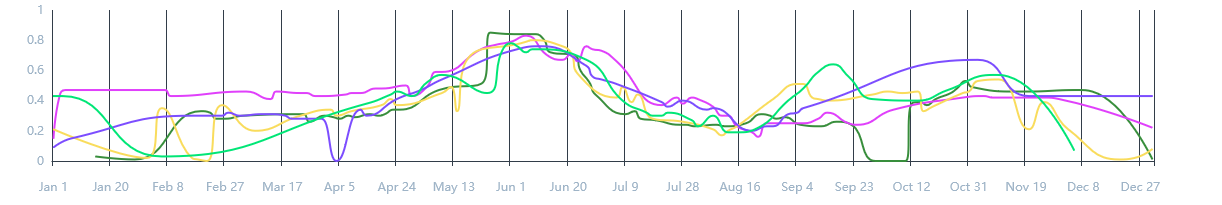
Example of the distribution of the NDVI index over the years 2019-2023. Source: crop-monitoring.eos.com
Observing Earth with satellite imagery
The blooming of vegetation, especially large-scale events like wildflower “super blooms” or agricultural crop blooms, can be detected and observed from space using satellite imagery. Satellites such as Sentinel-2, the optical satellite, can capture the distinct spectral signatures and changing colors associated with blooming events across our planet. Sentinel-2 allows to monitor the Earth’s surface with a resolution of up to 10 meters. The main problem in finding an appropriate image is the cloud coverage. This satellite is not able to penetrate the clouds. So, imagery of flowering fields using the example of the UK border with a miracle. The second issue is finding imagery from an exact period of time. For instance, the super blooming phenomenon, which occurs in the USA, can literally last a few days. Sentinel-2 satellite may simply not have time to take the photo of suitable terrain.
SentinelHub is a great solution for finding satellite imagery from Sentinel, Landsat or MODIS. It allows you to make selections in the defined ROI and time range – even from a dozen years ago. Moreover, it’s a powerful tool to play with spectral bands and visualize the data.
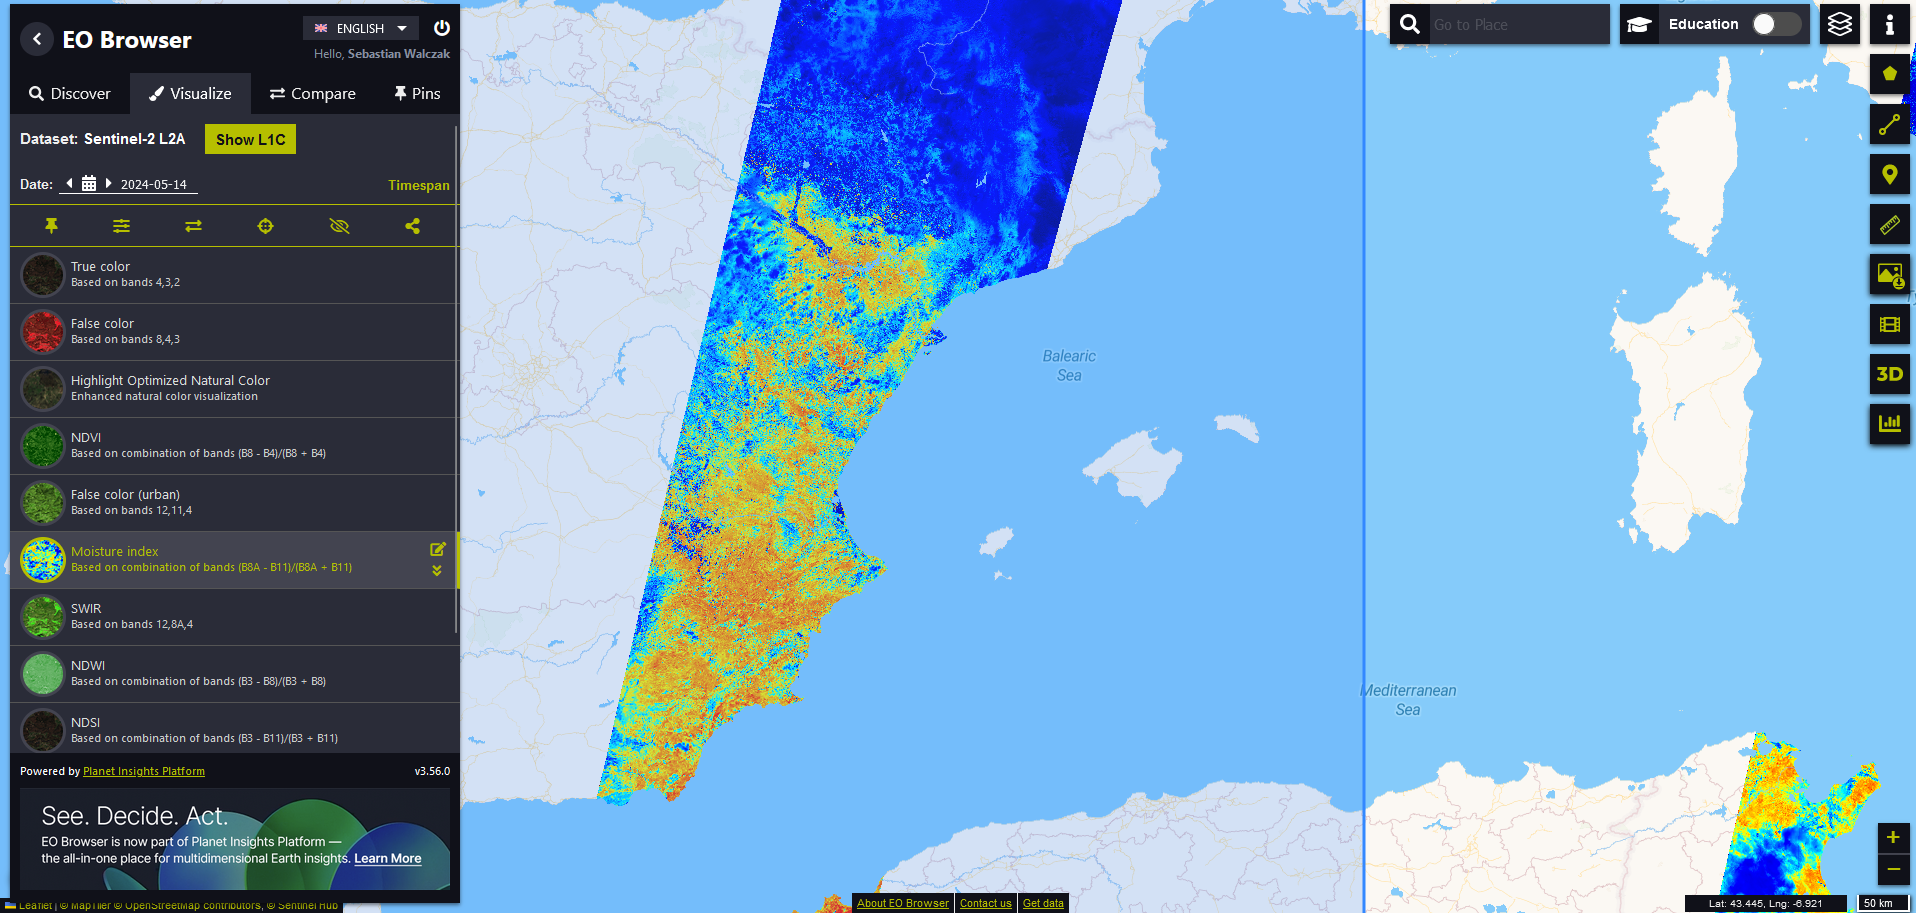
SentinelHub – overview
Blooming Earth in Sentinel-2 images
1. Lavender fields
Sentinel-2 imagery of the lavender fields in Valensole, France, during the period of June to July, captures the vibrant, blooming lavender in full splendor. These images not only provide visual beauty but also offer insights into agricultural practices and bloom intensity, which can be crucial for local farmers and tourism stakeholders. The satellite photos from this specific timeframe help in monitoring the health of the crops and planning the peak times for tourists to visit and experience the picturesque scenery.
2020-06-23 – 2020-07-08, Valensole, France
2. Rapeseed fields
Satellite imagery from February 26 to March 12, 2020, of the rapeseed fields in Luoping County, China, showcases the expansive golden-yellow fields that are characteristic of rapeseed bloom. These images serve as a valuable tool for assessing the extent and health of the crops, aiding agricultural planning and management. Additionally, the vibrant floral expanses captured from above attract photographers and tourists, boosting local tourism during the blooming season.
2020-02-26 – 2020-03-12, Luoping County, China
Satellite imagery from May 9, 2024, capturing the rapeseed fields at the mouth of the Vistula River in Poland, highlights the striking contrast of bright yellow blooms against the surrounding landscape. Sentinel-2 imagery may be crucial for agricultural monitoring, providing data on crop health and growth progress, which assists farmers in optimizing their yields. Additionally, the vivid colors and patterns visible from space and ground also draw attention to the natural beauty of the area, promoting it as a picturesque destination for both domestic and international tourists. This example shows how satellite imagery can provide up-to-date data.
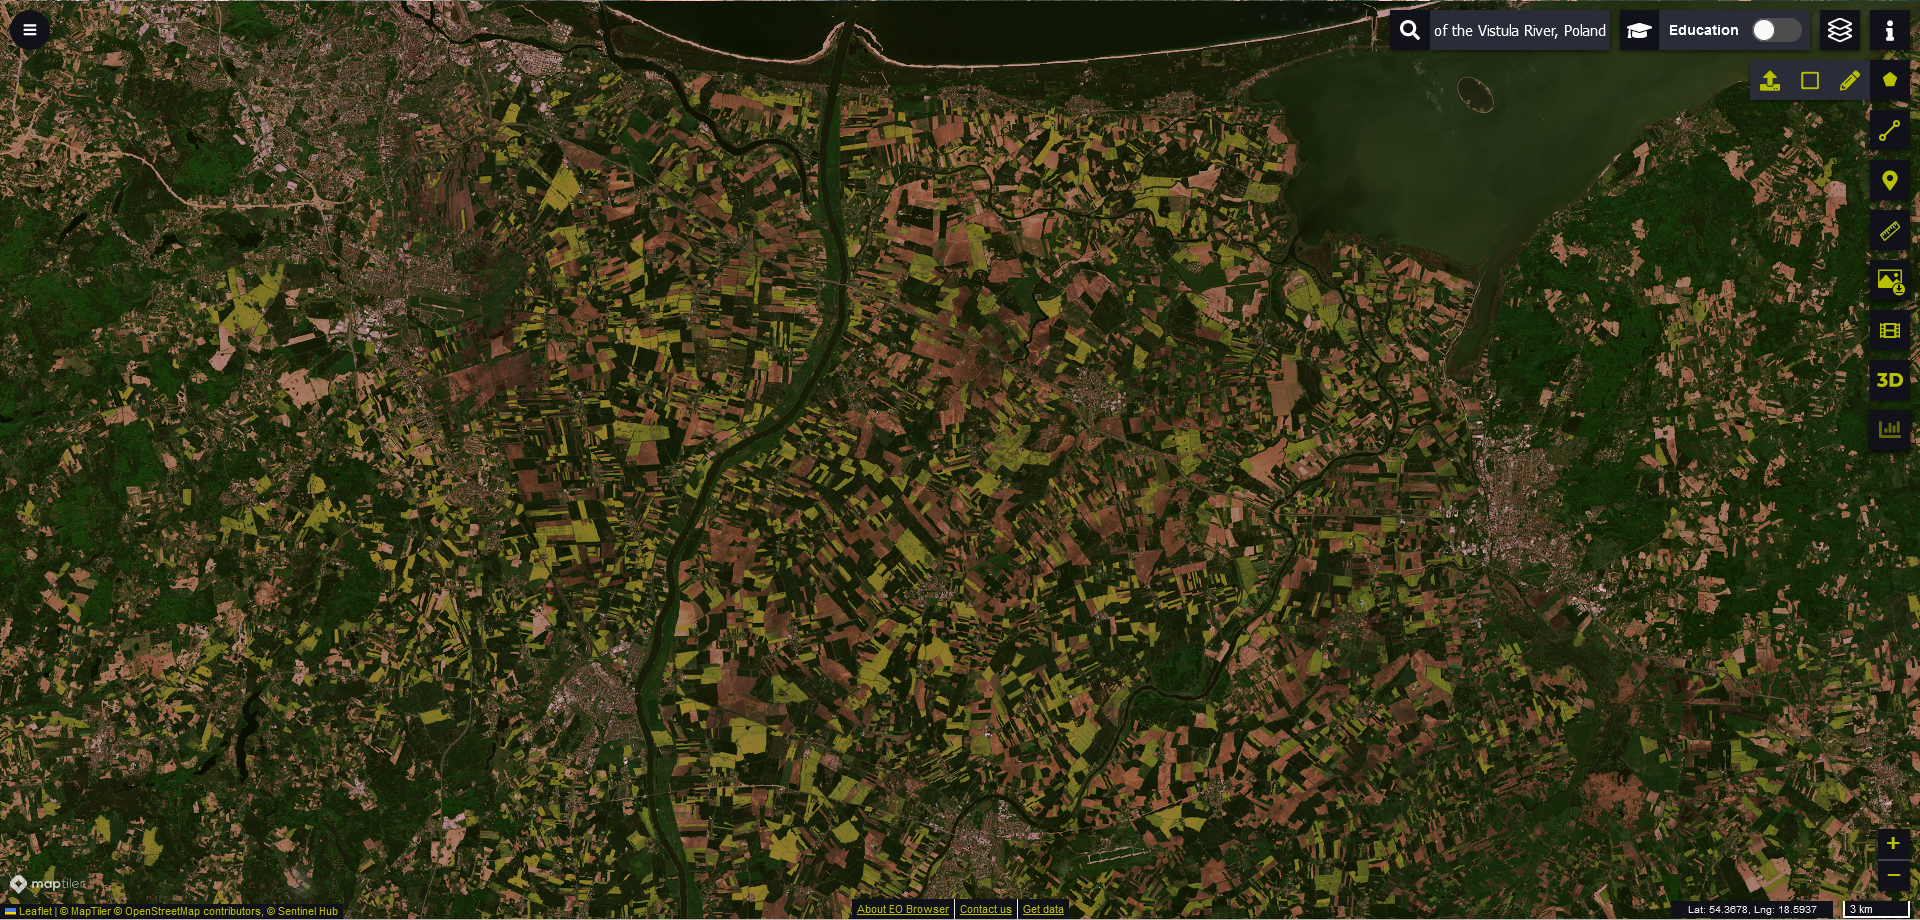
2024-05-09, The mouth of the Vistula River, Poland
3. Tulip fields
Keukenhof, Netherlands is well known for tulip fields. The images below present the transformation as vivid stripes of red, yellow, pink, and orange tulips come into bloom, creating a stunning visual mosaic. The time around 20 of April each year was the best day to see this mosaic of colors.
Time series: 2018-04-21, 2019-04-21, 2020-04-20, 2022-04-20 and 2023-04-30, Keukenhof, Netherlands
4. Blossom trees
Comparison between two satellite images shows the peak blooming period and the period after blooming in Mount Yoshinoyama Blossom Gardens, Japan. These images reveal a view of pink hues blanketing the landscape, offering a perspective on the spatial distribution and density of the blossoms. Time series comparison is often crucial for ecological and agricultural monitoring.
Mount Yoshinoyama Blossom Gardens, April-May 2022
Satellite imagery from March 15, 2018, showcases the blossom gardens in Pingba, Guizhou, China, where the early spring bloom paints the landscape in varied shades of pink. The visual documentation from satellites enhances the appreciation of these gardens’ aesthetic and ecological value, attracting attention from both researchers and tourists.
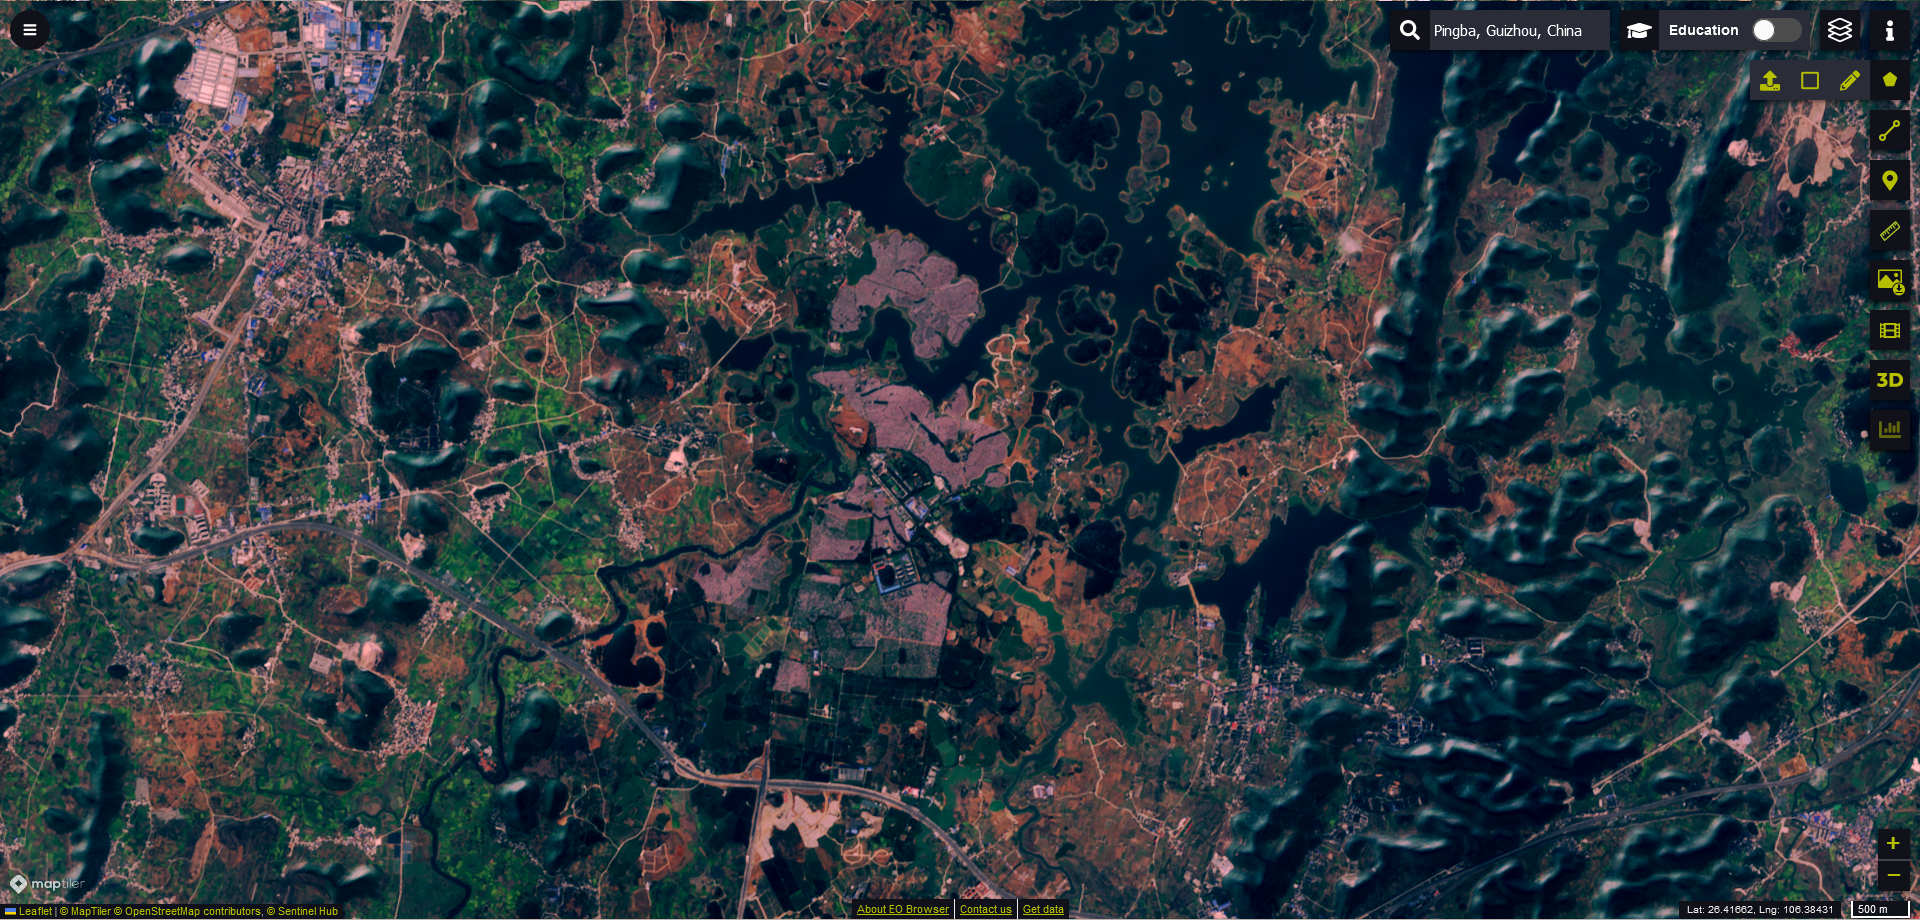
2018-03-15, Pingba, Guizhou, China
5. Super Blooming in USA
This image from April 14, 2019, captures the extraordinary super bloom in Antelope Valley, USA, where the desert landscape was transformed by an extensive and vibrant display of wildflowers. The vivid colors, dominated by orange and yellow, highlight the intensity and spread of this natural event. These images are not only spectacular visually but also serve as critical tools for ecological research, documenting the effects of climatic variations on desert flora.
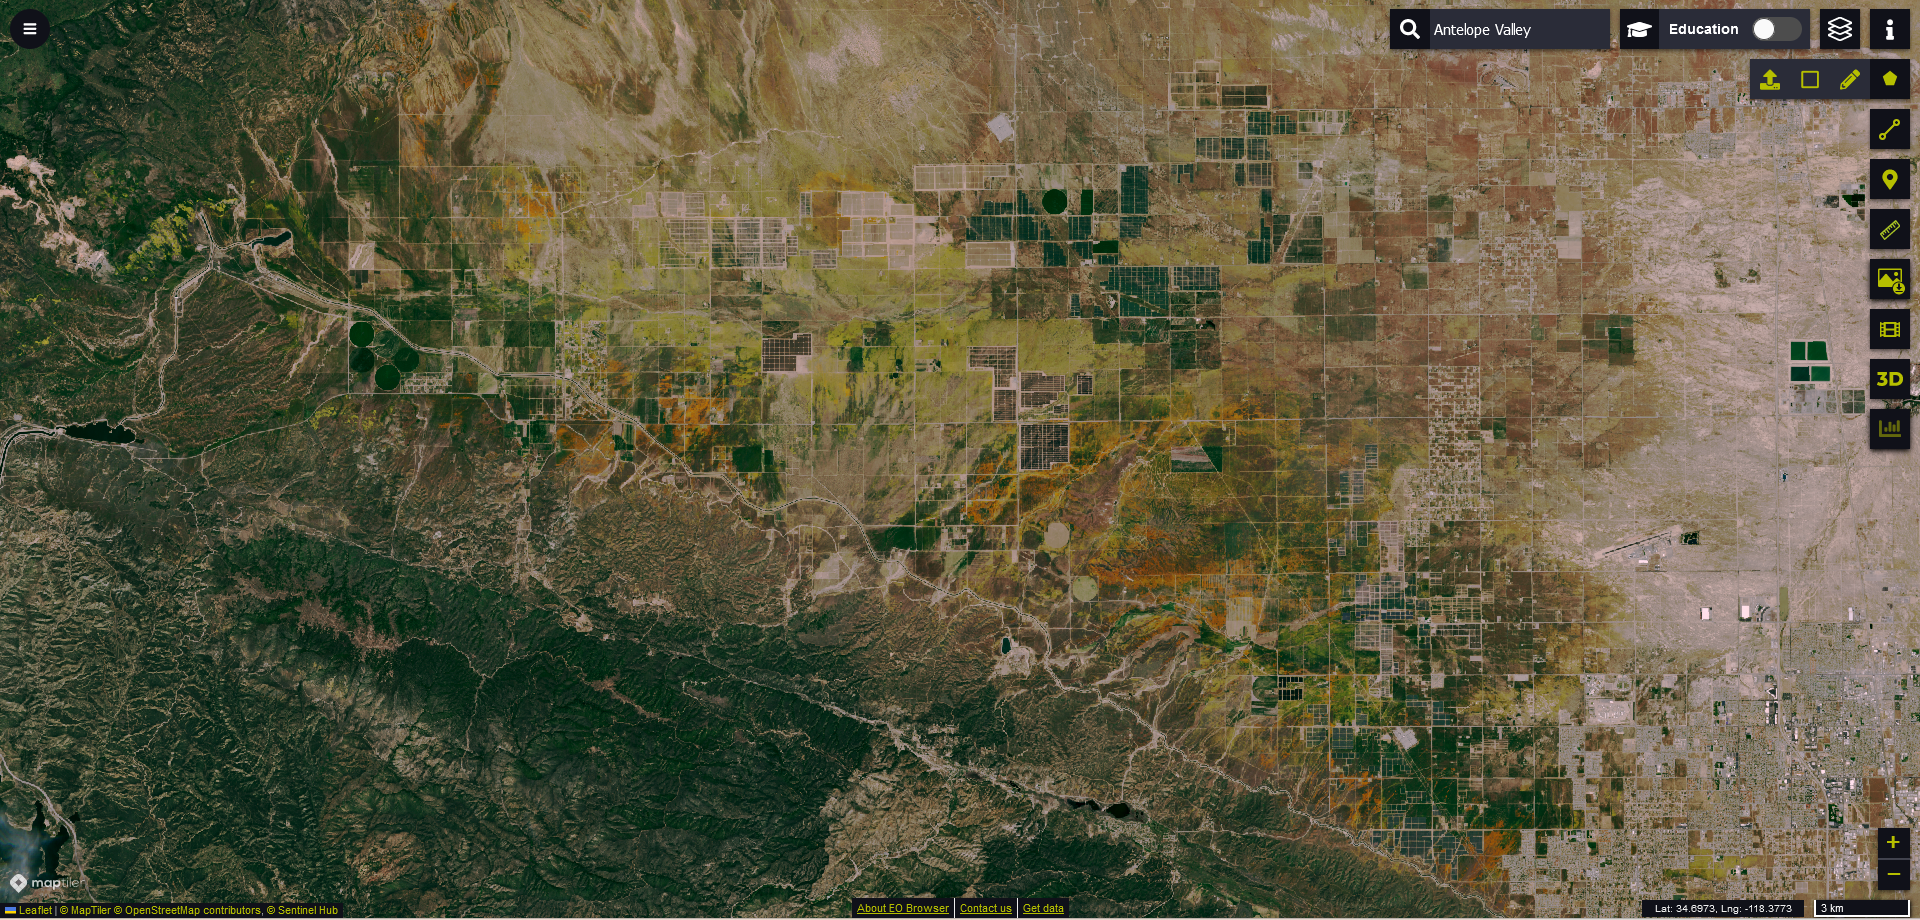
2019-04-14, Antelope Valley, USA
Another visualization from April 7, 2019, reveals the stunning super bloom at Carrizo Plain National Monument, USA, showcasing vast expanses with wildflowers. The visual spectacle of yellows and purples, visible from space, underscores the ecological richness and diversity of the area during peak blooming season.
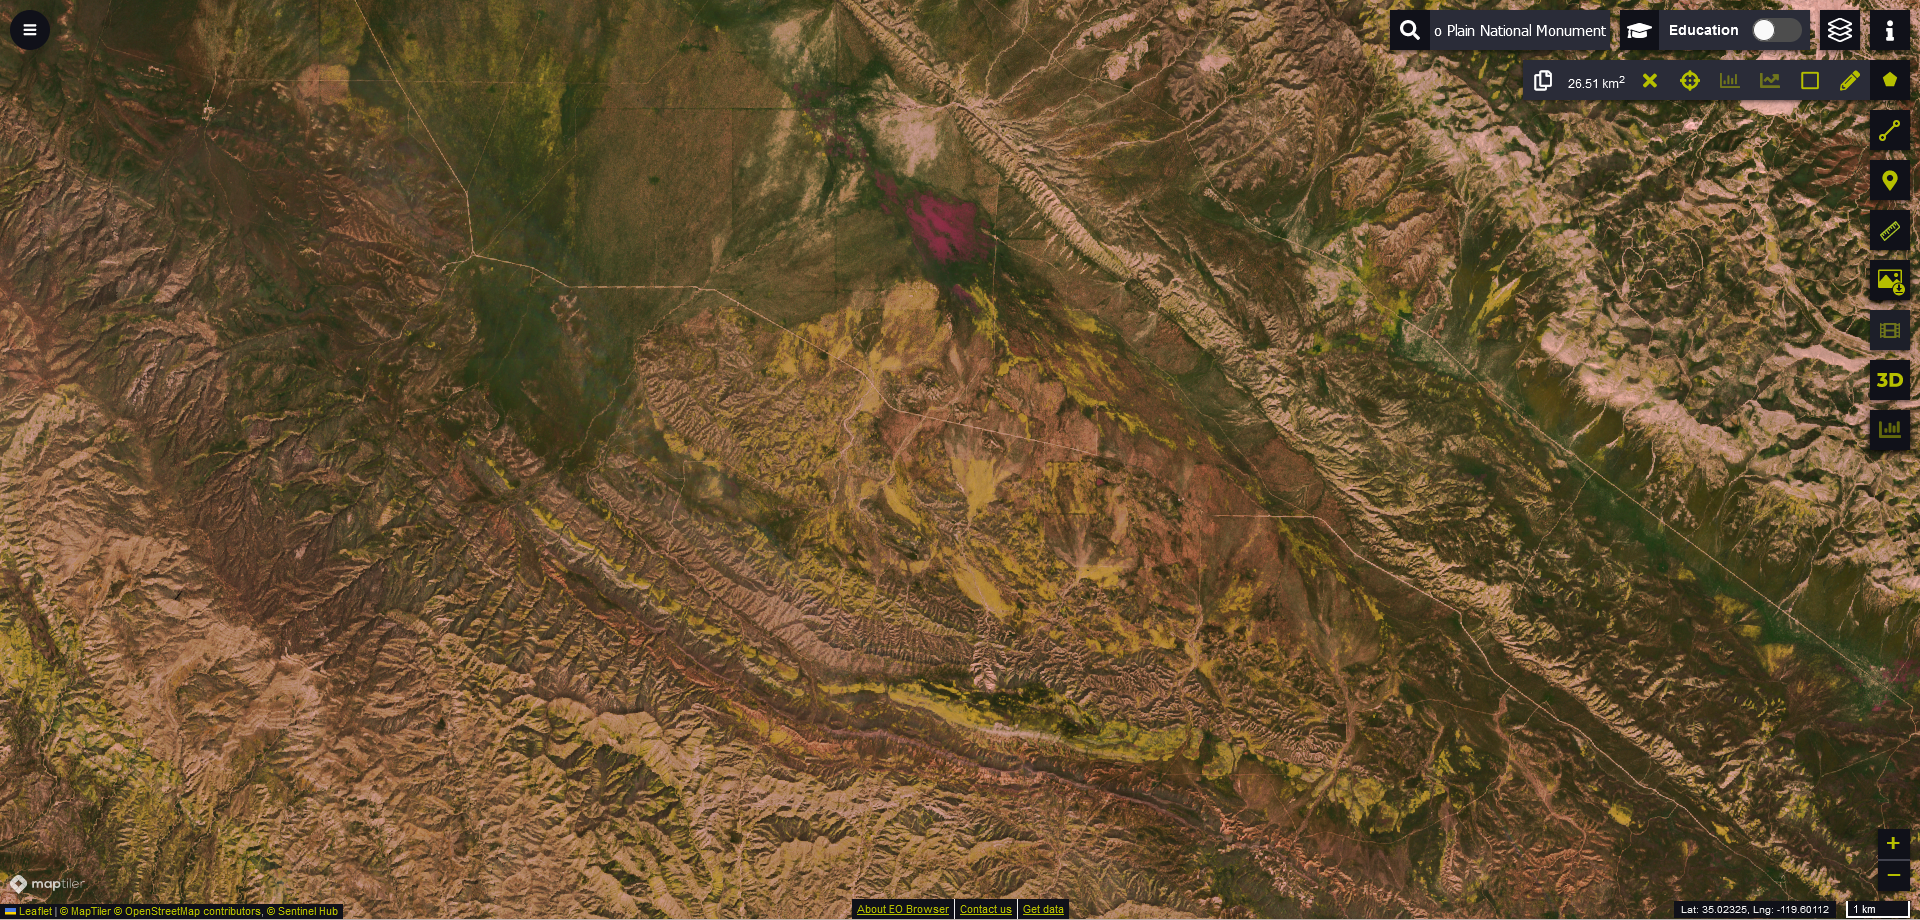
2019-04-07, Carrizo Plain National Monument, USA
In summary
The examples above effectively illustrate the utility of Sentinel-2 satellite imagery in capturing the Earth’s phenological events, such as the vibrant blooms across various global locations. By providing high-resolution images of phenomena like the super blooms in the USA and the seasonal blossoms in the Keukenhof, Netherlands, Sentinel-2 aids in both ecological monitoring and enhancing tourism through its detailed visual records.
Additionally, the discussion about SentinelHub as a platform underscores the importance of accessible satellite imagery for scientific research, agricultural planning, and environmental conservation, highlighting the intersection of technology and nature observation. Apart from the usefulness of satellite imagery, these photos are simply beautiful!
Did you like this post? Read more and subscribe to our monthly newsletter!

