#Business #Featured #People

Explore the unexplored with Felt: Meet Sam Hashemi, CEO of the online platform making mapping effortless for everyone

Maps are increasingly a part of our lives and used to solve some of the world’s biggest challenges—yet the tools many GIS specialists, designers and other professionals use can be difficult to use and desktop based. Mapping has also historically been something that those with little technical training could not explore. 

Sam Hashemi set out to solve this with Felt—an easy-to-use, collaborative, online mapping tool. Felt’s mission is to make mapping effortless for everyone. Scientists can use Felt to monitor habitat loss, urban planners can use it to analyze population dynamics, you and I can use it to map out our next bike ride with friends.

We spoke with Sam to find out more about bringing mapping to the masses so everyone can explore the unexplored:

Thanks for joining us, Sam! With a background in design, you’ve worked at NASA updating 1990s era systems on the International Space Station, the Department of Energy and then co-created urban planning and visualization tool, Remix. How did this incredible journey lead you to the idea for Felt?

That’s right – for something like a decade, I worked on these really complex deep systems at Department of Energy, NASA, and almost every transportation agency across the globe, trying to make them fun and joyful despite a lot of red tape. At Remix, my last company, we helped cities plan out bike lanes, bus routes and design safer streets. You could choose your city, move things around, and it would tell you how much a bus route was going to cost, and what kind of social impact it would have on transportation freedom for the city residents. For the first time, cities were using tools with consumer-grade design, purpose-built for them, and they loved it. In five years, 400 cities, from New York to London to Auckland to San Francisco, started using Remix. 

I’m a designer, so through all of this, I spent countless hours with users. And it was hard to miss how often users struggled to make maps. Installing the software, navigating the tools, even figuring out the licensing created a sense of confusion around how to get simple tasks done. Most of all, we saw that it was challenging to share maps with teams, the public, and across organizations. It all happened through PDFs and email thread – like from another era. 

I had personally experienced how Figma had changed my own design team’s productivity –  seamless sharing made workflows move at an extraordinary pace. I thought, what if I could bring that kind of value to people who work with maps day to day? Who are at the forefront of some of our biggest challenges – energy, climate change, transportation and housing? We need to move faster. I put two and two together and started feverishly working on Felt.
Explore the unexplored with Felt: Meet Sam Hashemi, CEO of the online platform making mapping effortless for everyone

In the same way that easy to use platforms like Canva and Figma allow people from all walks of life to quickly create designs and web tools that look and function professionally, Felt is doing the same for maps. We love this accessible ethos. How do you think making mapping effortless in this way will affect the creativity and the diversity of the people creating maps? 

Accessible tools transform who gets to tell their own story and explore their own ideas. One fun example happened recently when Peter Fabor, CEO & Founder at surfoffice.com, who is building products for hospitality and real estate, used Felt to map all the touristy places in Mallorca, Spain. He noticed that the number of Euronet ATMs usually correlates with how popular a certain location is, found all the ATM locations on Google Maps, then uploaded data into Felt and used Felt visualization features to create a heat map of the ATMs in Mallorca.

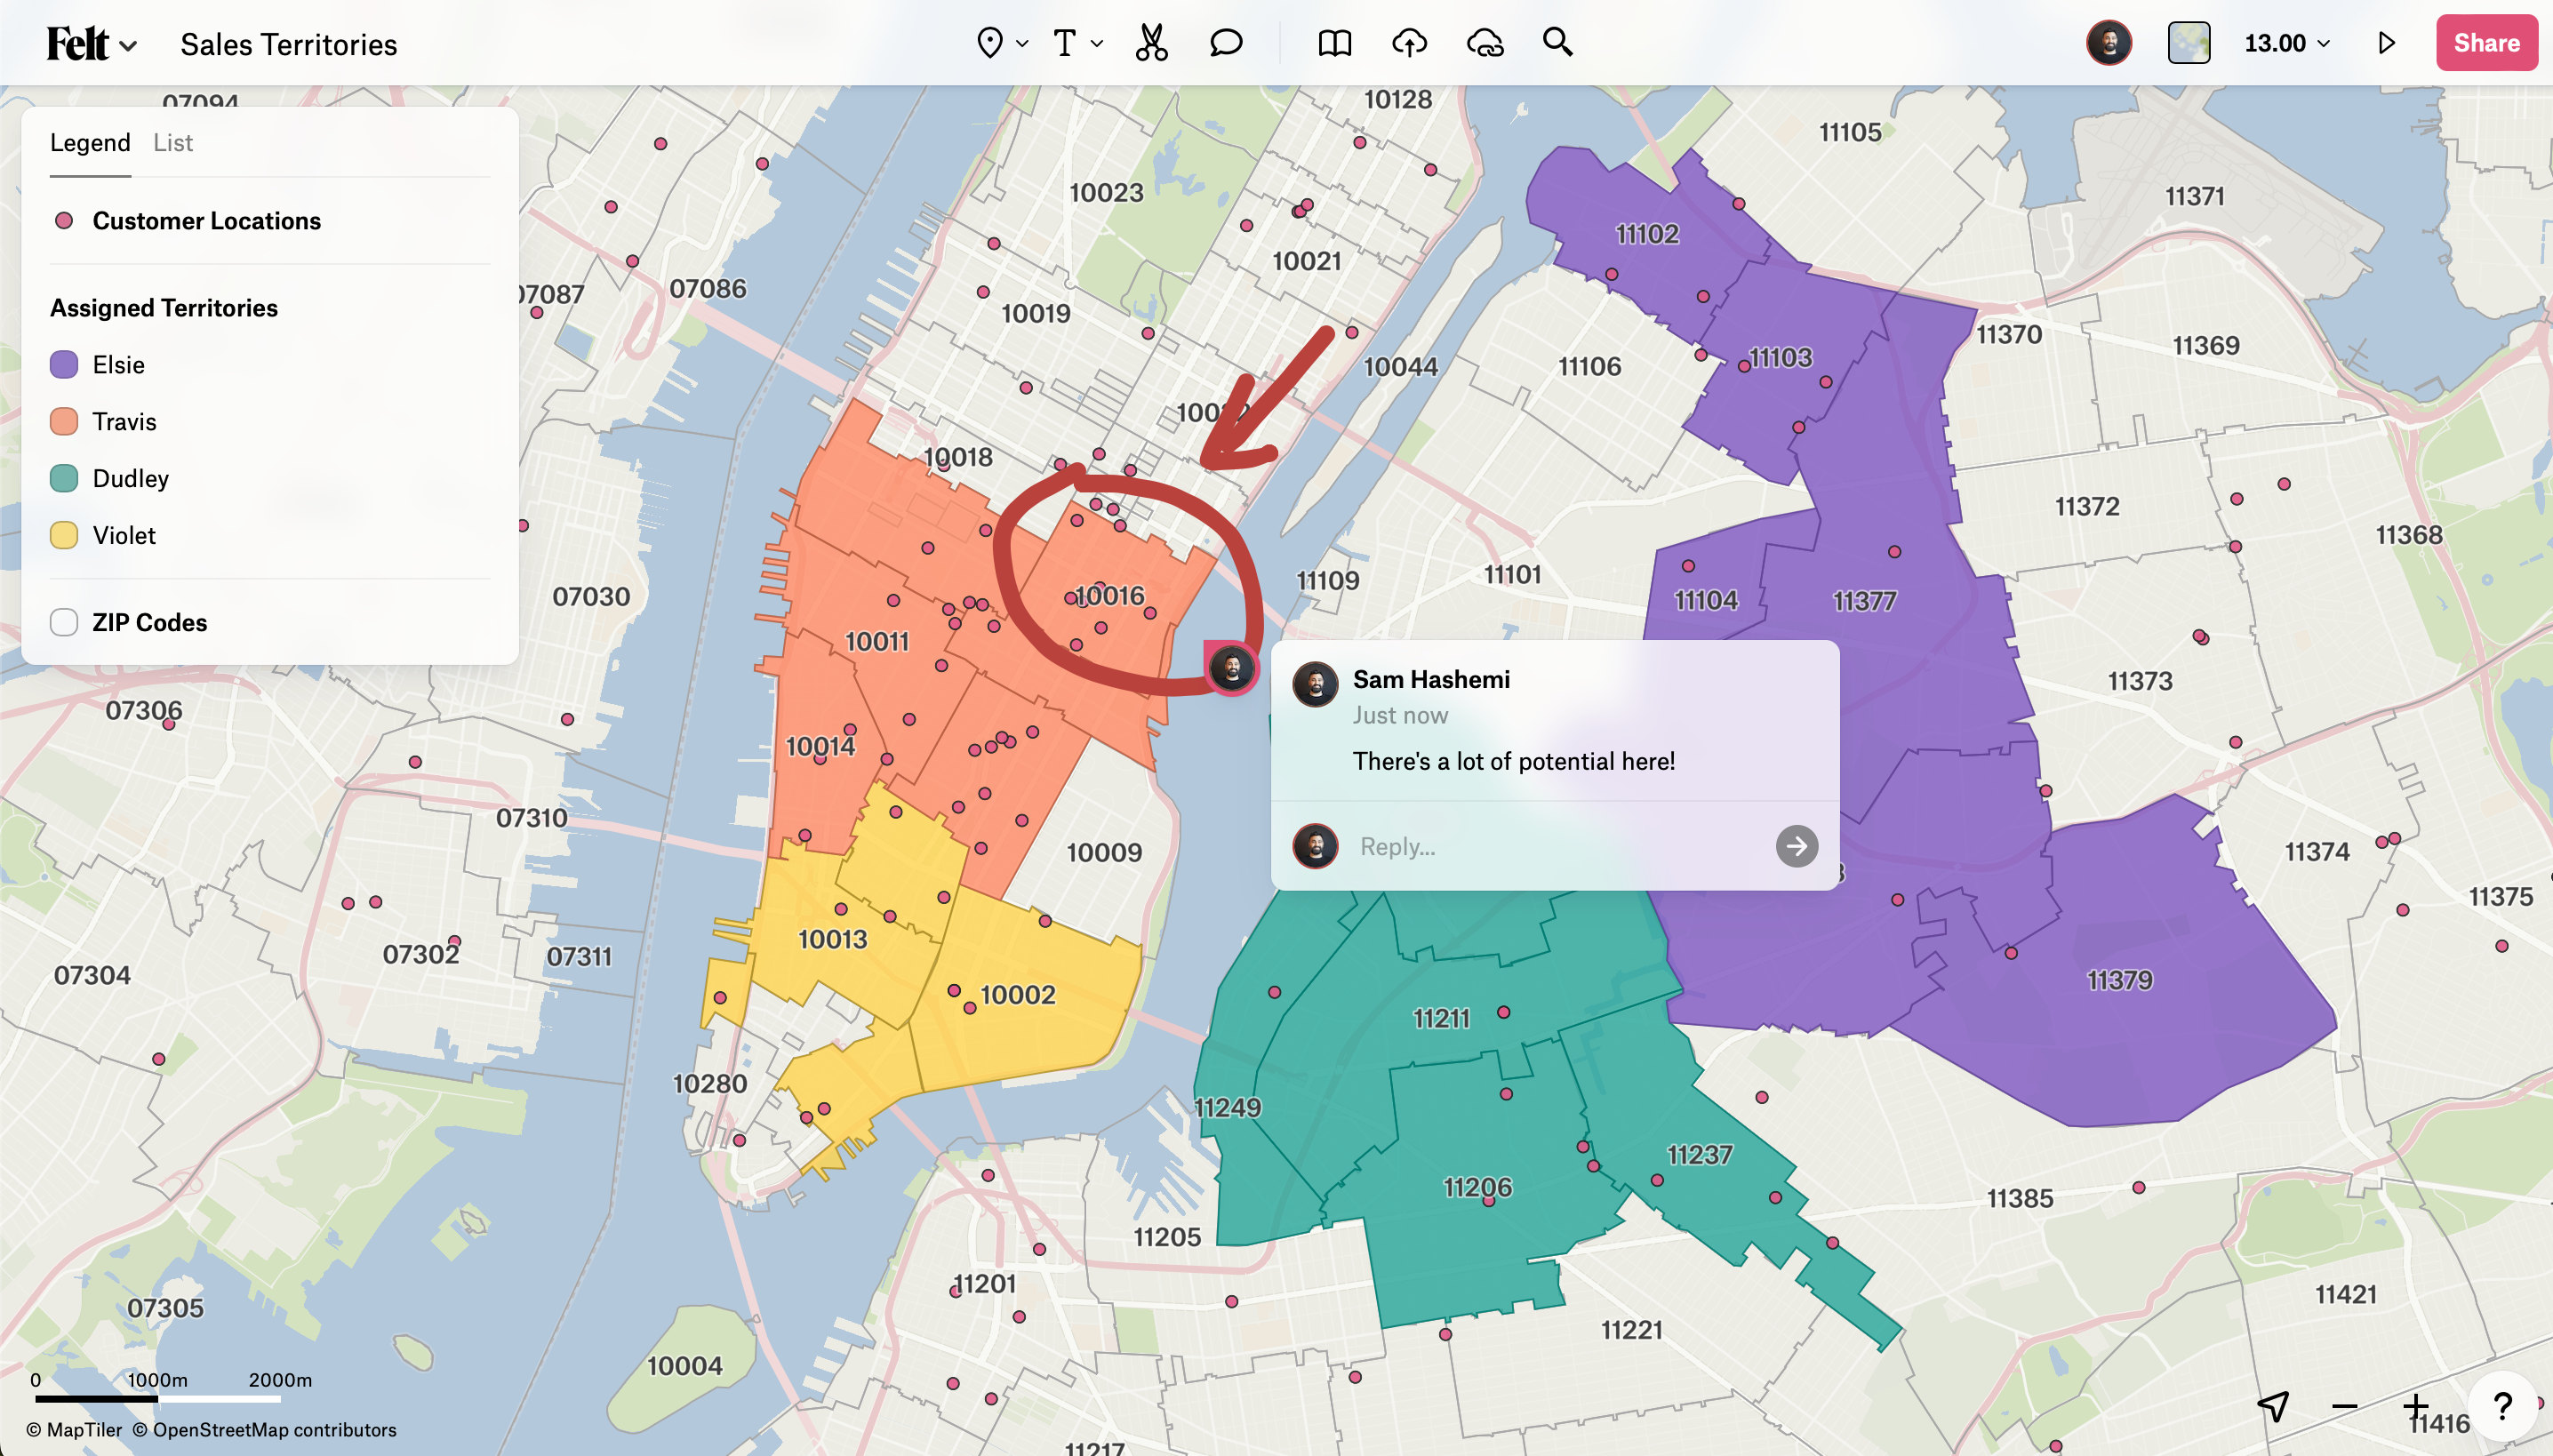
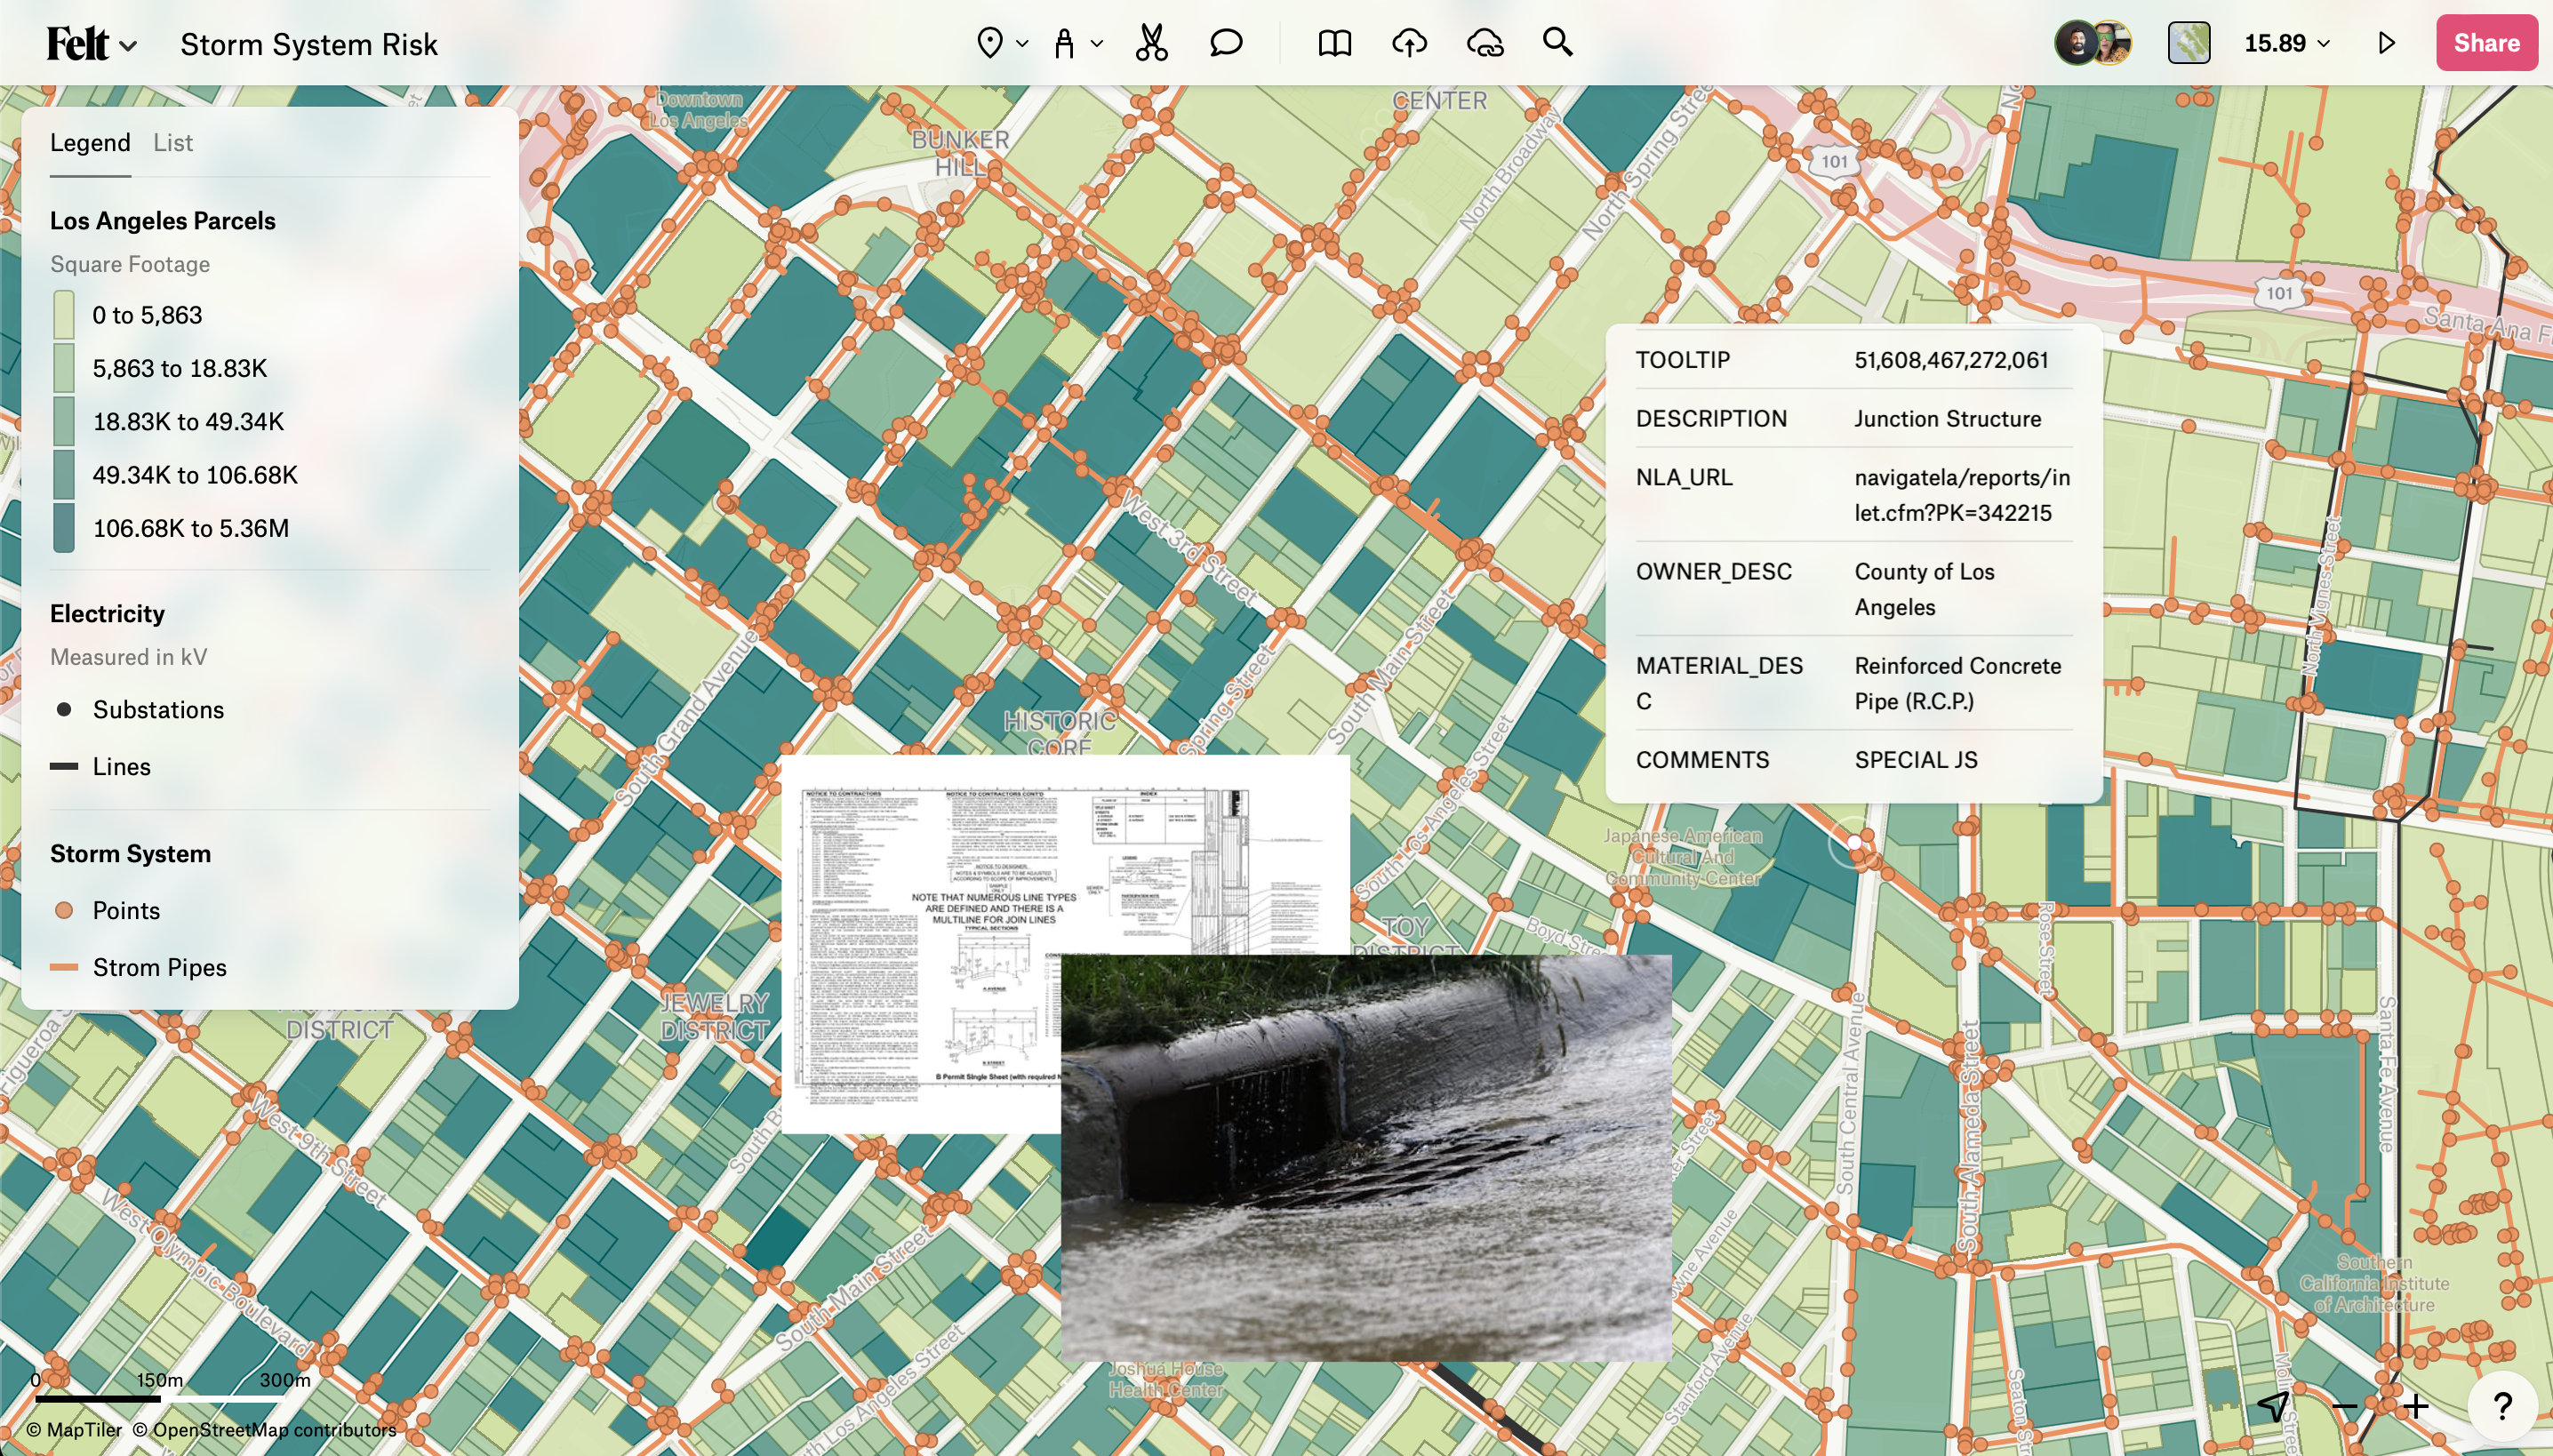
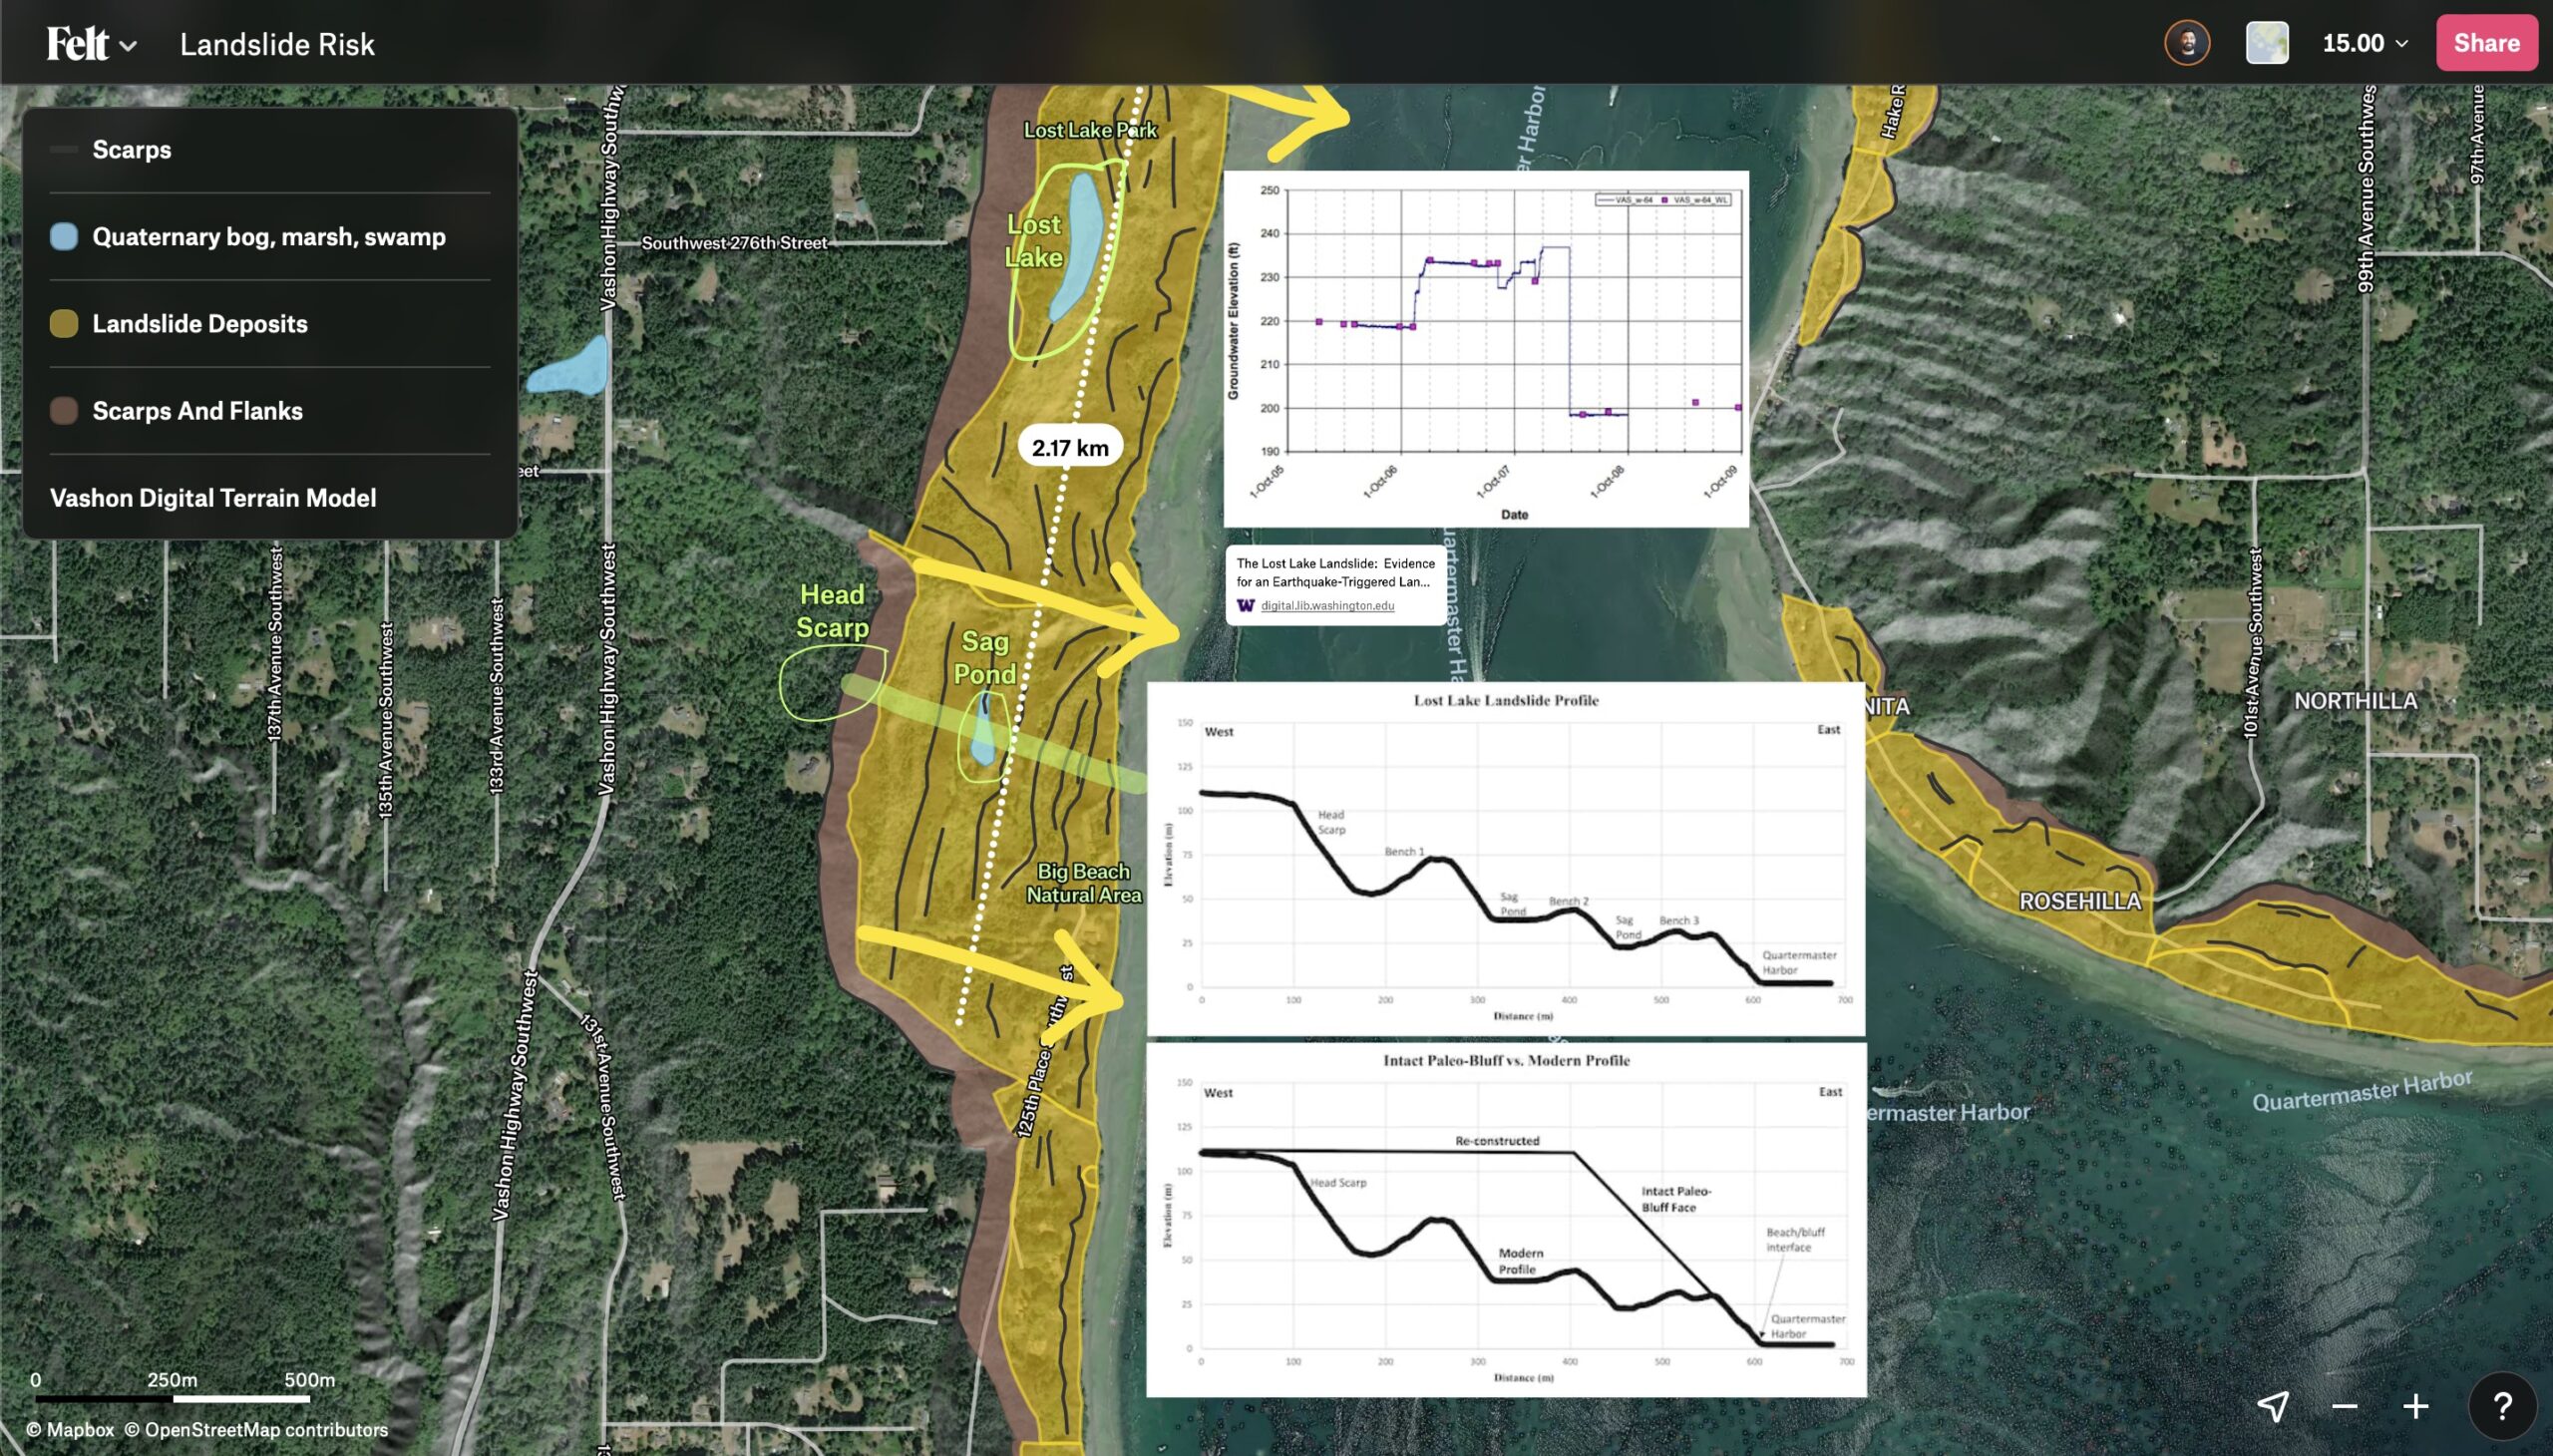
And that’s just one person without having an extensive GIS background who got to explore an idea even and see if it made sense spatially — here are some of my favorite recent maps:

But the benefits of accessible tools also extend to teams and teamwork. Very often, team members who don’t have GIS skills find themselves on the sidelines of mapping projects. With Felt, they are able to interact with maps and better illustrate their ideas.
Explore the unexplored with Felt: Meet Sam Hashemi, CEO of the online platform making mapping effortless for everyone

You founded Felt to do what barrier-lowering companies like Google did for docs and what Figma did for design. Can you tell us more about the new generation of design principles and toolings Felt uses to do this and how they create a more approachable alternative to existing mapping tools?

I don’t think this is a new approach, but the number one thing we do is focus on the user. Whether you’re a pro or new to maps, every step you take in Felt should feel intuitive, fast, and the app should feel wildly performant. Our users immediately note this, because in the past, they’ve had to spend hours, even days, learning where software buttons live and the meaning behind endless form field prompts in order to achieve their goal. So using Felt, being able to drag and drop data right onto the map and watch it visualize instantly, is a breath of fresh air.

We recently released Transformations, a powerful set of spatial analysis tools that work in the browser. Transformations can be expensive timewise – you really don’t want to run the wrong one. Plus, if you’re new to them, you could spend a lot of time figuring out what layer to put in what field. Not a great experience. In Felt, we introduced previews. This way, users could see what the transformation would do before they run it. It might seem small, but users love it — they now have confidence in what they are doing, and newbies can learn transformations by flipping through previews instead of reading a blog post. 

With so much data readily available at people’s fingertips, how does Felt lower the barrier to analyzing data? What role does Felt’s cloud storage and computing power play in processing data-heavy requests?

Felt is entirely cloud-based. By leveraging scalable and flexible cloud infrastructure, we can handle large datasets efficiently without hardware constraints. It also allows for faster processing speeds, improved performance, and real-time collaborative capabilities, and enables teams to work seamlessly on data analysis from anywhere – which is more and more important. 

With Felt, users can easily create their own maps, add new data points, and share the results with others. How do you envision users of all backgrounds and mapping abilities using Felt both individually and in a live, collaborative way? 

We love the #30DayMapChallenge on socials — every day in November, we saw so many maps individuals with different backgrounds could create in Felt! 

Real-time data collaboration is another neat feature that we created. Users are adopting this feature across many different use cases. Cycling advocate William Petty recently led a task force to survey cycling infrastructure conditions across Hackney, London. He managed this data collection project in Felt, collaborating with several other stakeholders, then processed that data into a final map of intersections and gateways that would make for safer cycling.

Environmental activists in Australia are campaigning for transformative water policies by asking people who live in the region to post pictures of themselves to this Felt map.

And behind the scenes, some of the biggest newspaper organizations use Felt to coordinate between journalists on the ground, and the graphics teams printing a story. The journalists confirm the status of what is happening on the ground and where, and the graphics team immediately have geospatial data they can use for their story. 

With collaboration built in from the ground up, Felt allows teams from many different industries to work more efficiently and avoid silos. 
Explore the unexplored with Felt: Meet Sam Hashemi, CEO of the online platform making mapping effortless for everyone

Your team works fast as we see updates being rolled out regularly! Most recently, a new version of Felt, Felt 2.0 was launched — tailored towards enterprise use, while remaining approachable in its user interface. Congratulations! Could you tell us more about how Felt 2.0 marks the beginning of a new chapter for the platform? 

That’s awesome that you follow along! It’s very true that we are constantly delivering new features to our users, and recently we released Felt 2.0, a set of powerful spatial analysis features, and a UI redesign that gives our users more space and quicker interactions with the key features they care about. These changes were made in response to our growing user base of people who are interacting with maps daily for operations and analysis. You can read about this new chapter here

Are there any particular Felt features or updates that you’re particularly excited about?

I’m excited about everything we launch. I’m a product person, and I love delivering designs that change how people interact with problems. For Felt 2.0, I’m really proud of how we designed Previews into Transformations. 

As I mentioned in an earlier question, mistakes can be costly if you run an incorrect transformation in other GIS software. We wanted to give our users the opposite experience: confidence they are going to get the correct output. So we delivered previews, and our early testing groups all called it out as a great new feature that made the interaction feel great.

Your Design Lead, Loren Baxter, joined us at our recent webinar on how browser-based mapping will change the way we work with maps. How do you think browser-based, internet-native mapping will change professional mapping workflows?

Today, maps are very much trapped on the desktop, in PDFs, or as screenshots in emails. And as a result, the review cycle is painful, lengthy, and costly.

By shifting mapping tools to the browser, accessibility becomes universal. Comments are made directly on the map, data files are shared via a map link, where they are already visualized – no extra steps, no issues with hardware compatibility for the viewer, or software needing to be installed. 

The universal accessibility of web-based tools has already transformed the workflows of Felt users. We’ve had users in the telecom industry write in to tell us they’ve eliminated PDFs from their workflow and are never going back. Consultants tell us working with clients is so much easier now that they have a way to visualize spatial data and gather feedback without needing their clients to install anything. We are excited to see more and more people experience the benefits of web-based mapping tools.

Why do you think it’s so important that mapping is opened up to the masses? What impact could Felt users make in the world? 

We need better and faster ways to work spatially. Mapping is a fundamental tool for responding to some of the biggest issues of our time: deforestation, sea level rise, hurricanes, forest fires, housing, water scarcity and more. There is so much work to be done. We need tools that support these efforts and empower roles traditionally on the edges, like communications, analytics, planning, or operations, to feel just as empowered to communicate spatially with one another and the public.

Lastly, it’s an exciting time for the company with Felt 2.0 now live. What’s next for Felt? 

We are known for our development speed. To keep up with where we are headed, sign up for a Felt account. You’re automatically added to our product updates newsletter.


Did you like the article? Read more and subscribe to our monthly newsletter!

Say thanks for this article (2)
The community is supported by:
Become a sponsor
#Business
#Business #Featured #GeoDev
Geo Addressing Decoded Part 2: Beyond Coordinates – Exploring the Depth and Impact of Geo Addressing
Aleks Buczkowski 05.2.2024
AWESOME 4
#Business #Events
SatSummit 2024 Reflections: The evolving landscape of Earth Observation
Avatar for Florian Fichtner
Florian Fichtner 05.22.2024
AWESOME 9
#Business #Featured #People
How can we achieve a sustainable, safer and fairer society for all? With trusted geospatial data, says EuroGeographics
Nikita Marwaha Kraetzig 12.6.2023
AWESOME 1
Next article
#Business #Featured #People

How can we achieve a sustainable, safer and fairer society for all? With trusted geospatial data, says EuroGeographics

It was recently announced that data from official national sources is one of Europe’s most valuable resources in achieving a sustainable, safer and fairer society. The showcase by members of EuroGeographics, the not-for-profit membership association for Europe’s National Mapping, Cadastral and Land Registry Authorities, highlighted their role in providing fundamental information to implement the United Nations’ Sustainable Development Goals (SDGs).

We sat down with EuroGeographics’ new Secretary General and Executive Director, Sallie Payne Snell, to learn more.

Firstly, congratulations! As an international not-for-profit organization, we’d love to learn more about your work representing providers of geospatial data. Could you tell us about what you’ll be focusing on in your new role?

Thank you! I’d like to start by emphasising what a great privilege it is to represent official providers of the trusted geospatial information that is fundamental to the everyday lives of people across Europe. 

I am committed to championing its members’ data and expertise. Having previously led the Association’s operations, I’ve gained an in-depth understanding of the technological, legislative and operational challenges and opportunities facing National Mapping, Cadastral and Land Information Authorities and I will be using this to deliver membership benefits that support them in their national, European and global activities.

I’ll be focusing on enabling access to their high-value data and expertise through its integration into the infrastructures we rely upon as a modern society. This includes establishing partnerships with those who share our goal of using geospatial data for the public good; these are vital for meeting user requirements and finding solutions to common challenges.

We’re all about location here at Geoawesomeness. That’s why we were so excited to hear that EuroGeographics recently announced the pivotal role that location data plays in bettering the world. The showcase featured examples from Belgium, France, Germany and The Netherlands to demonstrate how location connects people with place for sustainable development, tackling climate change, creating digital twins, and developing intelligent transport systems. Could you share more about this dynamic between people and place?

Location is a powerful tool – it tells us where things happen but also provides the link between information and action. More than ever before, the world needs accurate data that it can trust is up to date, definitive and detailed – and it needs to know where to find it. 

During our recent event at the European Parliament for MEPs and decision-makers, our members demonstrated how they provide context and clarity to information about people and places, so that we can gain insight and answers to some of the key issues facing society.

From integrating maps and data to provide insights for tackling climate change, providing information to support energy transition, and enabling multimodal transport strategies and digital transformation, we have a wide range of case studies on our website showing how members data and expertise play a key role in realising a sustainable, safer and fairer society. 

How can we achieve a sustainable, safer, and fairer society for all? With trusted geospatial data, says EuroGeographics

The Sustainable Development Goals are crucial as a framework for the world to work towards. What role do you think geospatial data plays in us meeting them? And why is this new announcement about geospatial data so important to highlight?

Geospatial data enables the connection between people, their location and place, and in doing so allows us to measure where progress is, or is not, being made. 

The United Nations recognises that a strong global geospatial infrastructure is an essential enabler for achieving its 2030 Agenda, but it’s not just the Sustainable Development Goals that depends on this information; sustainable development is also a priority objective for EU policy. 

Data from official national sources is therefore one of Europe’s most valuable resources in gaining momentum towards a sustainable, safer and fairer society. 

We work closely with colleagues in the European Parliament, Commission and its agencies, enabling them to access our members’ high-value data and expertise to realise a wide range of policies, including the EU’s Digital Decade and Green Deal. And as a friend of the EU Mission Adaptation to Climate Change, we fully endorse its charter and are committed to using our expertise and extensive network to strive towards climate resilience by 2030.

As the use of official geospatial data for the global indicators of the SDGs increases, what challenges do you foresee that may need to be overcome (e.g data access, processing capabilities, availability, cost)? How can the geospatial community contribute to solving these and what difference can we make together?

World leaders at the UN Sustainable Development Goals Summit, held recently in New York, expressed their alarm that their achievement is in peril. 

We are now only seven short years away from 2030, and we are going through a time of crises and challenges – a global pandemic, conflict, and climate, food, fuel and global trade supply chain disruptions. Together these have contributed to a setback in delivering the Sustainable Development Goals – we know this because we have been measuring and monitoring our progress. 

We obviously need to not only get back on track in leaving no-one behind, but also to get ahead of these crises. So, we need to understand where we are against the Sustainable Development Goals to target action. This is where geospatial data plays a key role. 

The Sustainable Development Goals Report 2023 Special Edition highlights data challenges, calls for more inclusive data for development, and states the need to strengthen coordination within national data ecosystems.

At the United Nations Committee of Experts on Global Geospatial Information Management’s thirteenth session, we offered our support in enabling access to members’ high-value European geospatial data, sharing expertise and best practice, and demonstrating the use and value of location to provide a stronger and more inclusive development framework beyond 2030. 

The UN-endorsed Integrated Geospatial Information Framework – or IGIF, which is being implemented by many of our members, helps to address these issues. The IGIF provides decision-makers with compelling evidence for strengthening geospatial capabilities in the context of meeting national priorities and global challenges. It enables the progress, measurement and monitoring of the Sustainable Development Goals by strengthening the management of national geospatial information to provide connections, context and clarity.

To fully realise the benefits for current and future generations, we encourage even greater use of official geospatial data for the global indicators of the Sustainable Development Goals. And, we strongly believe that the integration of geospatial data in the next development framework will not only make it stronger and more inclusive, but will also help realise the aspirations held by people around the world for a better future.

Why do you think it’s especially important that geospatial information comes from trusted sources in the modern age of misinformation? How does this impact everyday lives?

In uncertain times, authoritative map, cadastral and land registration information provides certainty to those responsible for making critical decisions. Trusted, transparent and interoperable public sector information based on fundamental rights and common values are key building blocks for a wide range of policies, including the EU’s Digital Decade and Green Deal, and the United Nations 2030 Agenda.

High quality and reliability is the calling card of EuroGeographics members, who provide much more than traditional maps. As the national authorities for official geospatial information in Europe, they use cutting edge technologies to collect, maintain and deliver high-value digital data and services to underpin the infrastructures we rely on as a modern society. 

When we’re looking for somewhere, their maps pinpoint where to find it; when we’re buying property, our members provide secure registration, so ownership is certain; and when we need help, their data enables the emergency services to reach us quickly, saving time, and ultimately lives.

Whether it’s geospatial or land information, data and services provided by members of EuroGeographics are a fundamental part of our everyday lives: from apps, to ordering food deliveries; from online gaming to ensuring we pay the correct amount of tax: in fact, most of us use their information no less than 40 times a day, often without even realising.

Lastly, we know EuroGeographics is leading the Open Maps for Europe 2 (OME2) project. What’s involved in the project and how will it help with ensuring large-scale open data meets technical specifications for the UN Global Geospatial Information Management (UN-GGIM).

EuroGeographics and its members are already delivering high-value pan-European data through the Open Maps for Europe interface. We are building on this success through the OME2 project, which is co-funded by the European Union and responds to user needs for large-scale open data. 

The project also supports the ambitions of the IGIF by aligning the technical specifications for large-scale open data with the core recommendations for content proposed by UN-GGIM: Europe. 

OME2 will develop a new production process and technical specification for free-to-use, edge-matched data under a single open licence. Authoritative 1:10 000 scale data for 10 countries will be delivered via the user interface built by the award-winning Open Maps For Europe Project.

The prototype will provide three datasets, identified as key themes by users and defined as high-value in European Commission’s implementing rules for the Open Data and reuse of Public Sector Information Directive – administrative boundaries, transport and hydrography. OME2 will also enhance the five existing Open Maps For Europe datasets, including the pilot Open Cadastral Map.

Data is at the very start of the value chain, and the European Commission recognises geospatial as high-value data (HVD) offering a wealth of opportunities for reuse due to its compatibility with other datasets. By addressing the challenge of finding, accessing and licensing authoritative pan-European harmonised edge-matched, large-scale data, OME2 benefits both users and national providers of geospatial information. 

For users, it saves time by providing machine-readable data as APIs from one central portal under one easy-to-understand open data licence. As a result, they will no longer need to visit individual Member State geoportals to access specific datasets, spend significant resources connecting them, or agree to multiple licences.”

For our members, who are recognised as important enablers of cross-border data applications and services, the prototype shows how public sector demand for geospatial information in all common data spaces of the European Strategy for Data can be met.

Furthermore, by allowing data to be easily uploaded, converted to the specification for each HVD theme, harmonised and edge-matched, OME2 will enable members to re-use techniques nationally and share good practices, advancing the data sharing tools needed to deliver free-flowing, interoperable data for the single market.

The OME2 project corresponds with Member States’ obligations to implement high-value data and will be completed at the end of 2025. It is being delivered by a consortium comprising: EuroGeographics, the not-for-profit membership association for Europe’s National Mapping, Cadastral and Land Registration Authorities; National Geographic Institute, Belgium; National Institute of Geographic and Forest Information, France; Hellenic Cadastre; General Directorate for the Cadastre, Spain; and Cadastre, Land Registry and Mapping Agency, The Netherlands. 

More information is available at https://eurogeographics.org/


Did you like the article? Read more and subscribe to our monthly newsletter!

Read on
Search