NASA’s Solstice Mission: First topographic images of Saturn’s Moon “Titan”

Titan, Saturn’s largest moon with a radius of about 2600 kilometers is bigger than Planet Mercury and is one of the most Earth-like and interesting “worlds” in the solar system. Titan is special as it’s the only moon in the solar system known to have clouds, surface liquids and a “mysterious” thick atmosphere. Titan’s atmosphere is mostly nitrogen, like Earth’s, but the difference –  methane on Titan acts the way water vapor does on Earth, forming clouds and falling as rain and carving the surface with rivers. “Methane Rainfall”! Now that’s something. Scientists believe that the methane present in the lakes and rivers in Saturn’s Moon could offer answers about the origin of life.

Image credit: NASA/JPL-Caltech/ASI/JHUAPL/Cornell/Weizmann

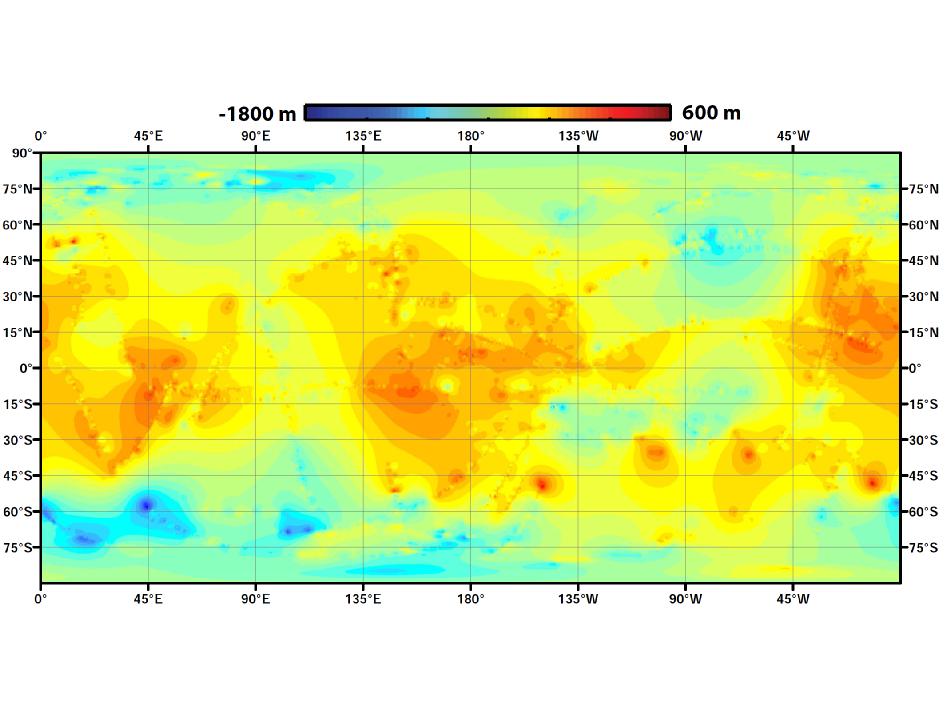
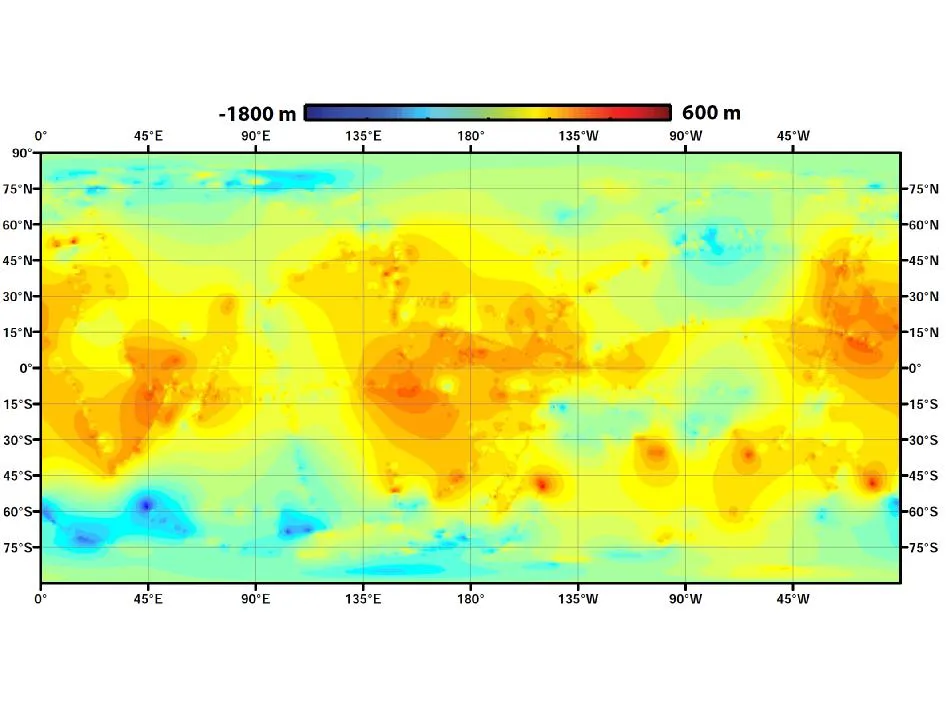
First GLOBAL TOPOGRAPHIC map of Titan
Image credit: NASA/JPL-Caltech/ASI/JHUAPL/Cornell/Weizmann

All this makes this mission to the Saturn’s Moon, all the more AWESOME!

Using data from NASA’s Cassini mission, researchers have now created the first global topographic map of Titan. The significance of the map is self-evident considering that Titan is one of the most Earth-like “celestial object” in the solar system.
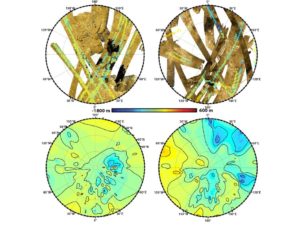
These polar maps show the first global, topographic mapping of Saturn’s moon Titan, using data from NASA's Cassini mission. Image credit: NASA/JPL-Caltech/ASI/JHUAPL/Cornell/Weizmann

These polar maps show the first global, topographic mapping of Saturn’s moon, using data from NASA’s Cassini mission.
Image credit: NASA/JPL-Caltech/ASI/JHUAPL/Cornell/Weizmann


NASA adds

The map team used a mathematical process called splining – effectively using smooth curved surfaces to “join” the areas between grids of existing topography profiles obtained by Cassini’s radar instrument. The estimations fit with current knowledge of the moon – that its polar regions are “lower” than areas around the equator, for example. But connecting those points allows scientists to add new layers to their studies of Titan’s surface, especially those modeling how and where Titan’s rivers flow, and the seasonal distribution of its methane rainfall.”

Titan has so much interesting activity – like flowing liquids and moving sand dunes – but to understand these processes it’s useful to know how the terrain slopes,” Ralph Lorenz, a member of the Cassini radar team based at the Johns Hopkins University Applied Physics Laboratory, Laurel, Md., who led the map-design team. “It’s especially helpful to those studying hydrology and modeling Titan’s climate and weather, who need to know whether there is high ground or low ground driving their models.”

Exciting times indeed!

To know more about Moon of Saturn. Visit NASA’s page


Did you like this post? Read more and subscribe to our monthly newsletter!

Say thanks for this article (0)
The community is supported by:
Become a sponsor
#
#Agriculture #Construction #Energy #Environment #Environmental Protection #Financial Services #GeoDev #Government #Humanitarian #Ideas #Natural Resources #Orthorectification #Satellites #Transportation
Why Orthorectification is Key for Real-World Terrain Mapping and How To Use It
Nikita Marwaha Kraetzig 10.14.2024
AWESOME 2
#Agriculture #Construction #Energy #Environmental Protection #ESG #Financial Services #Geospatial for Good #Government #Health Care #Real Estate #Satellite tasking #Transportation
Simplifying the Process of Tasking a Satellite
Avatar for Barry Morisse
Barry Morisse 05.29.2024
AWESOME 5
#Featured #Ground stations #Satellites
Ground Stations Explained: How Does Satellite Data Travel from Space to Earth?
Nikita Marwaha Kraetzig 02.29.2024
AWESOME 9
Next article

Solar Flare Warning by Japan: What it means for GPS/GNSS

The National Institute of Information and Communications Technology (NICT) in Japan  has warned that satellite transmissions and GPS/GNSS positioning could be affected over the next two weeks if the recent spate of solar flares continue.

Four large solar flares have been detected over the last few days, including one on Tuesday that was the largest of the year. The flares were judged to be “X-class” by NASA and other agencies, the highest in a linear scale based on X-ray measurements. PC World

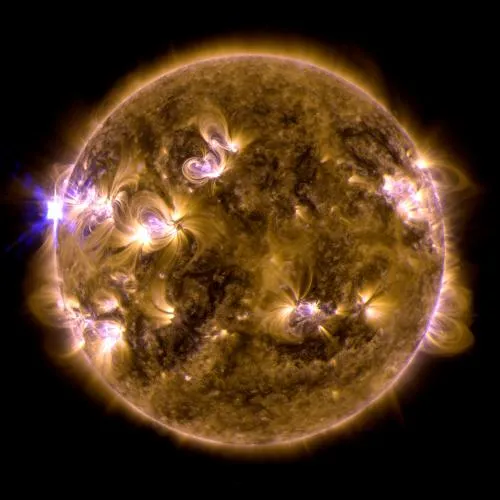
The sun erupted with an X1.7-class solar flare on May 12, 2013. This is a blend of two images of the flare from NASA's Solar Dynamics Observatory: One image shows light in the 171-angstrom wavelength, the other in 131 angstroms. Credit: NASA/SDO/AIA

The sun erupted with an X1.7-class solar flare on May 12, 2013. This is a blend of two images of the flare from NASA’s Solar Dynamics Observatory: One image shows light in the 171-angstrom wavelength, the other in 131 angstroms. Credit: NASA/SDO/AIA

So what’s Solar Flare all about and How does it affect your GPS?

Well the answer to the latter is pretty simple, the solar flares result in an increase in magnetic and electron activity in the atmosphere and as most of us are aware, the ionosphere gets affected under such conditions. This leads to disruption of satellite and radio signals including GPS signals. GPS signals get severely affected and there have been instances where GPS signals have been unavailable because of Solar flares.

The degree to which your GPS gets affected depends on your geographic location, people near the equator like myself are the worst affected as the ionospheric activity is generally higher near the equator and the poles. If you are using a dual frequency receiver, then the effects might be a bit lesser. In recent years, many GPS companies have been bracing up for the solar flare. But in reality there is little in terms of precaution that can be taken to mitigate the effects of solar flares.

There is a danger that man-made satellites such as communications and broadcast satellites could be impaired, errors in high-precision GPS measurements could increase, short wave transmissions could impaired, and power lines could be affected by sudden geomagnetic changes,” the institute said in a press release in Japanese.

Solar Flares as a natural phenomenon have been around for a LONG time now yet our understanding of why it occurs in a certain 11 year cycle is limited. A lot of research sponsored by the GPS industry is happening in the background. I’ll share some of what I heard in the coming week.

Here’s a good link regarding all this. (Phys.org). If you are curious and would like to play around with “solar data”, here’s a wonderful place to start (UK Solar System Data Centre)


Did you like this post? Read more and subscribe to our monthly newsletter!

Read on
Search