#10m #30m #Copernicus #Environmental Protection #Landsat #Multispectral #Natural Resources #Optical #SAR #Vegetation Indexes #Vegetation Management

How satellite data is helping tackle deforestation from global supply chains

Editor’s note: This article was written as part of EO Hub – a journalistic collaboration between UP42 and Geoawesomeness. Created for policymakers, decision makers, geospatial experts and enthusiasts alike, EO Hub is a key resource for anyone trying to understand how Earth observation is transforming our world. Read more about EO Hub here


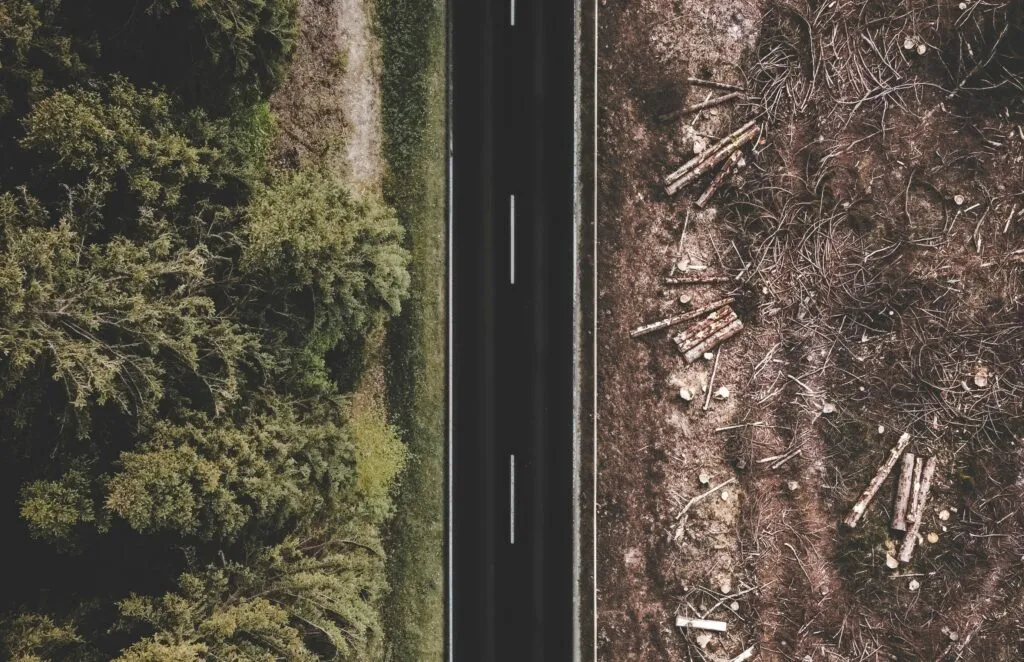
Deforestation has reached cataclysmic levels. Both commodity production and illegal logging contributed to a stunning loss of 4.2 million hectares of primary rainforest across the tropics in 2020, twelve per cent higher than the year before. The World Resources Institute calls the destruction of this primary rainforest a “humanitarian disaster”.

Approximately 40% of the loss of primary rainforests is associated with commodity production, says the WRI.

In response to this problem, the Consumer Goods Forum — an organisation of 400 companies that create the demand for the products that have typically led to deforestation — committed back in 2010 to achieve net zero deforestation. But the “labyrinth of intermediaries between farms, mills and consumer products makes measuring deforestation in supply chains difficult,” the WRI wrote.


In 2014, WRI formed Global Forest Watch (GFW), which uses near-real-time geospatial data to help people better manage forests. Working with more than 60 partners, WRI soon developed and released GFW Pro, a free cloud-based app that lets commodity producers upload data related to their supply chains and so receive geospatial data relative to potential deforestation around those supply chains.

The platform is free and open to anyone, so law enforcement can also use it to help monitor illegal deforestation activities. About a third of GFW Pro users are law enforcement agencies.

GFW works primarily off of open satellite data from the following sources: Landsat (30m resolution), Sentinel (10m resolution) and a recent addition of data from Planet (3m resolution). Although it provides extensive coverage, the optical data of such resolution might not be enough to detect all deforestation issues. Part of the problem is the regular cloud cover in the tropics, where most palm oil and soy products are farmed.
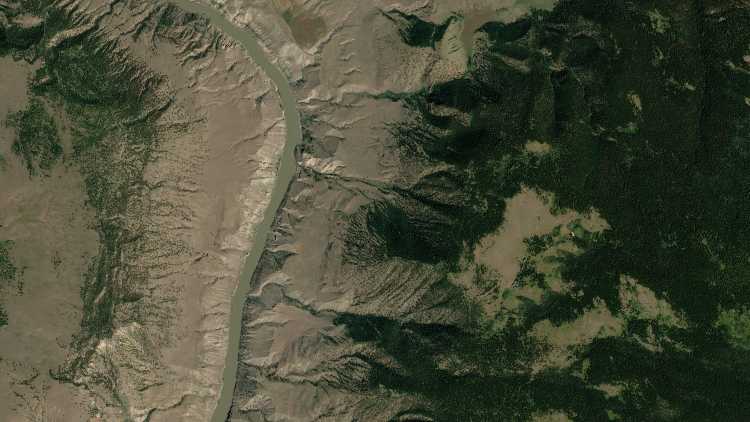
Image courtesy of UP42

Airbus launches Starling initiative with radar sensing

To solve this challenge, in 2017, Airbus partnered with the non-profit The Forest Trust (TFT) and SarVision, a radar satellite imagery expert, to create the Starling service.

By combining radar imagery from satellites such as Sentinel 1 with 1.5m optical SPOT images, it was possible to obtain an accurate view of deforested areas despite cloud cover. Airbus piloted the program for six months with confectionary maker Ferrero and multinational food and drink conglomerate Nestlé before its commercial launch.

Starling provides near real-time forest and land cover information. Using this information, it furnishes detailed dashboards linked to a company’s supply chain that allows the company to take action in areas where deforestation is occurring.

Starling’s monitoring capabilities extend to stating which type of forest is under threat (e.g. palm oil, cocoa, mangrove, etc.) and the system sends alerts when an area changes its status from a forest to a non-forest area.

Google and Unilever partnership

More and more, corporations are turning to satellite data to detect deforestation because on-the-ground measurements are simply too difficult to achieve accurately and at scale.

In 2020, consumer goods multinational Unilever teamed up with Google to use Earth Engine computing power for satellite imagery analytics to gain insight into a series of environmentally related data sets.

According to a Google press release, Google and Unilever were going to use a combination of cloud computing, satellite imagery, and AI to build “a more holistic view of the forests, water cycles, and biodiversity that intersect Unilever’s supply chain—raising sustainable sourcing standards for suppliers and bringing Unilever closer to its goal of ending deforestation and regenerating nature.”

Google’s part in the partnership is to store and “make sense of large amounts of complex data” through its geospatial platform — Google Earth Engine, Google Cloud Storage, and BigQuery — combined with open source satellite imagery.

Smaller names with large impact

It isn’t only large companies that are tackling this problem. New startups and initiatives such as Satelligence and UP42 have popped up that empower smaller companies and even private citizens to tackle the global deforestation problem.

Satelligence

Satelligence also uses radar imagery coupled with optic images to get a “forest baseline” image in the tropics. It then uses this baseline image to overlay tree-cover loss data and determine areas of deforestation.

By combining Landsat, Sentinel-1, and Sentinel-2 data, using a Bayesian Iterative Updating method, the startup is able to automatically detect changes in forest areas in near real-time with over 95% accuracy.

The Bayesian Iterative Updating method was developed together with the University of Wageningen and uses Bayesian statistics to determine the probability of change.

Companies with large supply chains can sign up for their service to be alerted to potential deforestation areas (proactive) and also be reactively alerted when deforestation has occurred.

In 2020, a coalition of nine financial institutions representing $1.8 trillion in assets under management teamed up with Satelligence to tackle deforestation using satellite imagery.

UP42

Another startup providing solutions to deal with the problem of deforestation is UP42. The company offers an open marketplace to access high-resolution satellite data. UP42 then provides a deforestation algorithm to help you determine the level of deforestation in that AOI.

Through temporal analysis of satellite data, the deforestation algorithm provides two images — a bitmap image where white pixels show deforested areas and a deforestation heatmap image.
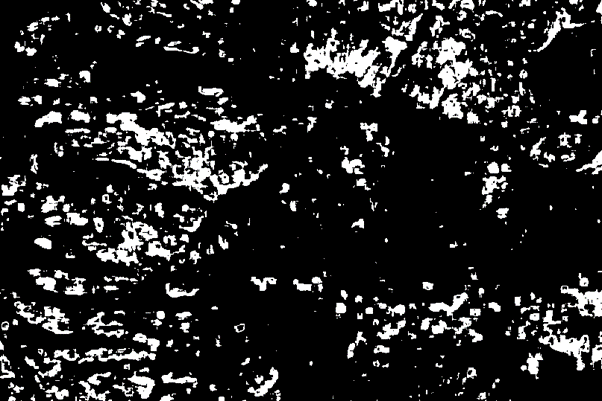
Deforestation algorithm - the result in the form of a raster

Image courtesy of UP42

Instructions on how to do this easily can be found on UP42’s deforestation algorithm case study page where they demonstrate the feature by checking for deforestation in Europe’s largest untouched woodland in Romania.

Conclusions

At current deforestation rates, all global rainforests will be gone within 100 years, reports The Guardian. Because so many of these rainforests are being destroyed where they cannot be monitored, satellite data is essential to tackling this urgent problem.

The rise of open data platforms, near-real-time data, sophisticated algorithms, and better satellites make this easier to achieve.

Say thanks for this article (9)
The community is supported by:
Become a sponsor
#Data source
#Copernicus #Environment #Geospatial analytics #Geospatial for Good #Ideas #Landsat #Optical #SAR
Introduction to Satellite Imagery and its Relevance to Disaster Management
Justyna Więcławska 09.14.2023
AWESOME 4
Next article
#Environmental Protection #Hyperspectral #Multispectral #Natural Resources #Optical #SAR #Satellite-Derived Bathymetry

How are Satellites Used to Observe the Ocean?

Editor’s note: This article was written as part of EO Hub – a journalistic collaboration between UP42 and Geoawesomeness. Created for policymakers, decision makers, geospatial experts and enthusiasts alike, EO Hub is a key resource for anyone trying to understand how Earth observation is transforming our world. Read more about EO Hub here


As humans, we really do tend to take the oceans for granted.  They cover 71% of the Earth’s surface and provide over half of all the oxygen that this planet produces.  And yet, for such an important resource, only about 20% of the sea bed has been mapped in detail thus far.  This points to an immense amount of potential for discovery – especially when we consider the wide-ranging implications that oceans have on climate, biodiversity, human flourishing, and more.

That’s why it’s incumbent on us to do a better job of monitoring, mapping, and tracking the oceans – across a wide variety of different factors.  Doing this well can help us keep on top of issues like climate change, environmental protection, protection of endangered species, and the health of seaside towns and cities.  This is challenging, of course, because of their scale and remoteness – but that’s where satellites are so useful.  Whether we are trying to measure depth (bathymetry), color, circulation, sea ice, sea surface height, temperature, or weather – satellites offer us a way of doing this precisely and accurately without having to actually be on the water ourselves.

A History of Ocean Observation from Space

Satellites have played a key role in oceanography for more than 40 years now dating back to the very first project called ‘The Coastal Zone Colour Scanner’ in 1978.  This project was the first time we had used a satellite for measuring the ocean’s color and it was the first proof of concept that such an audacious goal could be achieved.

It would take until 1997 for the next project to be launched – this time the Sea-Viewing Wide Field-of-View Sensor (SeaWiFS) that truly kickstarted the industry in the modern era.  From there, the world of oceanography leveraged the huge jump in active satellites and began to discover more and more use cases for monitoring and protecting ocean ecosystems.  Over time, the spatial, spectral, and temporal resolution of the satellite data improved, allowing us to do more and more with the data we were collecting.

Fast forward to today and satellites play an invaluable role in this endeavor and continue to grow in importance as the technology accelerates.

Key Applications for Ocean Satellites

For a sense of how useful and wide-ranging these satellites can be, let’s explore some of the key applications that are currently being utilized by clients around the world:

Bathymetry

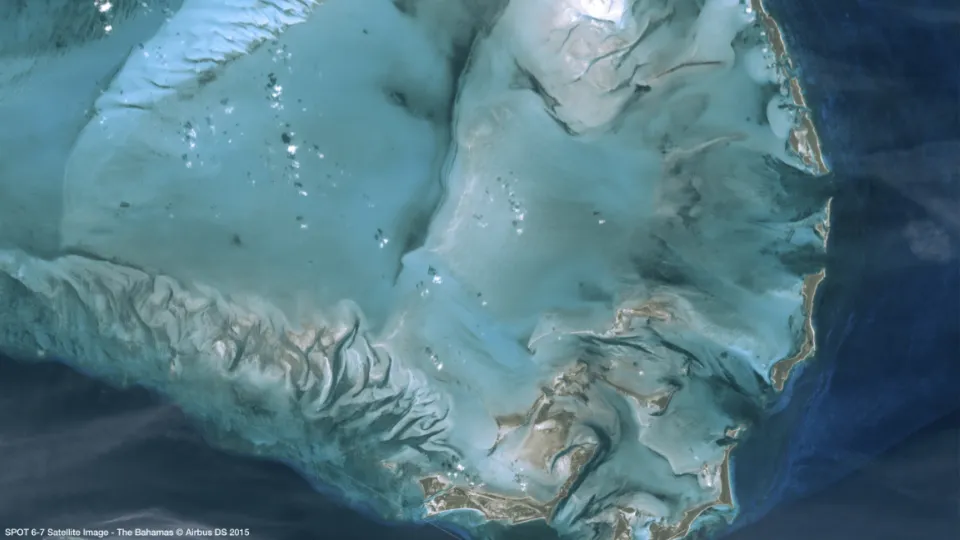
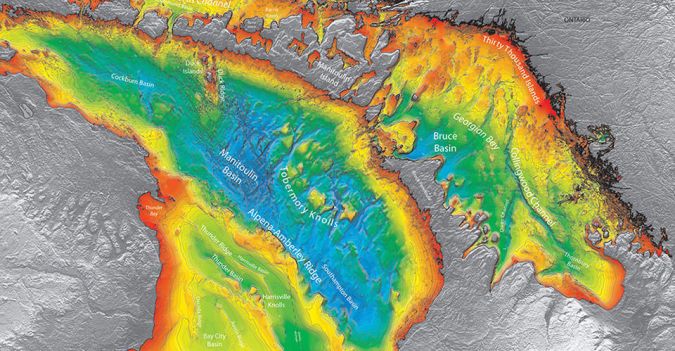
Measuring ocean depth is a key factor in understanding how climate is affecting our ocean levels and the ecosystems that inhabit them.  Satellite radar altimeters enabled the creation of the first global sea floor depth models.  These were modeled indirectly by measuring the  inversion from gravity.  The underwater topography such as sea mountains adds extra pull to Earth’s gravitational field, drawing more water around them and bulging the sea surface outward.  This is very useful for generic mapping and is used extensively in applications such as Google Earth and others.  Then, on the coast, satellite-derived bathymetry which is based on optical satellite data provides a lot of value.  By studying the color profile and spectral signatures of near-shore areas augmented by satellite data, we can arrive at incredibly accurate estimations even at a depth of 30m.  The higher the resolution of the data the better here, but even at low resolution there is value to be found.  Satellite-derived bathymetry is particularly important for the safety of navigation, hydrodynamic modeling, and coastal environmental monitoring and protection amongst other applications.

Mappping ocean floor

Sea Level Rise

This data is valuable as we assess the impacts of climate change.  Rising sea levels are not just dangerous for luxury beachfront property but also for thousands of low-lying cities, towns, and villages around the world that are situated near the shores.  In addition, unchecked sea level changes risk damaging wetlands, mangroves, and other important ecosystems that we should be striving to protect.  NASA and ESA use radar satellites for these altimetry measurements and the outputs can be combined with data from coastal tide gauges and Argo floats – a global network of mobile ocean sensors that move up and down the water column.  The combination of these gives us a holistic picture of sea levels that can then inform decision-making.

Measuring Sea Surface Temperatures. 

Sea surface temperatures are crucial barometers for a range of different factors such as fish behavior, coral bleaching, weather, tracking predators, and so on.  Temperature is also often the first sign of large changes in currents which can have compounding effects on everything else that we care about.  The most common instrument used in the field is the Visible Infrared Imaging Radiometer Suite (VIIRS) which is aboard the NOAA/NASA Suomi NPP Satellite.  This sensor captures temperature data on a daily basis, allowing scientists to craft maps that show how sea temperatures change over time across every region of the world.

Ocean monitoring - satellite imagery

source: NASA

Measuring Sea Surface Color

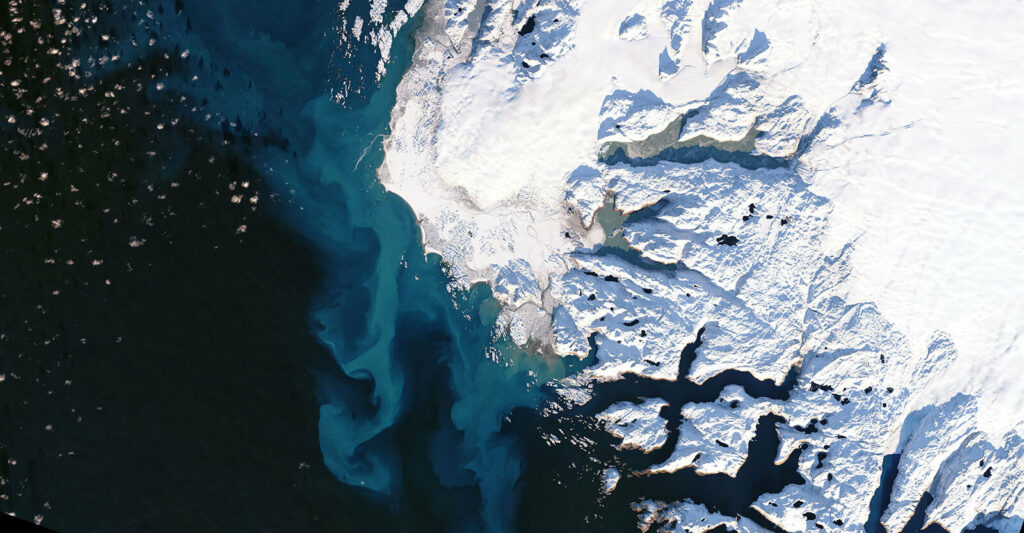
Color is another valuable data type that satellites can collect for us – helping to identify algae growth, flood patterns, river plumes, and more.  Having this information allows us to take proactive action such as dealing with harmful algae growth that may be contaminating shellfish and killing other sea creatures.  Once again, the value is really in monitoring the subtle gradations in color over time, something that can only be accomplished through regular satellite information – and giving us the chance to see changes early so we can respond accordingly.

Weather Monitoring 

Speaking of climate change, it’s also really important that we accurately measure and monitor the weather conditions that are continually unfolding across the globe.  The ocean is one of the largest regulators of weather patterns and so it’s an inextricable component of large-scale weather monitoring.  Satellites do a great job of measuring and reporting on this weather so that users of all kinds can pull timely and accurate weather data from a platform like UP42.  This simply wouldn’t be possible otherwise and it’s a great reminder of how interlinked satellites are with our normal lives, even if we don’t realize it.

Regulatory Compliance

The climate data and sea level information gathered from satellites are key inputs for various regulatory bodies that seek to manage maritime navigation, coastal protection, coastal management, and other environmental risk reporting.  As more rigor and scrutiny is required, satellite data offers an objective source of truth that can be the foundation of various practical risk mitigation strategies on a micro and a macro level.

Conclusions

These are just a few of the practical applications of satellites when it comes to oceanic observation, but it certainly isn’t an exhaustive list.  This technology continues to transform how we see our oceans and it plays a significant role in how we manage the future of our planet.

As satellite technology improves, we’ll see more and more of this data coming into the public sphere – to inform our decisions and to bring more awareness to the issues that we face across our oceans.  This is a conversation that desperately needs more mainstream attention, especially considering the downstream (pardon the pun) effects that play themselves out across the rest of society.

Understanding our oceans is a non-negotiable if we want to manage their power, conserve their resources, and deliver our earth to the next generation in a condition that is, at the very least, the same as we found it.

Did you like the article? Subscribe to our monthly newsletter:

Read on
Search