Introduction:
Mobile LiDAR technology is found to be the most effective solution for the maintenance of public transportation. Identifying and repairing the potholes is one of the important aspects of maintenance of highways.
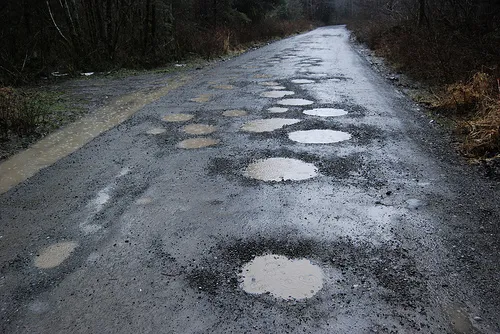
The disruptions on the road surface are formed by the wheel load on the crocodile cracking which are formed due to the fatigue of the road surface. Once a pothole is formed, it expands continuously due to chunks of broken tar/cement. Once the pothole gets full of rain water, its size increases rapidly. A quick repair helps avoid further damage which, in turn, helps avoid road accidents.
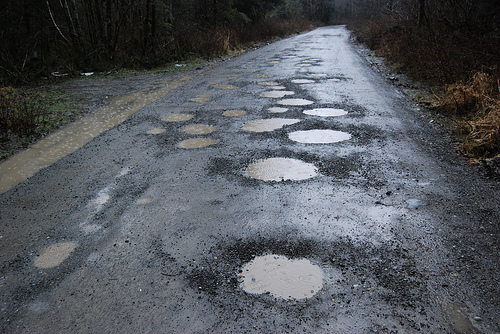
(Picture shows a series of potholes formed on the road and are filled by rain water.)
Mobile LiDAR:
Currently the interesting subject in the LiDAR industry is mobile mapping: dynamic terrestrial lidar, often combined with simultaneous oblique, stereo image capture. Collection of very high resolution, high accuracy street-level views of urban infrastructure is facilitated by GPS/IMU on a moving vehicle, capturing vast quantities of GIS-compatible lidar point cloud data in a relatively short amount of time. A mobile lidar system is able to see between buildings and under tree canopy in ways that airborne lidar, regardless of point density, will never be able to. Mobile mapping systems generally collect a full 360-degree field of view at a speed of 15-20 miles per hour. This highly precise data can be used to create realistic streetscapes and highly accurate road maps for vehicle navigation.
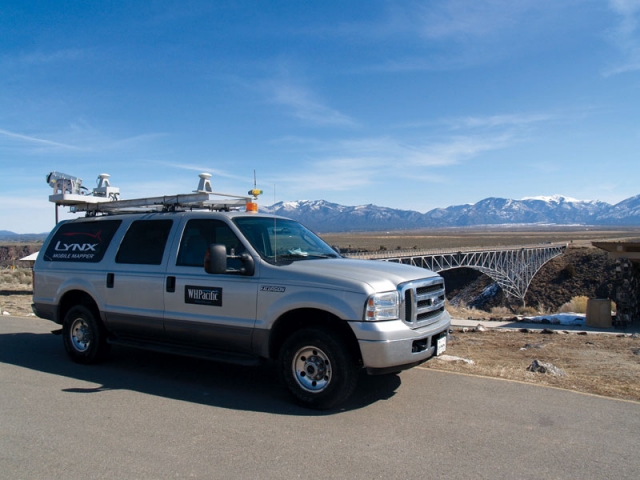
(The picture shows terrestrial LiDAR equipment mounted on a vehicle which is scanning along the road corridor)
GIS Compatible LiDAR Point Cloud Data:
The popular LiDAR point cloud data file is .las (LASer) file format. Other than .las, .bin, .ascii, .pt,s etc are commonly known file format. The above mentioned files can be converted to a specific file (say .las) using different licensed and free software. Some of the open source modules of “Lastools” are the most impressive to play with the LiDAR files.
Automatic Classification of Ground:
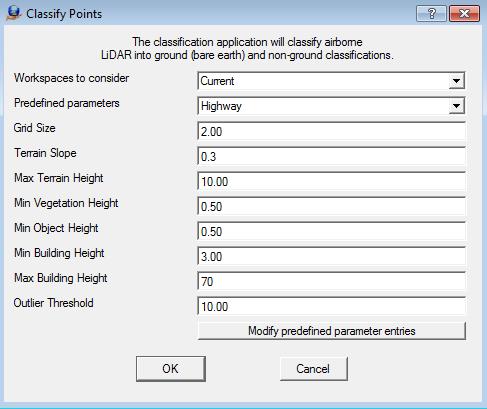
The different LiDAR software have the capability to classify the bare earth automatically. Depending on the parameters such as; Grid Size, Terrain Shape\angle, Terrain height (Max\Min), Object height (Min\Max) and Building height (Max\Min), the software filters the terrain points and classifies them to a separate class.
Manual Classification:
The bare earth which is automatically classified is not perfect and still needs manual classification. In the process of manual classification, high and low points are removed. The patches of unclassified ground are classified. The miscellaneous objects on road are checked.
Detection of Potholes and Crocodile Cracks:
- A crocodile crack leads to a pothole and it differs from a pothole in shape. They are usually elongated in shape as compared to the potholes. As compared to the cracks, the potholes are deeper and circular in shape and often contain water.
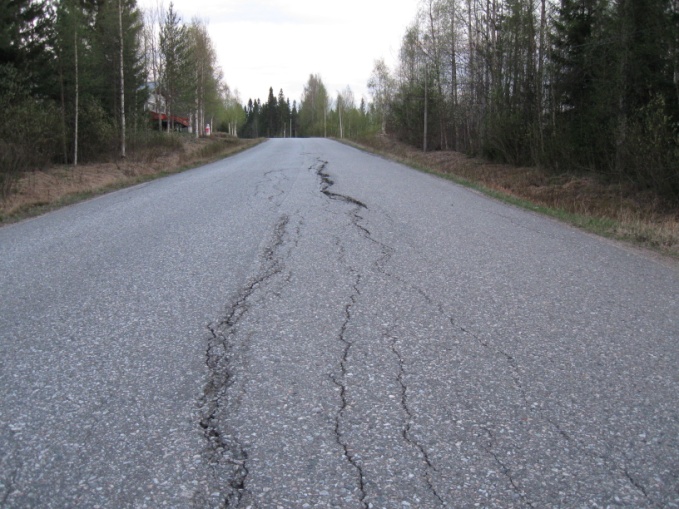
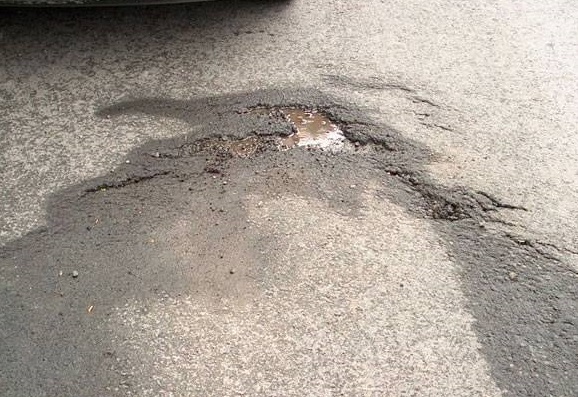
(The upper image shows crocodile cracks and this leads to pothole which can be seen in the lower image)
- A surface model generated on the road pavement that clearly shows an anomaly. An anomaly containing water has lesser point density generate longer TINs.
- Traditional process of manual inspection of potholes and cracks is to take a cross section and view it as a side view where the concave shape is detected. A depression containing water may reflect minimum points and a pocket can be formed. The usual process is to classify “Bellow Line”.
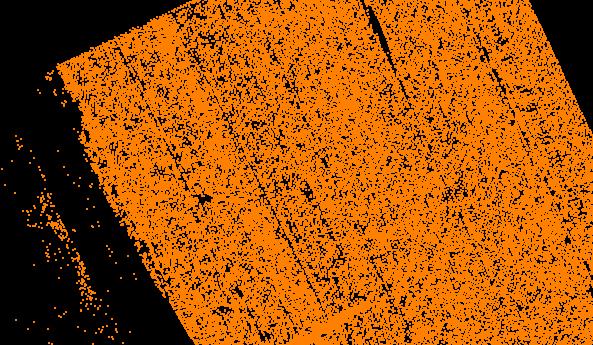
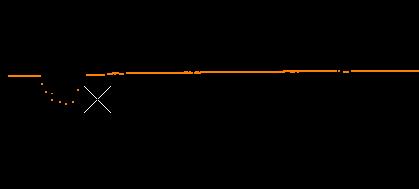
(Upper image shows the aerial 2D view of the point cloud where the depression is not easy to identify. In the lower image, the cross section in the side view can be well realized)
For the rain water to be drained to the gutter, the central portion of every paved road is slightly raised. This way the contours acquire a specific shape. The contours are usually crowned at the road center line. With the availability of the potholes and crocodile cracks, the crowning shape is distorted. These deformations alert the user to a possibility of anomalies.
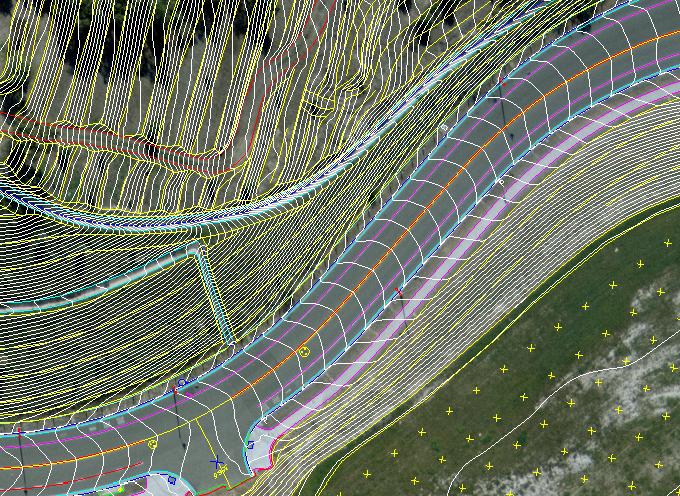
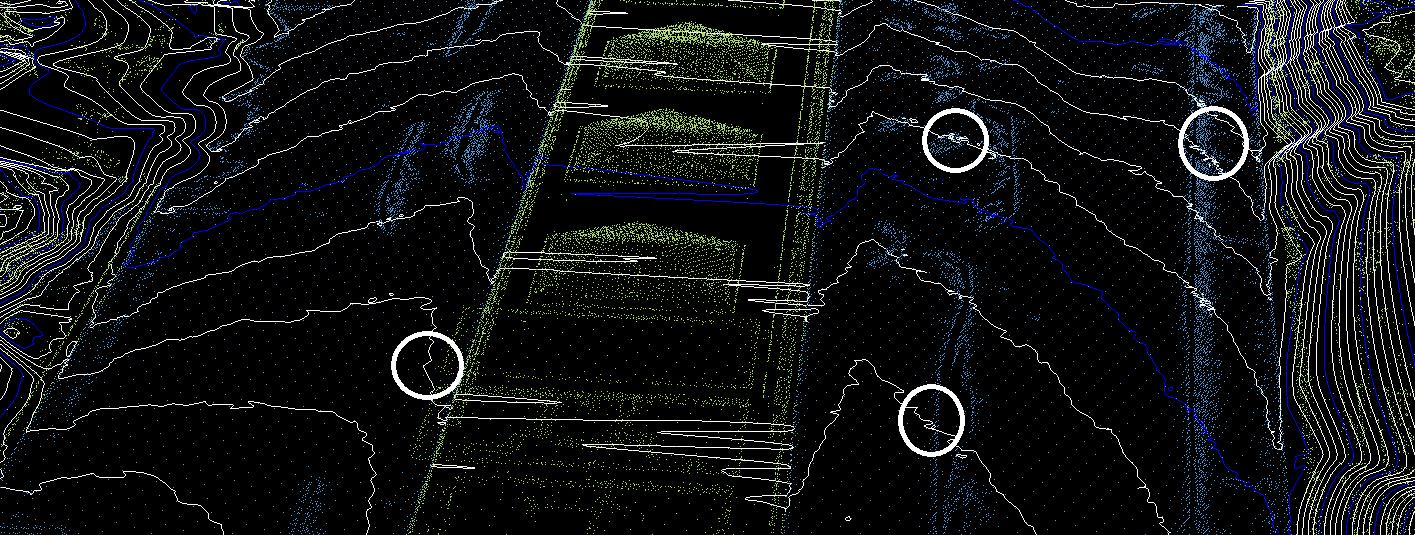
(Left image shows how perfectly the shape of the contours are generated on an aerial photo. The right photo shows the distortion of the contours generated on the model-keypoints. The possible anomalies are marked which need manual inspection.)
Advanced classification in 3D:
- The recent invention of LiDAgrammetry aids the facility of stereo vision where a user can see the data in 3D. The identification of the actual anomaly is possible with NO guess work. With the additional CAD tools available, the anomalies are not just classified but their outer edges can also be compiled. The process is not just accurate but also faster and easier. The deliverable is not just the classified anomalies but also the polygons that express the area of damage.
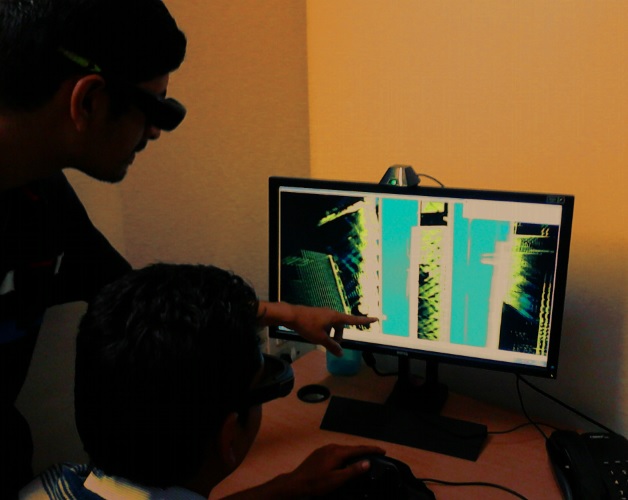
(A LiDAR\Photogrammetry technician classifying the anomalies on highway pavement)
- The aid of 360° rotation and roaming in stereo environment provides a wonderful facility to the user where the data can be viewed from all angles including from the bottom.

(The 3D viewing facility does not require any cross section. The tile can be rotated in 360 degree)
- Any high or low point that is classified into ground class is to be removed. The advanced 3D facility provides a unique way of cutting the road in to a slice with the facility of roam forward; the high and low points can be well identified. Using either a cube or a customized structure these points are removed without disturbing the actual ground points.
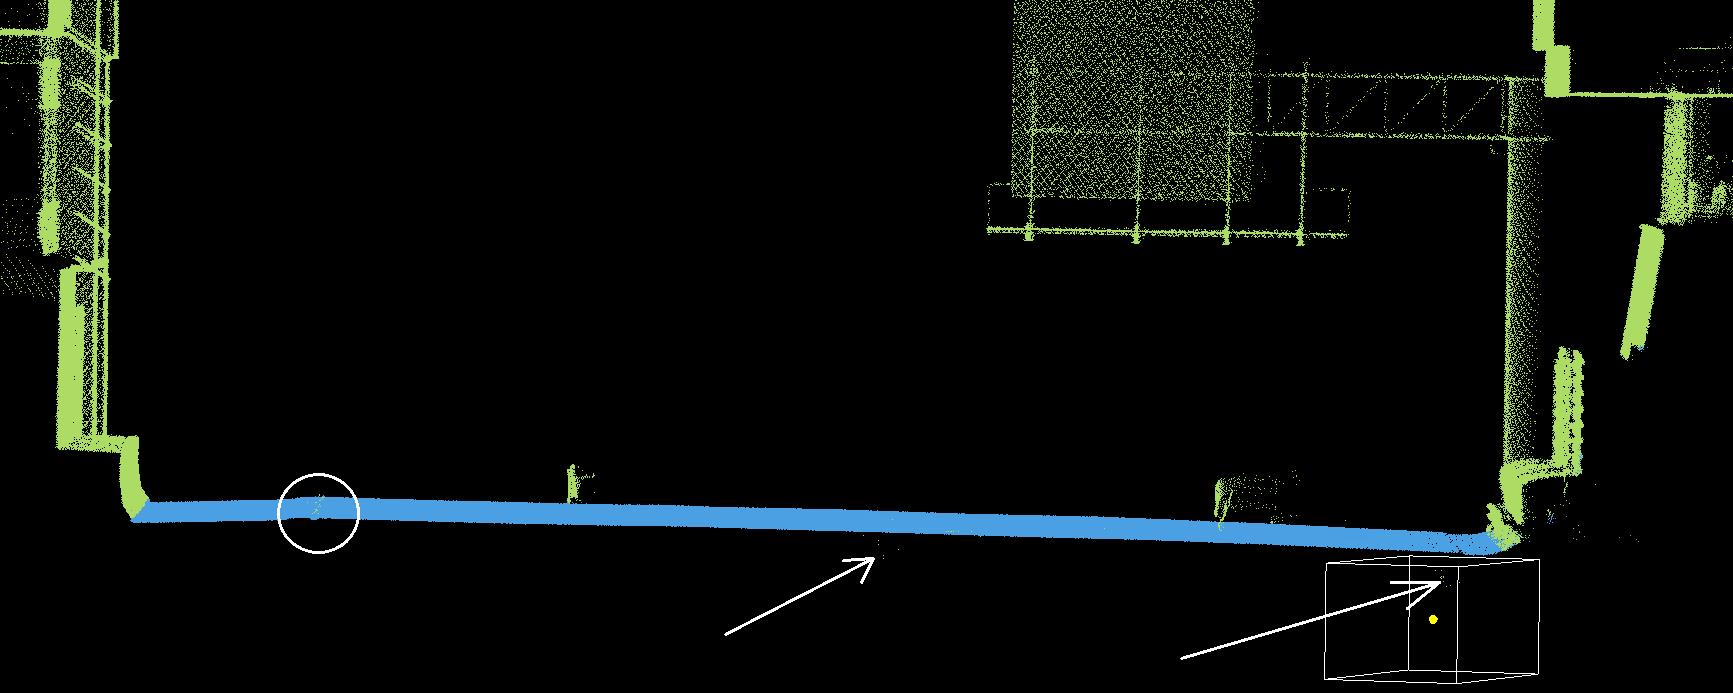
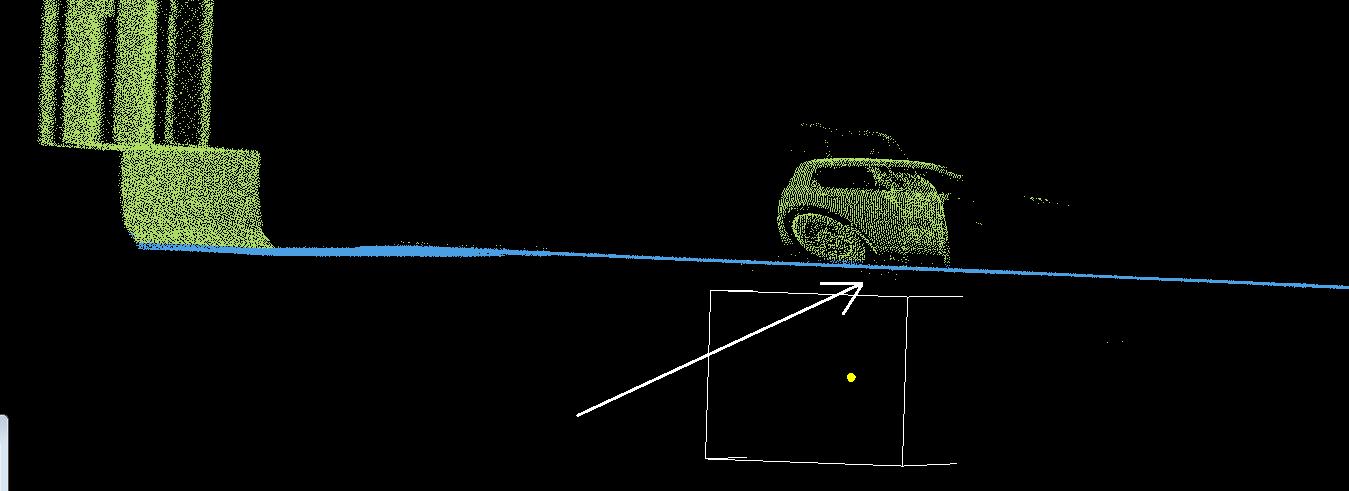
(In the above picture it shows a terrestrial slice(Front view slice). It is just a specified distance which is displayed as a slice around the location of the floating mark. The remaining near and far view remains invisible. With this facility, it is easy to identify the high\low points and classify them.)
- Temporary miscellaneous features on road such as vehicles, pet animals, human etc. are carefully inspected if any of the points are wrong and in ground class. The facility of 360° rotation helps the user confirm the accurate classification or correction.
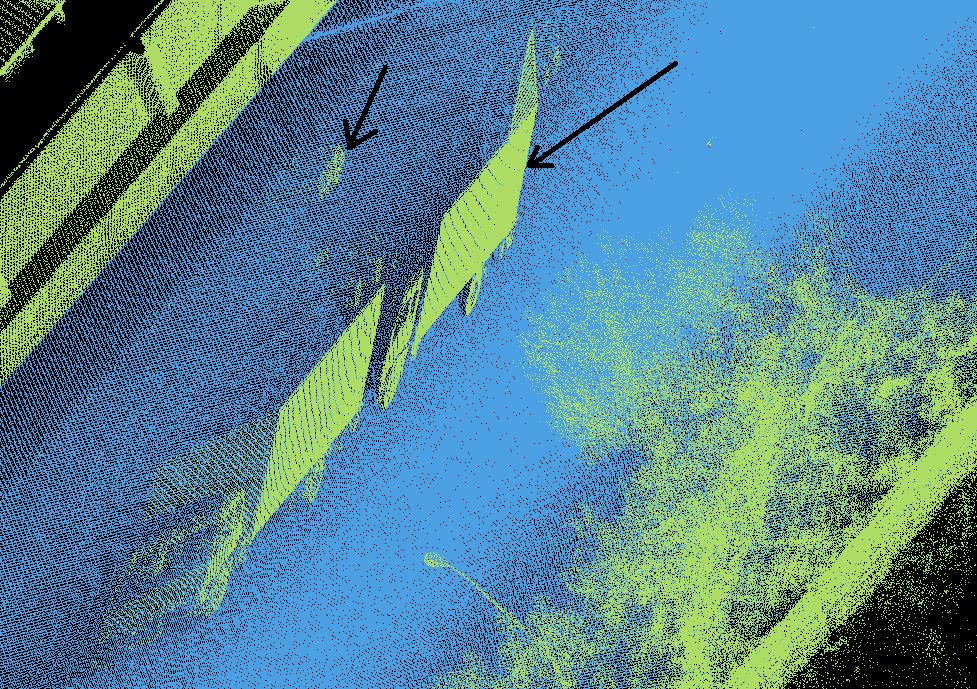
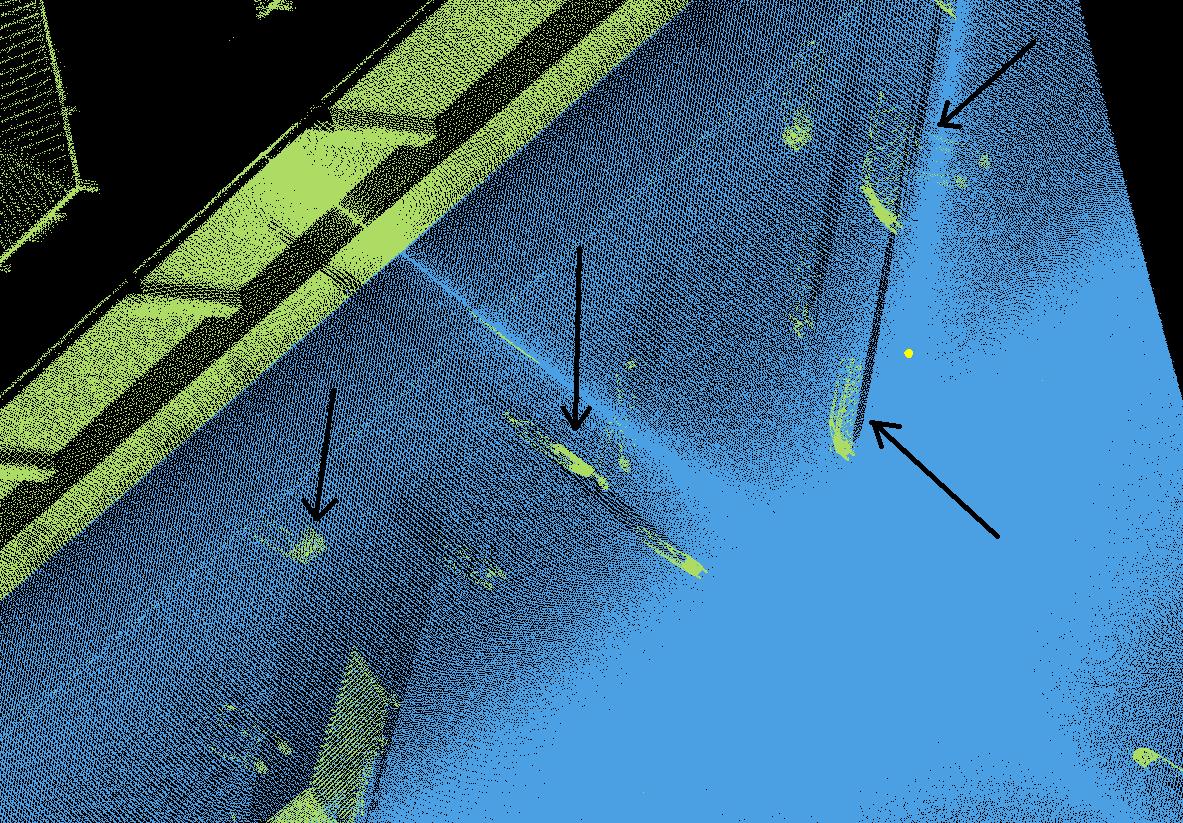
(A close inspection of the vehicles and other temporary miscellaneous objects)
Any pothole with a concave shape is immediately realized in stereo vision. Upon seeing the pothole from the bottom by rotating view, the basin shape is further confirmed. The edge of the depression is carefully digitized and that is customized to a 3D structure to clip the data inside to an assigned class.
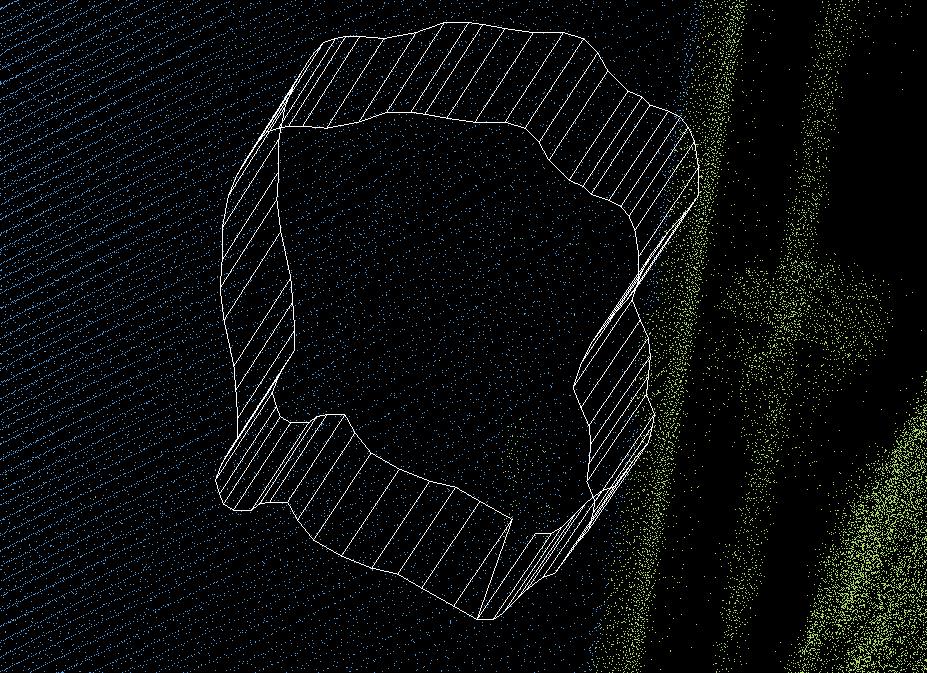
(It is very easy to detect the eroded pavement in stereo vision. Using the 3D cad tools, the edge can be plotted)
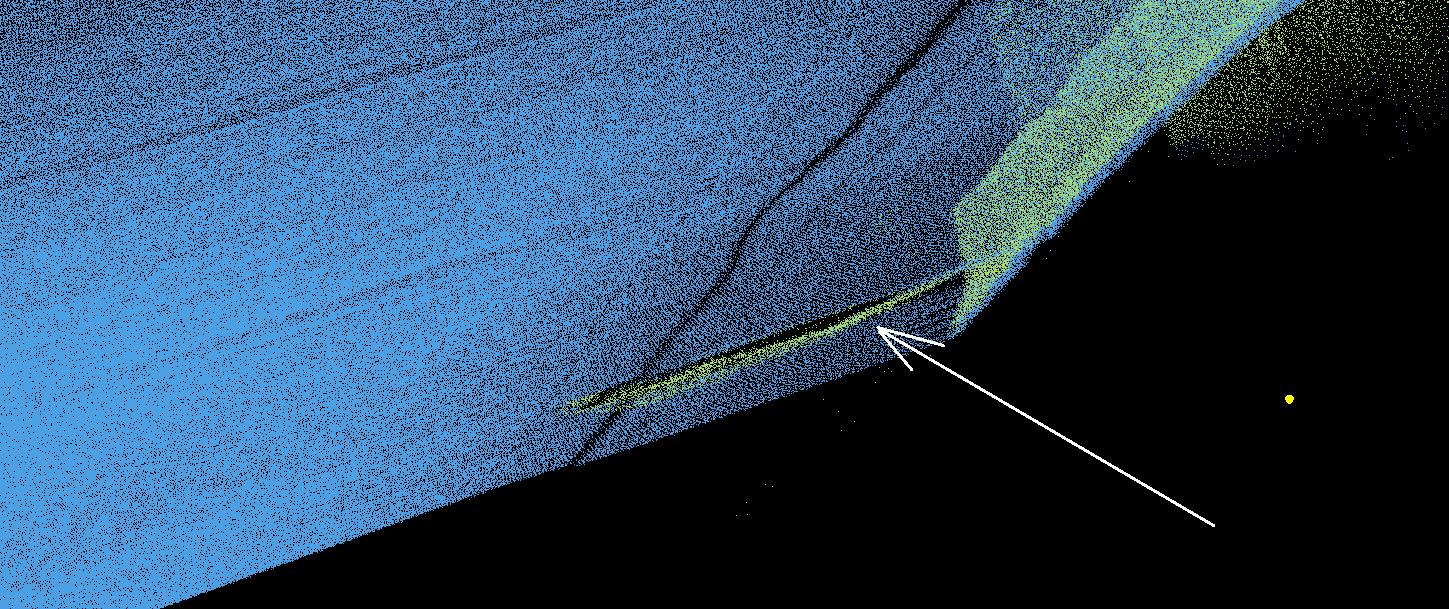
(Once the data is clipped, it is automatically classified to an assigned class. The anomaly can finally be confirmed by viewing the basin shape by rotating the aerial view 180 degree.)
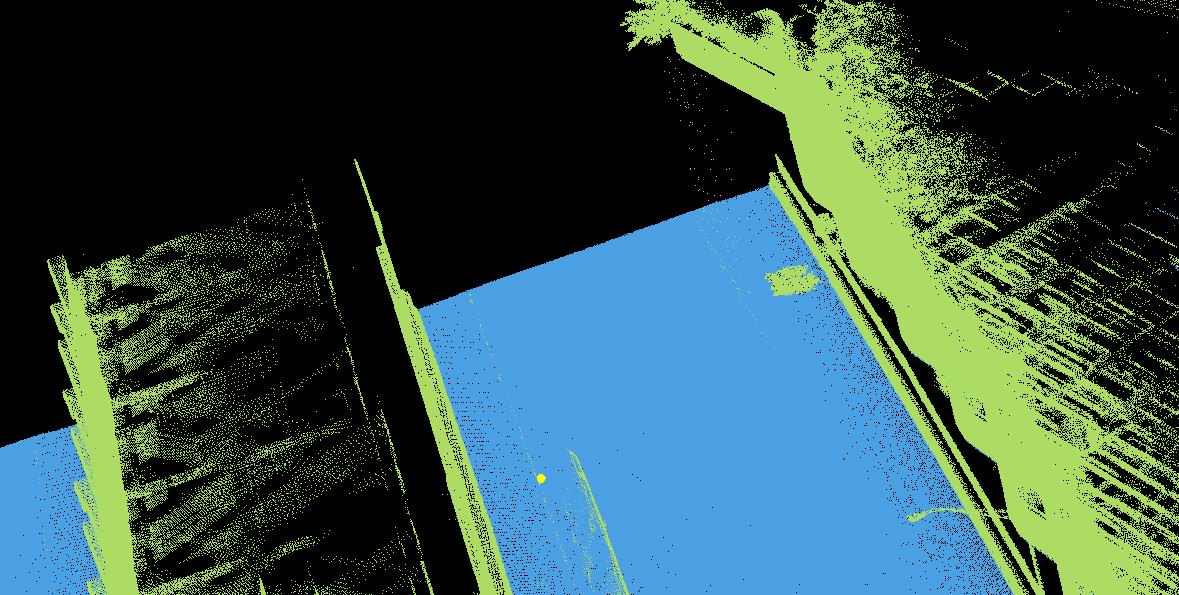
(Above picture shows a classified anomaly)
Deliverables:
As compared to the traditional deliverable, the advanced procedure helps in delivering 3 products and they are:
1) Classified Anomalies
These are just the points in a separate class from the default and ground points.
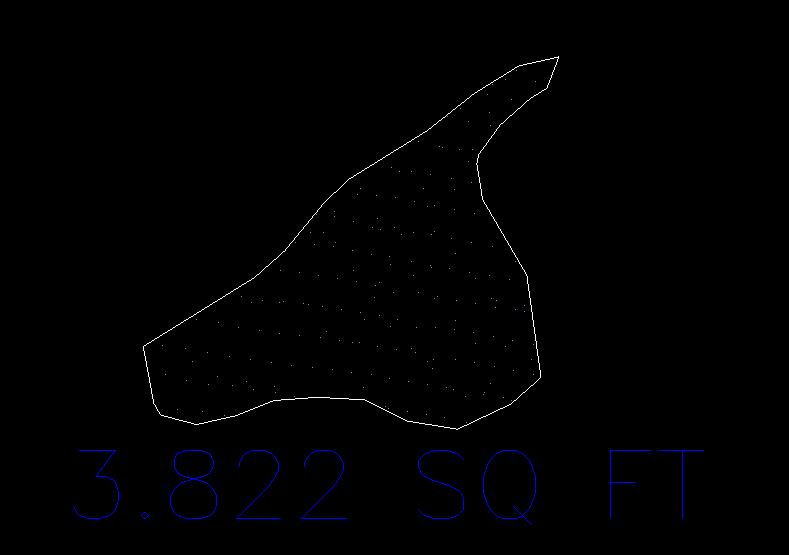
2) Line Work
The edges of the pothole or crack are drafted using the CAD line tool. In the form of polygons, they can provide information about the area of the anomaly.
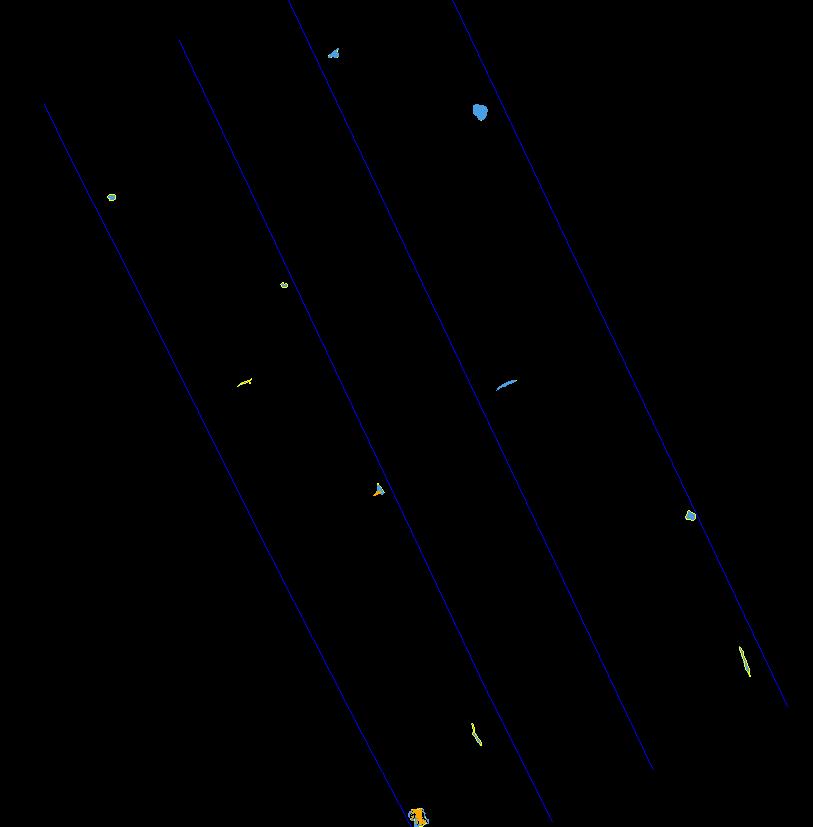
(Polygons that define the edge of the anomalies)
3) Depth Information
With the help of a specific tool, the lowest point inside the polygon is detected there by calculating the maximum depth of the pothole.

(The area and depth of a pothole is calculated)
For more information or suggestions, please contact,
|
Srikant Panda
Manager(Photogrammetry & LiDAR)
Geo Resource Mapping
srikant@geomapres.com
srikant.geod@gmail.com
www.geomapres.com
Flat # 2, ShreeShailya Apartments,
Prabhat Road, Lane 14 (Income tax Lane)
Erandawane,Pune: 411004
Skype :srikant.geod
Tel: 25431673/83
Cell: +91 9370740737
|
Did you like this article on mobile LiDAR? Read more and subscribe to our monthly newsletter!
