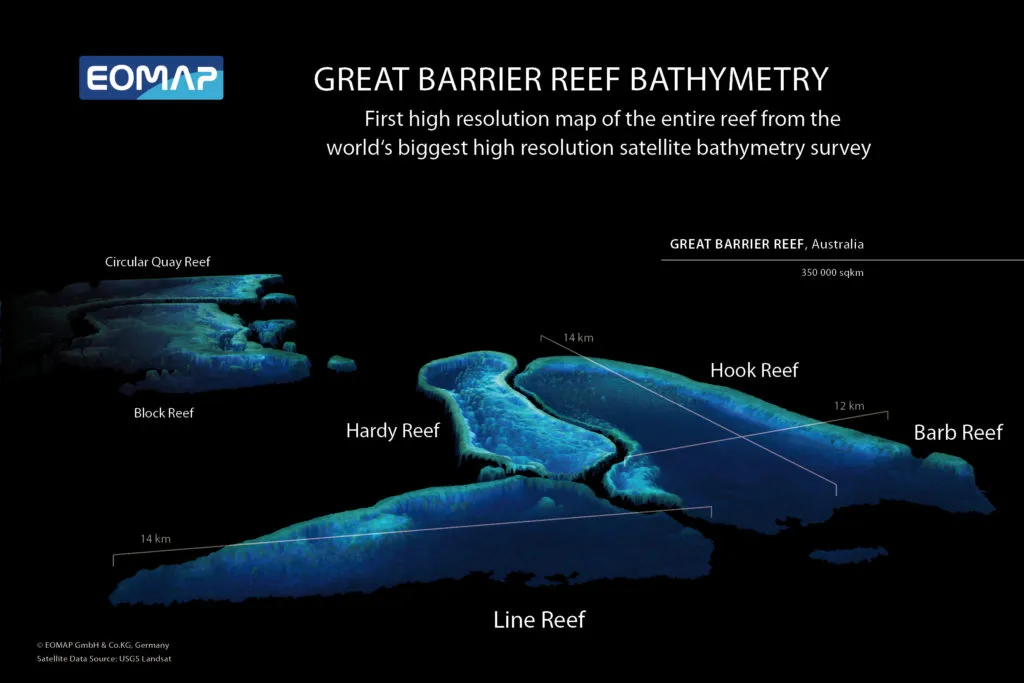
First 3D topography of Great Barrier Reef derived from EO data
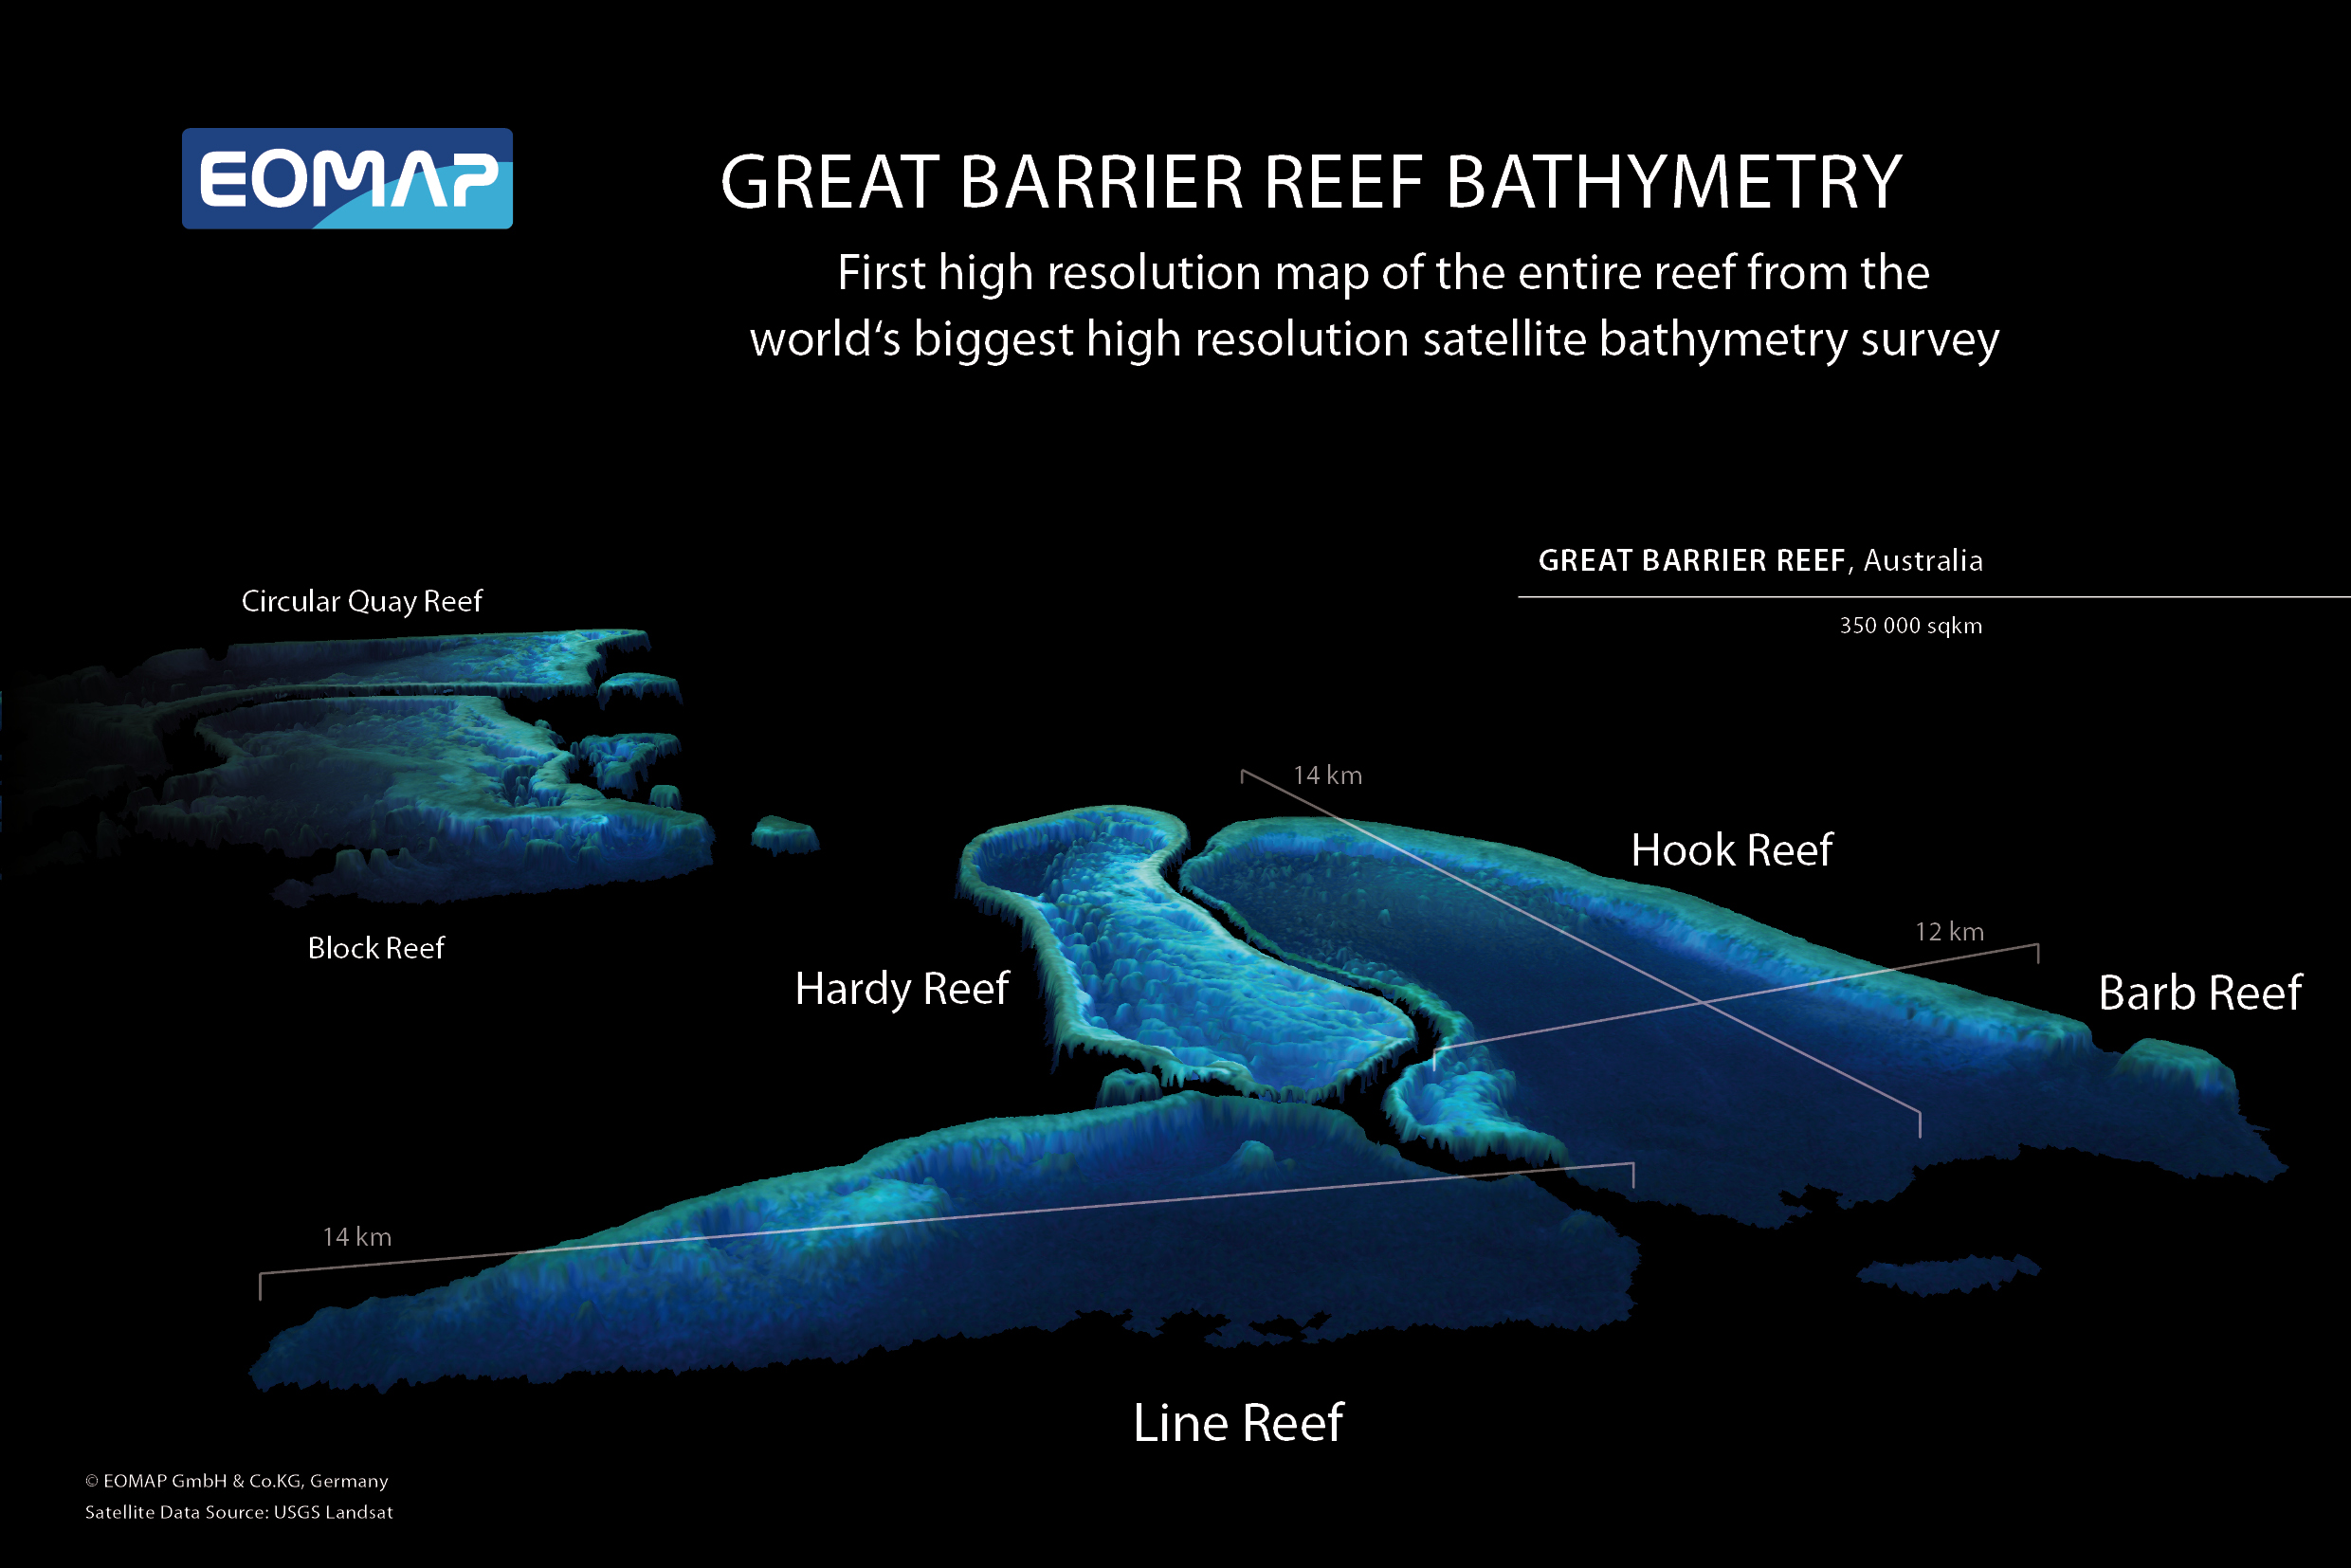
3D topography, the first high resolution bathymetry of the Great Barrier Reef reveals a complete overview of the entire ecosystem and at the same time the subaqueous topography of the single reefs at a horizontal resolution of 30m. Source: EOMAP
I was recently invited to a Germany-based company that is specialized in aquatic remote sensing and just announced the finalisation of a large scale ocean mapping project, unique of its kind. I am talking about the launch of a set of high resolution maps showing the sub aqueous 3D topography of the entire Great Barrier Reef. The collection constitutes the first digital dataset of the world’s vastest coral reef using satellite derived depth (bathymetry). Bathymetry refers to the remotely mapping of water depth using satellite information and is practicable down to a certain water depth, mostly shallow waters of 10 – 12m depending on the clearness of the ocean.
Till day the ecologically sls is costly and also navigationally dangerous due to the shallow nature of the reef lagoons. In order to overcome such problems EOMAP Company decided to use satellite imagery and developed algorithms to retrieve water depth. In November this yearignificant coral banks of Great Barrier Reef have been surveyed on a digital basis to only less than a half of their extent. Mapping water depth by means of vesse the mapping of the Barrier Reef World Heritage covering an area of around 350.000km² at a spatial resolution of 30m was finalised. The default product relies on LANDSAT 7 satellite data, higher resolution maps applying WorldView2 satellite data with a 2m horizontal resolution can be delivered on request and a downscaled version of 500m (MODIS) is available for free. The vertical bathymetry accuracy is 10cm up to a depth of 12m when accuracy begins to diminish greatly. The dataset provides both a detailed view on the single reefs but also a complete perception of the entire coral ecosystem, according to the Australian project partners at James Cook University the largest mission of its kind in Australia.
Besides exploring water depth and sea floor EOMAP also keeps know how in assessing water quality parameters such as turbidity, total suspended matter, content of chlorophyll and yellow substances (suspended organic matter). The idea of Dr. Heege, CEO of EOMAP, is to regularly create and offer an updated version of the respective products for Europe. Other regions are scanned on request. The maps will be highly beneficial for monitoring water quality and estimate its responses to man-made and natural impacts such as cyclones, climate change, sea level rise and sediment transportation.
What’s the difference to land surface classification?
Earth observation satellites measure the characteristics of light or radiance coming from an object of interest. All influences in between the earth’s surface and the satellite affect the energy that is recorded by the sensor requiring radiometric corrections. While land classification based on satellite imagery involves the correction of atmospheric influences, water depth assessment additionally implies the correction of sun effects on the water’s surface (sun glitter, angle, adjacency along the coasts) and the consideration of the water column itself (phytoplankton, sediments, suspended matter). For a final interpretation the applied algorithms distinguish between four types of seabed that entail a different colour (sand, rock/debris, vegetation and mixed seafloor (mainly vegetation). After that, the calculated radiance of the pure water column can be referred to a certain water depth.
Usefulness and purpose
Particularly the introduction of the coastal blue band beginning at 400nm has made satellite derived bathymetry (SDB) a robust technology since some water properties are discriminable within this spectral range. SDB allows to rapidly surveying remote, extensive or inaccessible areas at 5 – 10 times reduced costs compared to the traditional shipping methods. Particularly in shallow areas that are typical for all coral reefs the accessibility for vessels is challenging or even dangerous. The bathymetry and water quality maps as presented by EOMAP are very useful for obtaining an overview of a desired area and for deciding where more accurate data, for instance in-situ data is required. This information is essential for environmental monitoring, coastal engineering or reef management. The planned automatisation of the calculation process allows a repetition at a certain time interval producing a time series that is going to enable long-term observations. However, due to the limited accuracy the mentioned maps are not recommended for applications requiring nautical grade precision.
The algorithms to retrieve water depth and quality are also applicable to sweet water bodies as lakes or rivers. In this regard, a huge advantage lies in the standardized method of multi-sensor monitoring that produces a reliable, repeatable and harmonized product for a potentially large area. If we think of Germany for instance, every federal region uses different methods to measure and monitor water quality. Thus, the results are not consistent among themselves. On a national (large scale) level, a standardized product therefore represents the huge advantage of comparability.
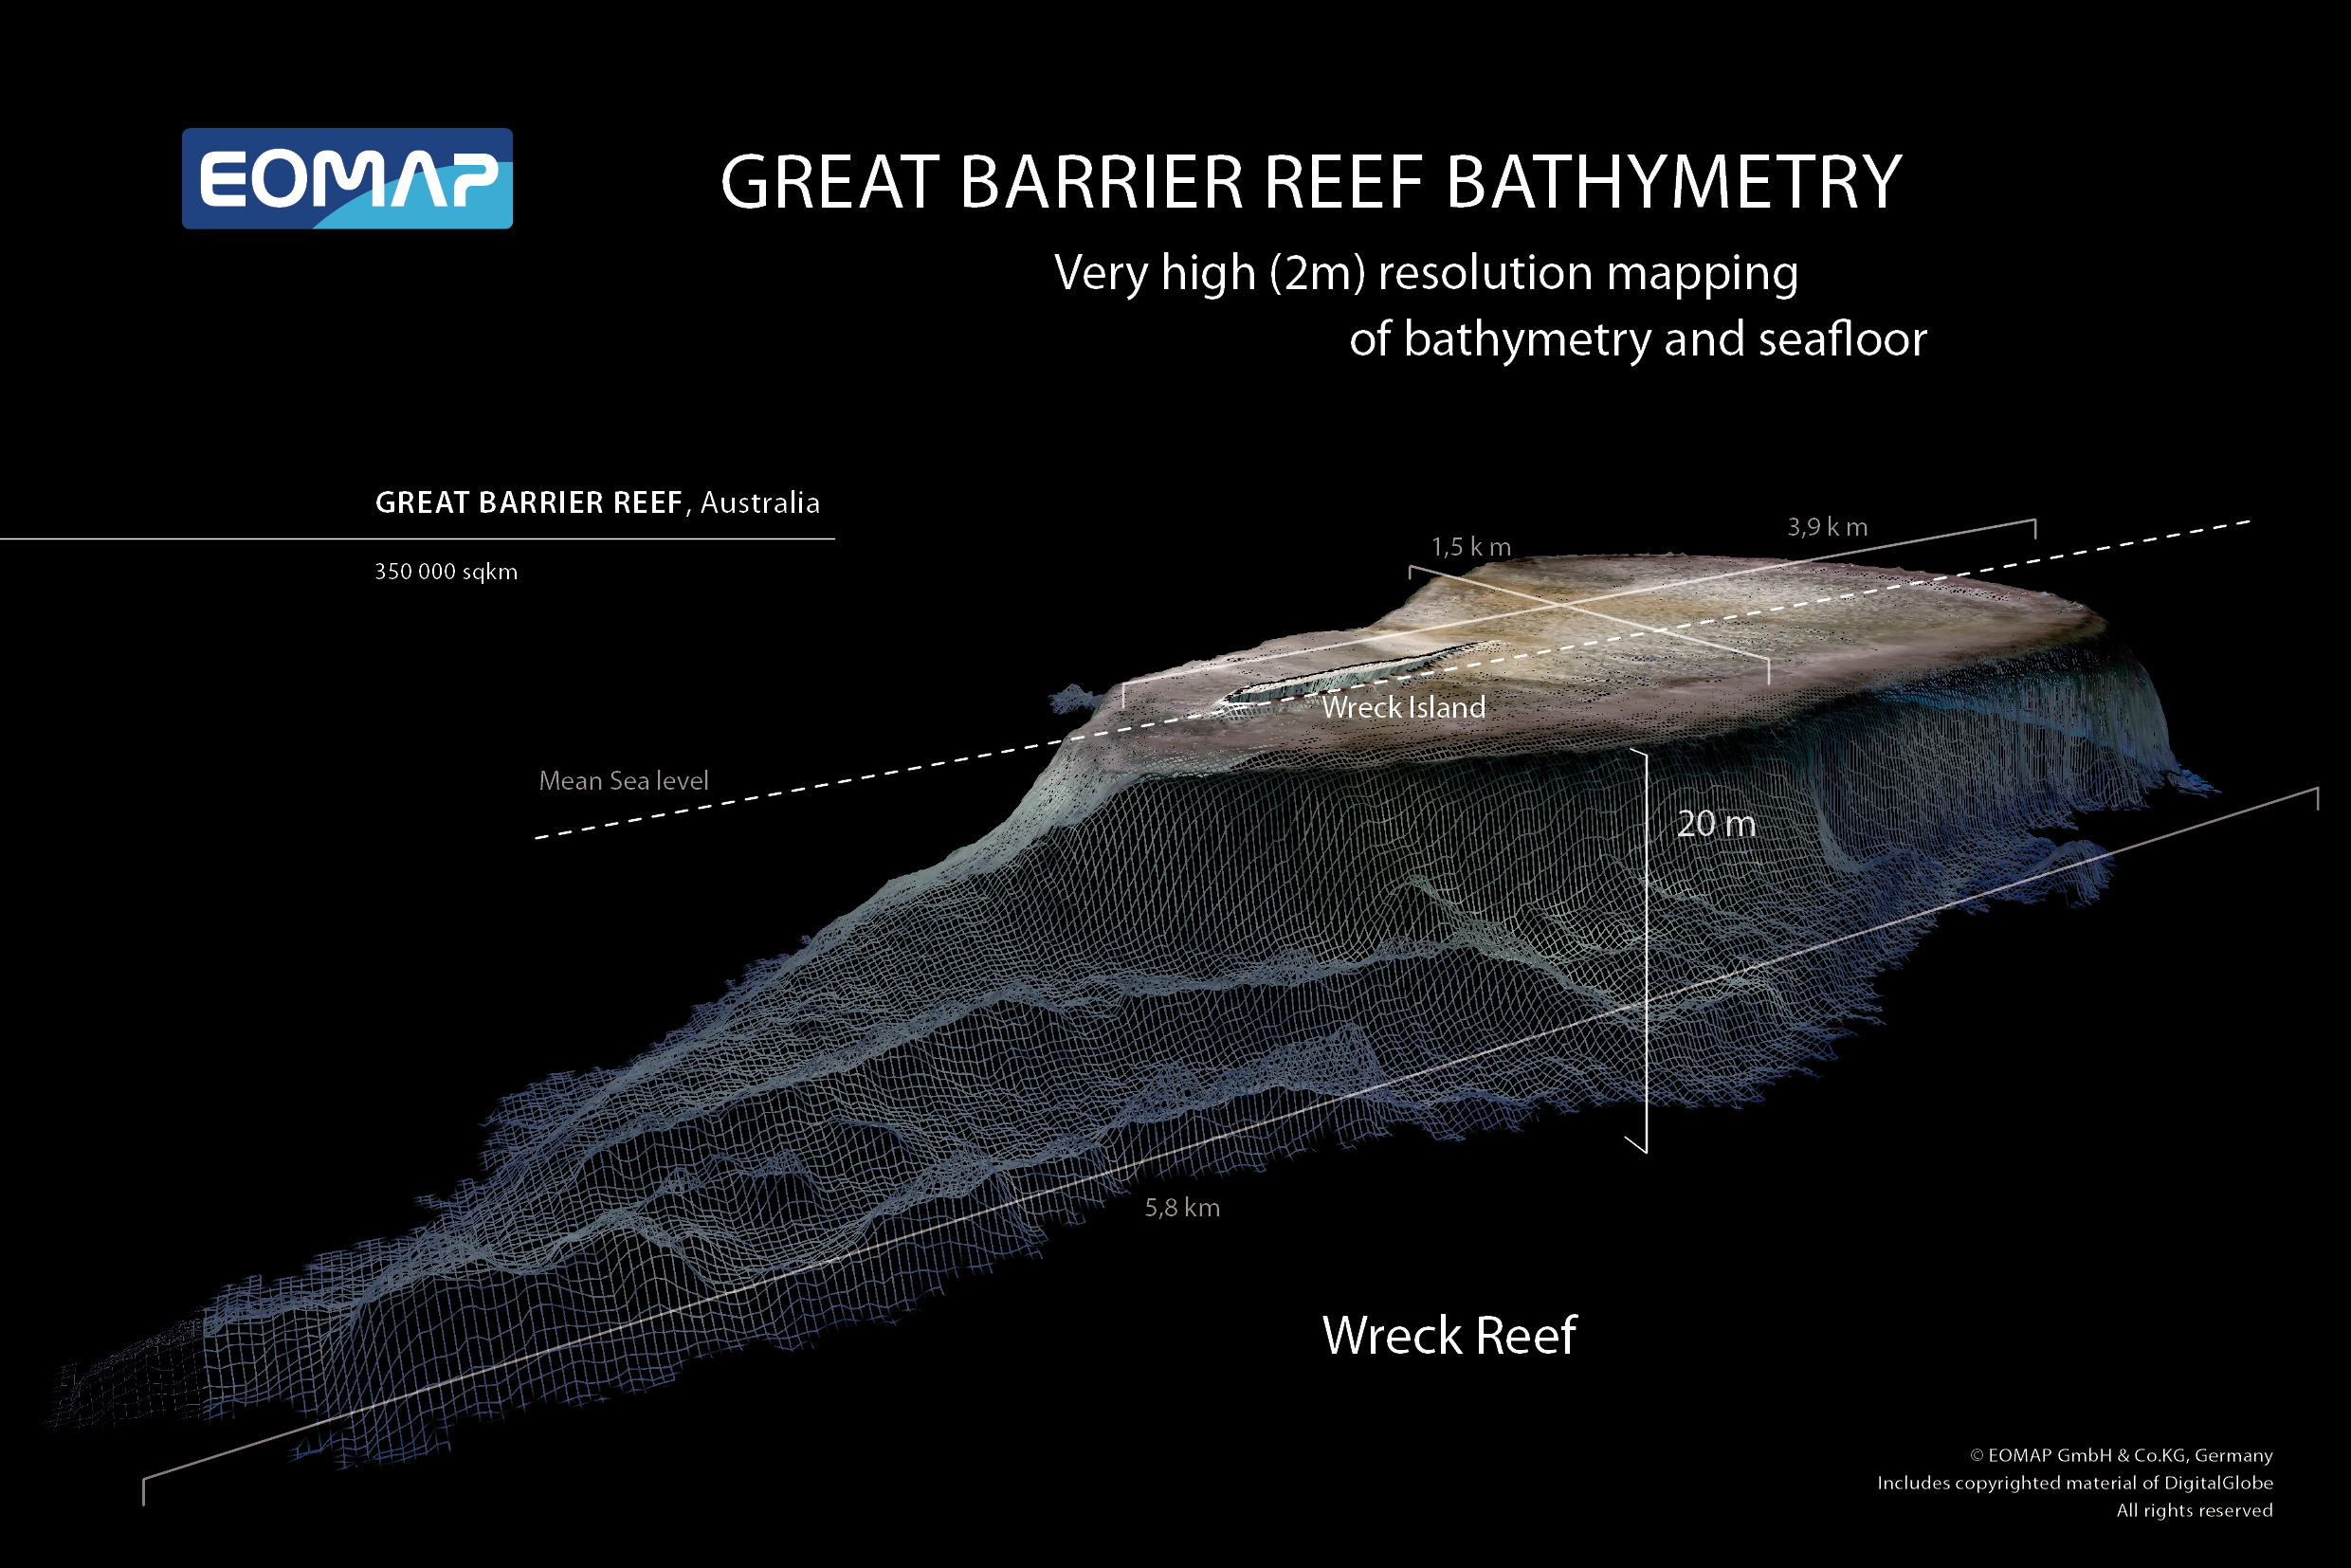
Very high resolution bathymetry maps from the Great Barrier Reef as well as other location in the world are produced on demand. Source: EOMAP
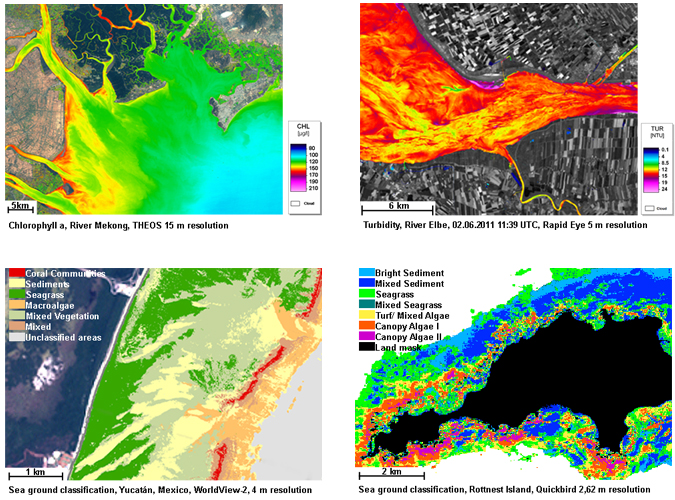
Water quality maps demonstrating the chlorophyll content (upper left panel), turbidity (upper right) and two different sea bed classifications in the bottom row from different waters (sweet water and ocean). Source: EOMAP
With the idea of “Operational Satellite-Derived Bathymetry Service – Rapid, spatial, validated” EOMAP was awarded the Copernicus Master for cloud computing challenge in November 2013.
Source: EOMAP
Did you like this article on 3D topography? Read more and subscribe to our monthly newsletter!


