5 Ways to Use Pansharpening on Satellite Imagery

Editor’s note: This article was written as part of EO Hub – a journalistic collaboration between UP42 and Geoawesome. Created for policymakers, decision-makers, geospatial experts and enthusiasts alike, EO Hub is a key resource for anyone trying to understand how Earth observation is transforming our world. Read more about EO Hub here.
The topic of pansharpening has been covered far and wide. Lots has been said about it, so in this article, we’re going to let the images speak for themselves. But first, here’s a whistlestop tour of pansharpening: what it is, its origins, how it works, and five ways to use it.
What is Pansharpening?
Both well-loved and well-used, pansharpening (short for panchromatic sharpening) is an image fusion technique used to enhance satellite imagery.
The nature of remote sensing satellites means that they only capture high spatial resolution or high spectral resolution imagery.
Imagine you only have two photos of the same scene:
- A very sharp black-and-white photo (panchromatic).
- A less detailed but colorful photo (multispectral).
That’s where pansharpening comes in.
It solves two main problems at once, which are:
- The panchromatic band has low spectral resolution and high spatial resolution.
- Multispectral bands have high spectral resolution and lower spatial resolution.
Pansharpening combines these two images to create a single picture that has the best of both worlds.
The result? A high spatial, high spectral resolution image.
This allows us to see the planet’s features more clearly, making imagery easier for both humans and computers to analyze and understand.

The History of Pansharpening
The roots of pansharpening emerged in the 1970s-1980s as satellites began capturing both panchromatic and multispectral imagery. Early research focused on combining high-resolution panchromatic data with lower-resolution color information.
Key techniques like IHS transform and Brovey transform were developed in the 1990s, leading to the widespread adoption of pansharpening in the 2000s with high-resolution commercial satellites.
How does Pansharpening Work?
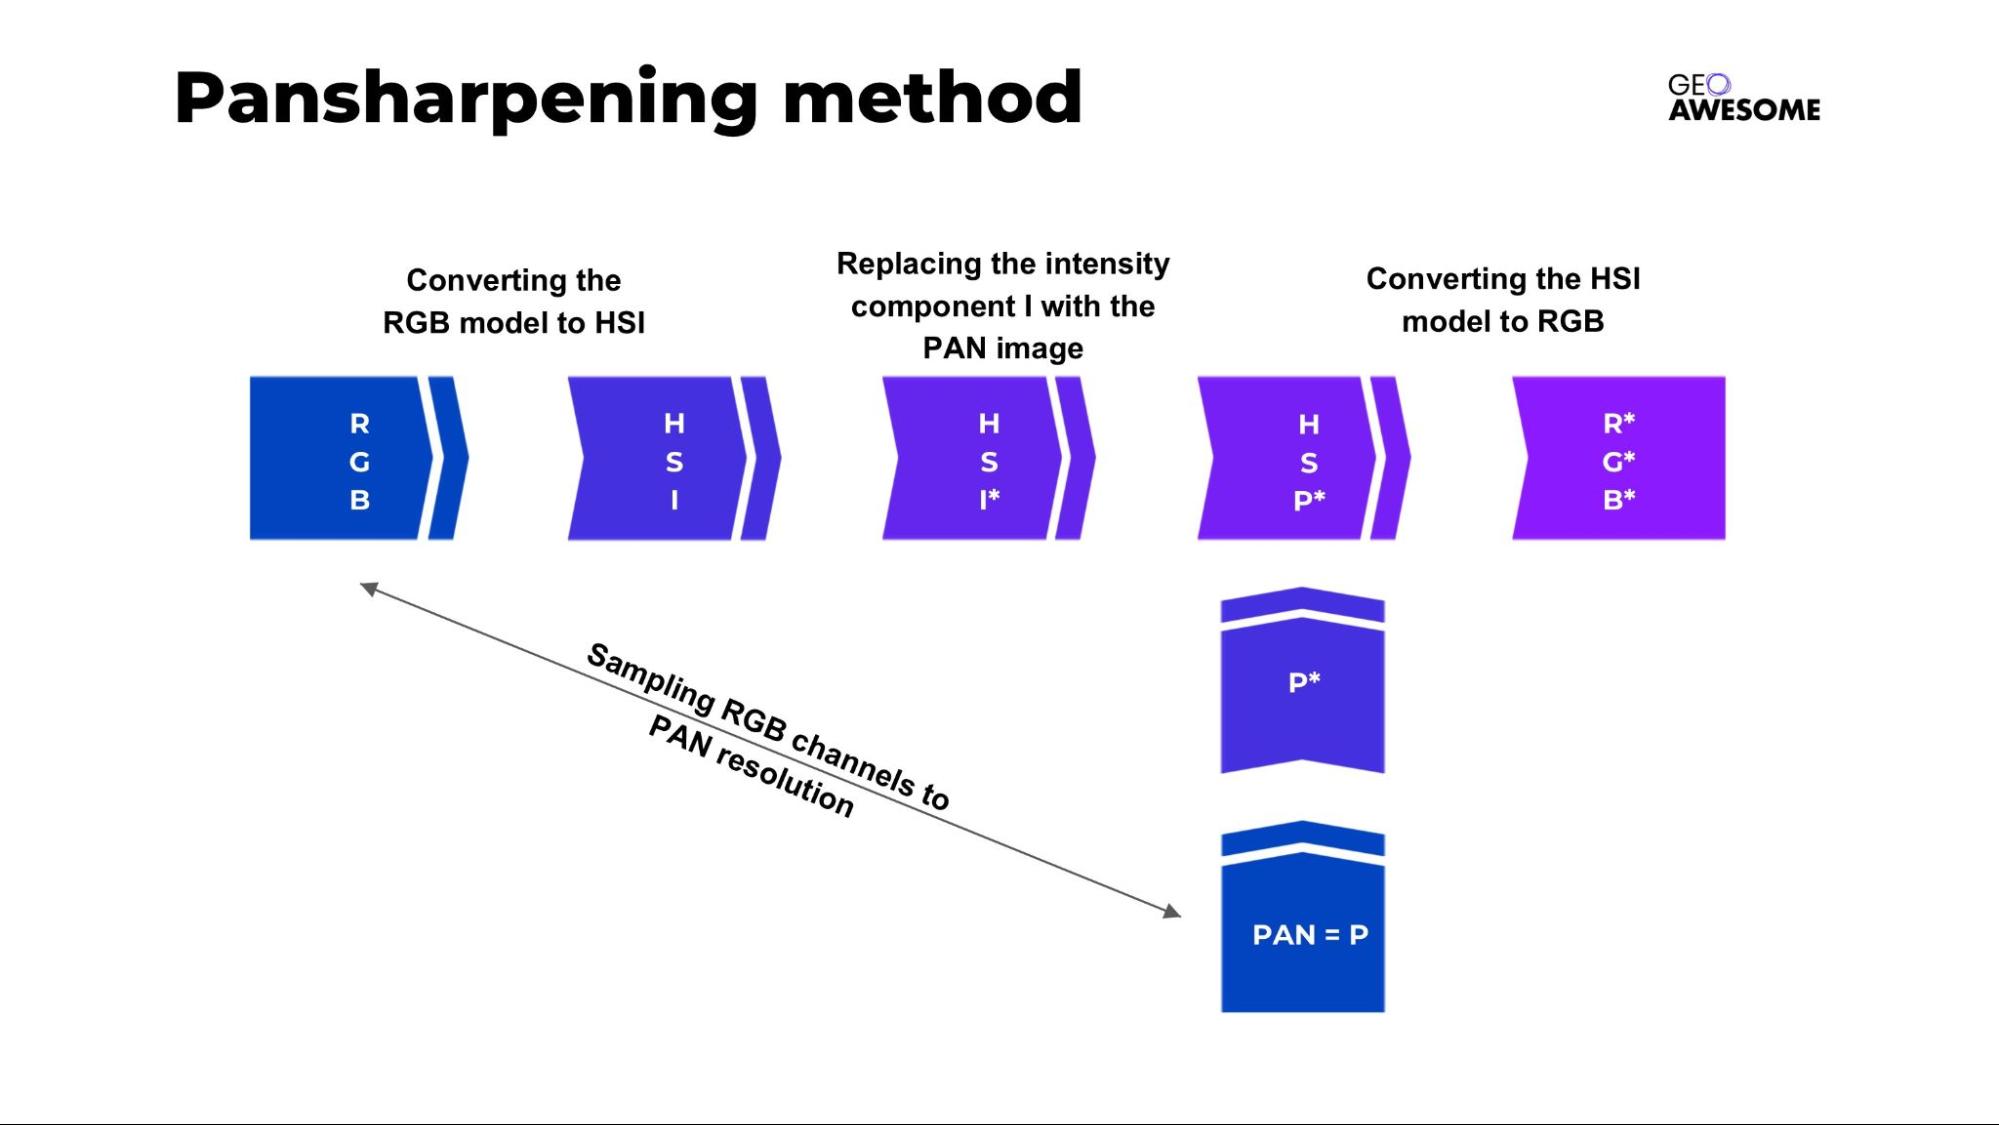
Pansharpening using the Intensity-Hue-Saturation (IHS) method is a popular technique. Here’s how it works:
Step 1: Convert Multispectral Data to IHS Color Space
Multispectral imagery typically includes three bands (e.g. Red, Green, Blue), which have lower resolution compared to the PAN band. The first step to enhancing resolution involves converting the RGB imagery into a new image with PAN-based resolution. Then, this resampled RGB image is converted into an IHS model.
What’s IHS?
- Intensity (I) represents brightness.
- Hue (H) corresponds to the dominant wavelength (perceived color).
- Saturation (S) indicates how vividly these colors appear.
Separating these elements allows us to process spatial information (brightness) and spectral data (color) independently.
Step 2: Merge with a Panchromatic Image
The low-resolution Intensity component is replaced with the high-resolution panchromatic image. By substituting the Intensity component of the multispectral image with a high-resolution panchromatic image, we achieve enhanced spatial detail. The panchromatic image, which has finer spatial resolution than the original intensity layer, effectively boosts the clarity of the final image. The color data—hue and saturation—remains untouched, preserving the spectral richness while upgrading the sharpness.
Step 3: Transform IHS to RGB
Finally, after merging the panchromatic data, the new high-resolution IHS image (with new Intensity) is converted back to RGB. This step restores the color richness from the multispectral data, now combined with the improved spatial detail from the panchromatic layer.
The result? A visually stunning high-resolution color image that offers both enhanced detail and vibrant, accurate colors.
Did you know you can now pansharpen your scenes directly on the UP42 platform? Provided by Pixel Factory, the algorithm allows you to process high-quality Earth observation products using the Brovey method.
You can find more information about the requirements, input, and output in UP42’s technical information. Try pansharpening out for yourself on UP42, for a quick and easy way to extract insights at scale.
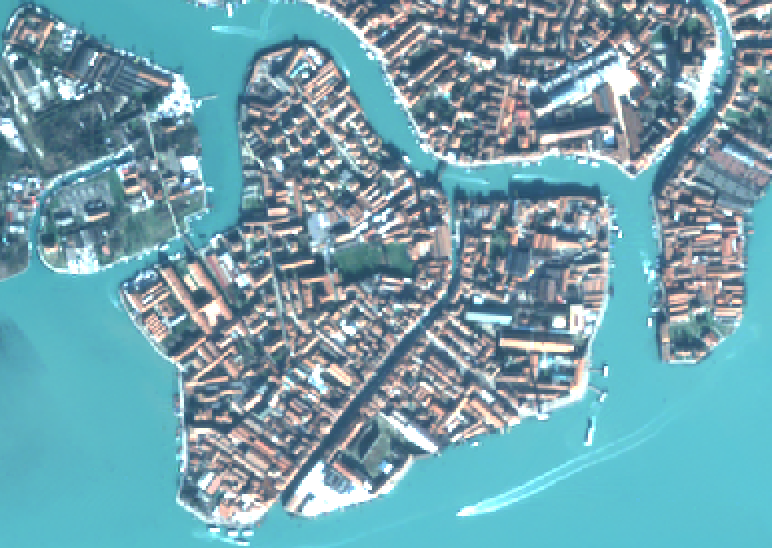
Pléiades, Airbus, original image
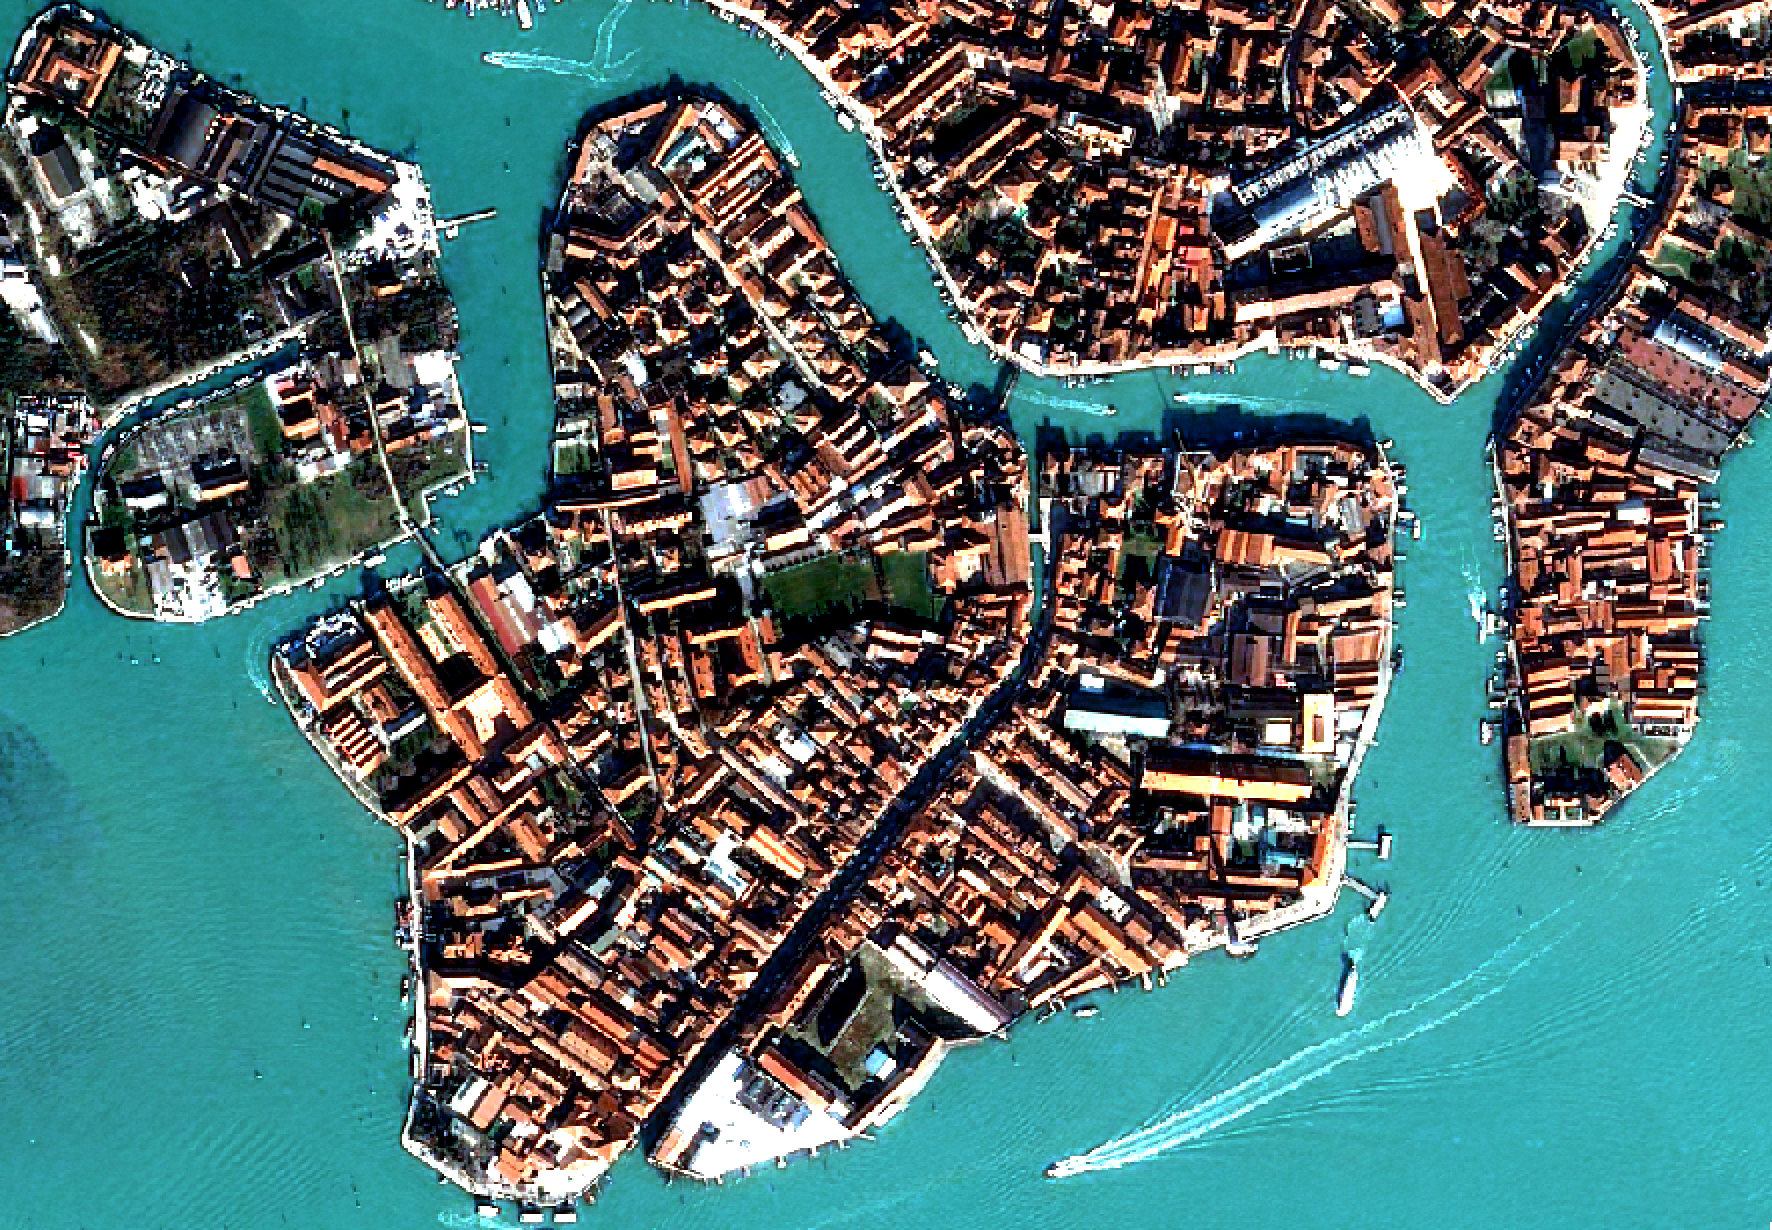
Pléiades, Airbus, pansharpened
How Can We Use Pansharpening?
Now, onto the images. We’ve zoomed into areas around the world – Berlin, Anak Krakatau, Prignitz, State of Pará, and Boxmeer – to give you an idea of how useful pansharpening is across use cases and the globe.
Our workflow looked like this:
- Source data: Landsat
- Bands: 2 (Blue),3 (Green),4 (Red),8 (Panchromatic)
- Tool: GDAL Pansharpening
- Aim: Visualize a raster with 30m resolution into a raster with 15m resolution
- Locations:
Berlin, Germany: Urban Areas
First, we looked at Berlin, Germany. It’s an ideal example of an urban area and the impact that pansharpening can have. In the after image, we’re better able to distinguish between closely spaced objects like individual buildings, and roads.
Pansharpening significantly improves the detection of the fine details of urban structures and buildings, which may not be visible in lower-resolution imagery.
Object detection algorithms perform better when used on pansharpened imagery, as well as other automated analysis techniques. This makes pansharpened imagery particularly valuable for urban planning purposes, such as mapping out population trends, urban land use and land cover changes, and supporting decision-making.
Anak Krakatau, Indonesia: Landslides and Tsunamis
The December 2018 landslide and tsunami in Atak Krakatau, Indonesia drastically reshaped the volcano and surrounding coastal areas. The volcano collapsed into the sea, triggering a devastating tsunami, reducing the island’s height by over 50% and resulting in hundreds of lives lost and casualties.
By applying pansharpening to satellite imagery of Anak Krakatau, we gain a more detailed picture of the changes. Pansharpened data for natural disasters could lead to better risk assessment, disaster response planning, and understanding of similar events in the future. Also, it’s highly useful for volcano activity monitoring and aftermath events in frequent temporal resolution.
Prignitz, Germany: Green Energy and Farming
Pansharpening satellite imagery of Prignitz, Germany – an area known for its farming fields and wind turbines – can provide significant benefits for green energy applications and related use cases.
When it comes to planning new wind farms, pansharpening is a game-changer. It’s great for seeing the lay of the land – where the hills are, how close the turbines would be to residential areas, how many wind turbines are there, and what condition they’re in. Images with PAN resolution are perfect for detecting engineering objects and monitoring the construction process, which often requires more pixels for accurate analysis.
In general, pansharpened imagery enhances the ability to detect changes over time. This means better long-term monitoring for both wind farm expansion as well as agricultural development. As you can see in the images of Prignitz, it’s clear how pansharpened satellite imagery helps to keep an eye on the environment.
State of Pará, Brazil: Deforestation
Next, we looked at a critical area of concern for deforestation in the Brazilian Amazon. In 2023, Pará accounted for 36.4% of the total deforestation in the Brazilian Amazon, making it the state with the highest deforestation rate.
As you can see in the images below, there is much clearer visualization in the pansharpened version. This helps with discerning forest boundaries, forest cover changes, and natural forest regrowth. Thanks to this, you can also observe illegal logging more closely – noticing small gaps in the forest cover.
The deforestation rate in Pará has remained high despite overall reductions in Amazon deforestation. For instance, even when Brazil achieved an 84% reduction in Amazon deforestation in 2012 compared to 2004 levels, Pará continued to be a major contributor to forest loss. The enhanced visual interpretation, improved automated analysis through machine learning algorithms, and temporal monitoring that pansharpening offers make it a key step toward tackling deforestation.
Boxmeer, Netherlands: Flooding
Boxmeer is a town in upper southeast Netherlands, which experienced flooding during extreme weather across Europe in 2021. We’ve pansharpened imagery of the area, which highlights the difference pansharpening makes.
For flooding, pansharpened satellite imagery can be extremely valuable for monitoring and managing risks, especially in the Netherlands. The country’s historic battle with flooding, combined with climate change and heavy rainfall, means that risk mitigation is key. Over 50% of the Netherlands is below sea level, making the country particularly vulnerable to flooding. Pansharpened satellite imagery can significantly enhance countries such as the Netherlands’ ability to monitor, respond to, and plan for flooding.
The aftermath of this catastrophic event was focused on a river bank erosion assessment to protect critical places against further potential floods.
Now that we’ve seen what pansharpening can do, it’s incredible to see how far we’ve come with satellite imagery. What began as a clever way to make photos clearer has evolved into a whole field of space tech.
Today, we’ve got AI and advanced machine and deep learning approaches working their magic to find new ways to improve image quality and reduce spectral distortions. The future of Earth observation is looking bright – and super high-res!
Did you like the article? Read more and subscribe to our monthly newsletter!


#Categories
Next article
Why Orthorectification is Key for Real-World Terrain Mapping and How To Use It
Editor’s note: This article was written as part of EO Hub – a journalistic collaboration between UP42 and Geoawesome. Created for policymakers, decision-makers, geospatial experts and enthusiasts alike, EO Hub is a key resource for anyone trying to understand how Earth observation is transforming our world. Read more about EO Hub here.
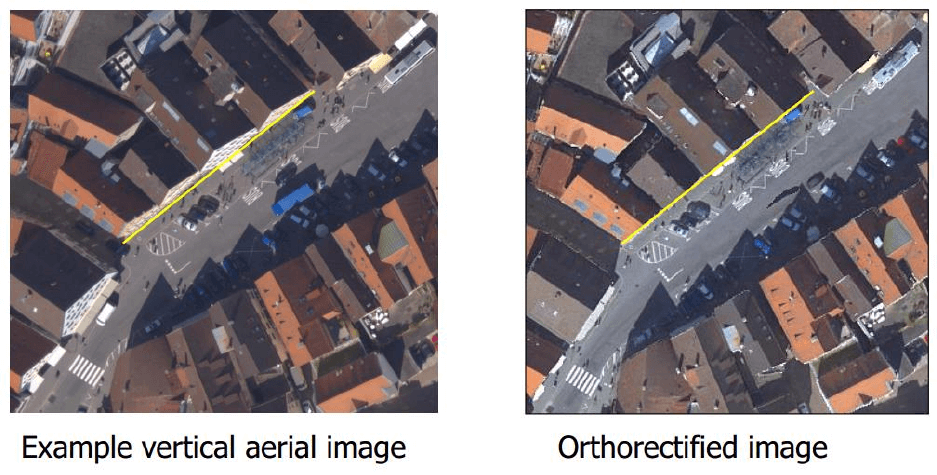
Imagine you’ve taken a photo while standing at a slight angle. Everything would look slightly tilted and not quite as it appears in reality. Think of orthorectification as a process similar to straightening the picture.
In the geospatial realm, orthorectification ensures that everything is accurately represented. Just as you would straighten your photo, orthorectification corrects distortions so that every point in the image corresponds precisely to its real-world location.
In this article, we’ll take a closer look at the reasons why orthorectification is so key to real-world terrain mapping: what is it, why does it matter, and how can you use it?
What is Orthorectification?
Orthorectification is an essential process in creating accurate maps of the planet’s surface.
It corrects distortions in satellite and aerial imagery that are caused by a myriad of factors, such as the angle of the camera (sensor tilt), variations in terrain elevation, and the curvature of the Earth.
Orthorectification acts like a digital straightening tool—it adjusts the image so that everything is correctly aligned, as though the image was taken directly from above (at nadir).
What causes distortions in imagery?
All remotely sensed images of Earth contain a level of geometric distortion. These are inherent in the acquisition geometry, determined by the design of the observing unit and of the observed unit.
Usually, distortions are seen to arise from:
- The observing unit or “observer” – e.g. sensor tilt, the motion of the platform, etc.
- The observed object or “observed” – e.g. the Earth’s surface, rotation, atmosphere, etc.
In general, we see more pronounced distortions in aerial imagery when compared to satellite platforms, which operate from relatively stable orbits and higher altitudes. Either way, removing or reducing image distortions is important before using the imagery to make measurements, create maps, or extract information.
How Does Orthorectification Work?
Orthorectification of an image is a pretty mathematically rigorous transformation of an original image into an orthogonal projection, complete with the elimination of distortions. Orthogonal projections then provide us with the ability and opportunity to create orthophoto images, orthophoto maps, orthophotoplans, and other orthorectified images and products.
To achieve this, orthorectification uses the following inputs:
- Digital Elevation Models (DEMs): These are representations of terrain elevations that help to correct for height variations.
- Rational Polynomial Coefficients (RPCs): These mathematical models describe the relationship between image pixels and geographic coordinates, guiding how to adjust the image.
- Ground Control Points (GCPs): These are known locations on the ground with precise coordinates that improve accuracy during the correction process.
In addition to the above, it’s important to have an awareness of the distortions present in imagery. Understanding distortions such as sensor tilt, when the camera isn’t pointing straight down, and elevation variations, such as mountains or valleys, helps to know which features may be skewed or misrepresented.
Steps for Orthorectification
Now let’s walk through the steps to perform orthorectification:
- Gather Required Data
-
-
- Start by collecting all necessary data, including your datasets, raw satellite or aerial imagery, RPC files, a DEM, and any available GCPs. Having everything organized will make the process smoother.
-
- Select Software
-
-
- Choose GIS software that supports orthorectification processes. Popular options include ArcGIS or specialized tools like ERDAS Imagine. Each has its own strengths, so pick one that fits your project needs.
-
- Input Data
-
-
- Load your raw image into the software along with the RPC file and DEM. This step is where you set up everything for the correction process.
-
- Apply Orthorectification Algorithm
-
-
- Here’s the fun part! Apply orthorectification algorithms:
- For basic correction: if you’re working with just RPCs and a DEM, you can start by using these to adjust your image.
- For enhanced accuracy: if you have GCPs available, incorporate them into your correction process. This will significantly improve the accuracy of your final product.
-
- Validate Results
-
-
- Once you’ve applied corrections, it’s crucial to validate your results. Compare your orthorectified image against known reference images or datasets to ensure accuracy. This step helps catch any errors before you move forward.
-
- Export the Orthorectified Image
-
- Finally, when you’re satisfied with the corrections and validations, save your orthorectified image for further use in mapping or analysis. This image is now ready to be integrated into GIS applications or shared with stakeholders.
What is Real-World Terrain Mapping?
Terrain maps are graphical representations of the Earth’s surface. They depict the physical features of an area and use contour lines to illustrate changes in elevation and outline the shape and characteristics of the land.
From hills and valleys to water bodies and forests, terrain maps focus on the landscape’s shape and elevation. The wealth of information within terrain maps means they’re useful for navigation, urban planning, infrastructure, land use, and much more.
How Does Orthorectification Help with Real-world Terrain Mapping?
As we know now, the orthorectification of satellite and aerial imagery helps to piece together a more accurate picture of the planet. It is an essential step towards creating reliable maps and conducting precise measurements.
Here’s how orthorectification contributes to this:
- Correcting Distortions: This is crucial for creating reliable maps where features like roads, buildings, roofs, and natural landscapes are correctly positioned.
- Uniform Scale: One of the key benefits of orthorectification is that it provides a constant scale throughout the image. This means distances can be measured accurately without the need for field checks. For example, when helping urban planners assess land for development, they can rely on precise measurements from orthorectified images.
- Integration with GIS: This integration allows for the combination of various datasets, such as land use data or environmental information, enabling more comprehensive analyses and terrain map creation.
- Enhanced Visualization: Orthorectified images serve as effective background layers in GIS applications, providing a clear visual context for analysis results. This clarity helps users interpret complex spatial data more easily, making it valuable for decision-making processes in fields such as environmental monitoring and disaster management.
- Up-to-Date Data for Rapid Response: In situations like natural disasters, having up-to-date orthorectified imagery allows emergency responders to assess damage quickly and efficiently.
- Precision in Environmental Monitoring: Orthorectified images are essential for tracking changes in land cover, deforestation, and other ecological phenomena with high precision.
In general, orthorectification not only enhances visual clarity but also ensures that measurements taken from these images are precise and useful for various real-world applications.
How Can We Use Orthorectification?
Use cases: Orthoimagery Applications
Orthorectified imagery has an incredibly wide range of applications, from precision agriculture and urban planning to disaster response and environmental monitoring. Its versatile nature makes it a useful resource across different sectors.
Below are some visuals illustrating the before and after effects of orthorectification. You can see the difference it makes when applied to use cases including vessel, shoreline, construction, and traffic monitoring.
Before and after images: Orthoimages vs. Orthorectified True Ortho
Orthorectification in urban areas corrects distortions, ensuring that buildings, roofs, and other objects appear in their true geographical positions. In the after image (visual below), it’s noticeable that the building’s roofs are in the correct position. This example comes from Żory city center in Poland.
Mapping parcels and elements within them ensures that property boundaries, buildings, and infrastructure are accurately represented in their true positions on the Earth’s surface. This precision allows for reliable measurements, with accuracy up to centimetres, and spatial analysis of the parcel’s components, such as building footprints, vegetation, and utility lines, without distortion or misalignment.
In this example, we’ve looked at Jasna Góra fortress in Częstochowa, Poland. When mapping high towers and fortresses, like here, orthorectification ensures that these tall and complex structures are accurately positioned on the map without distortion due to elevation or sensor angle.
In mapping industrial pipes and chimneys, orthorectification ensures that these tall and linear structures are accurately positioned in relation to the ground, correcting any distortions caused by their height or the angle of image capture. In this case is important to project the accurate position of these engineering facilities.
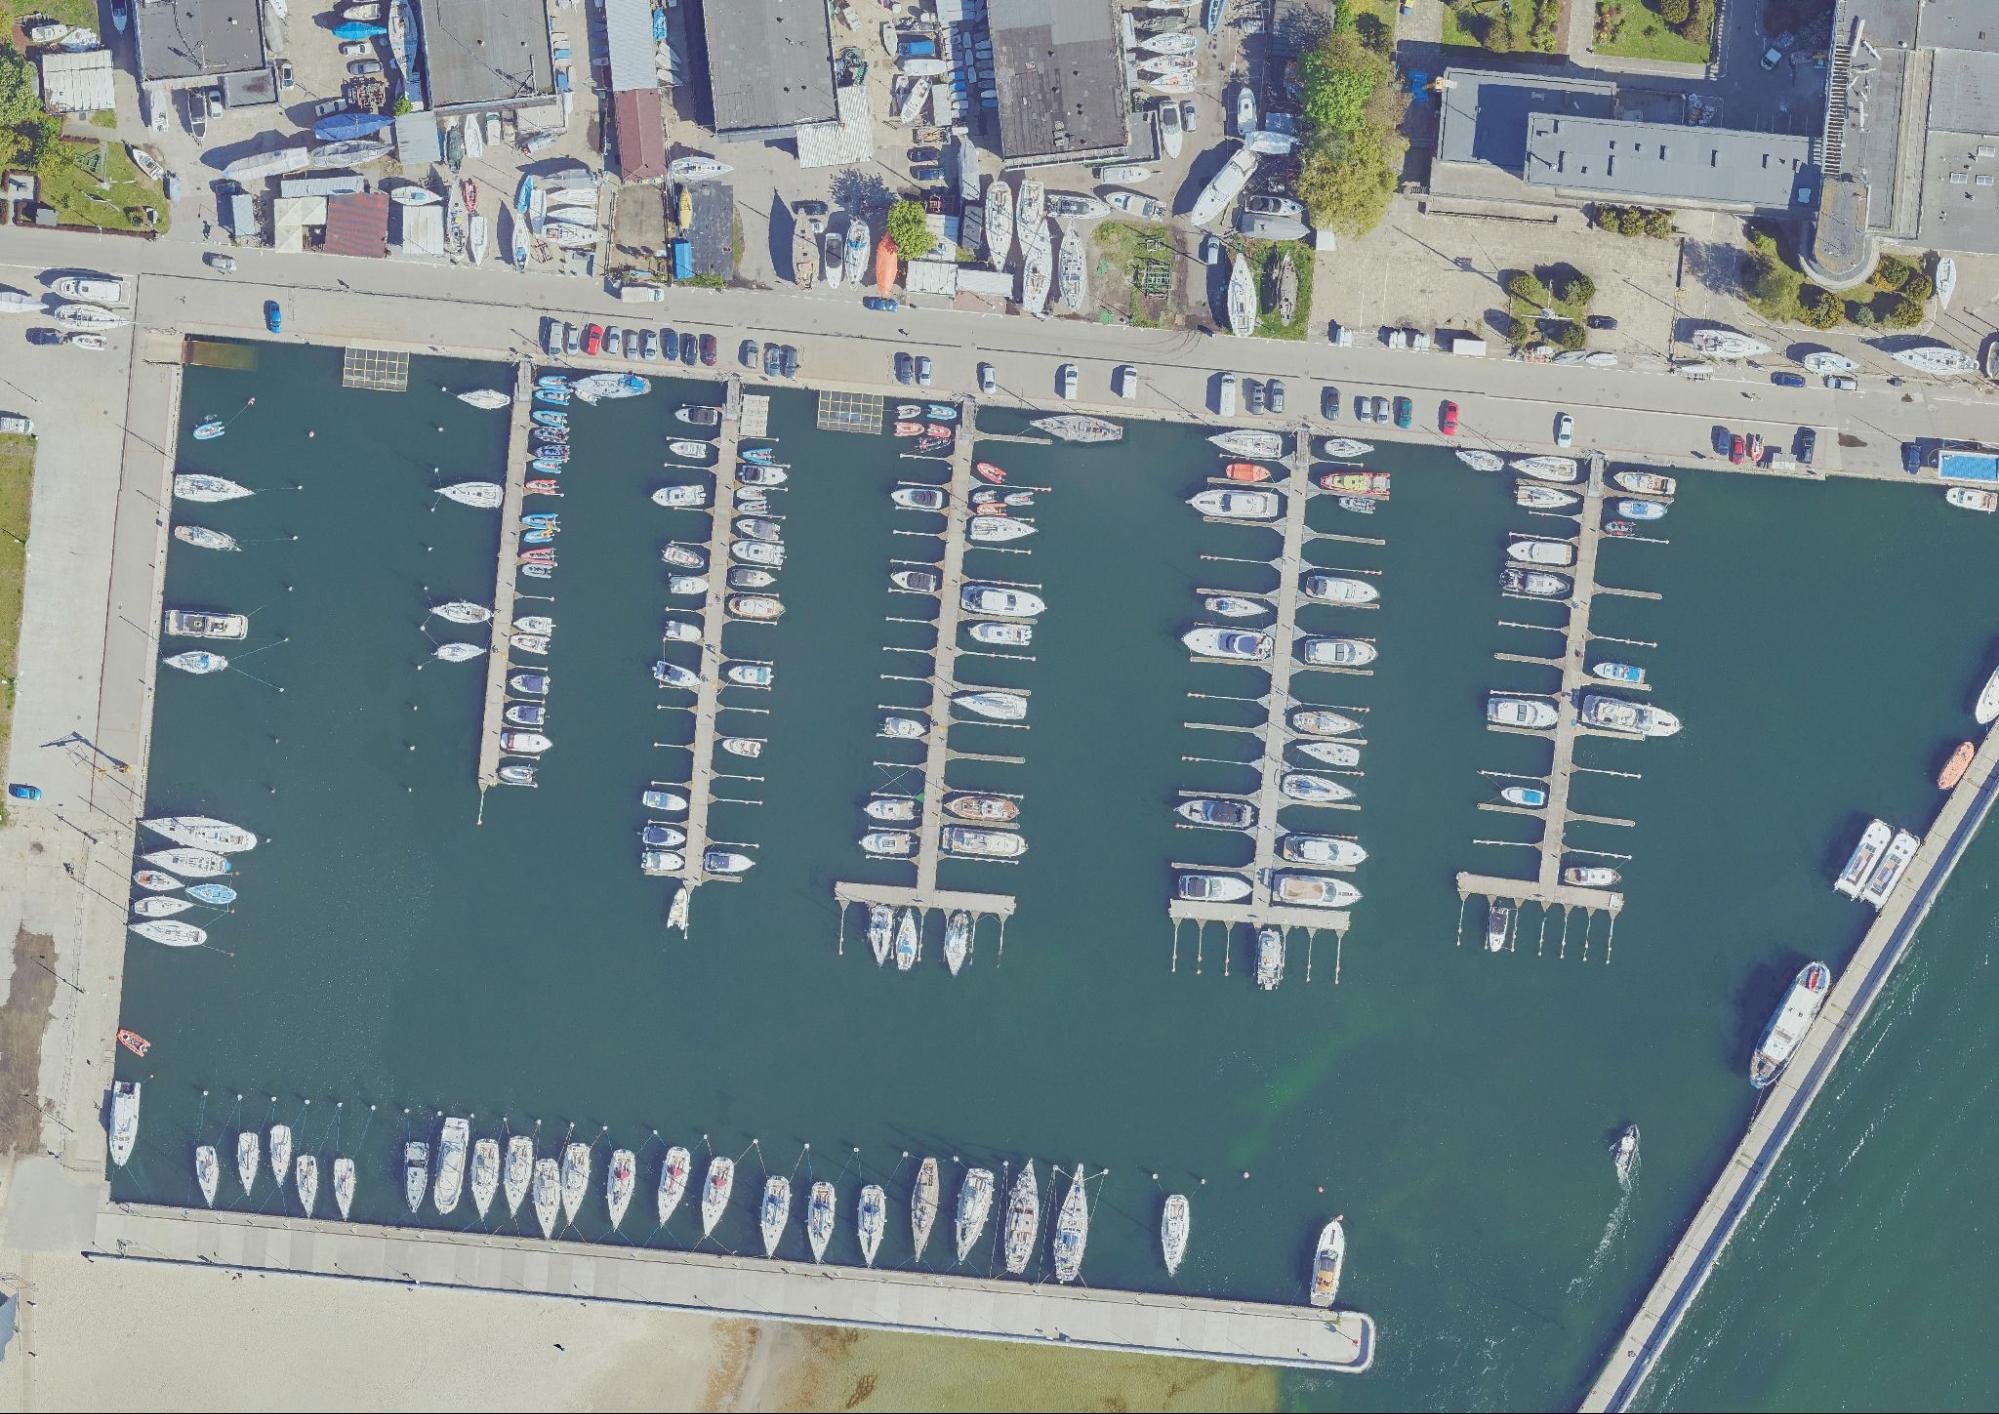
Vessels monitoring
Case study: Gdynia, Poland
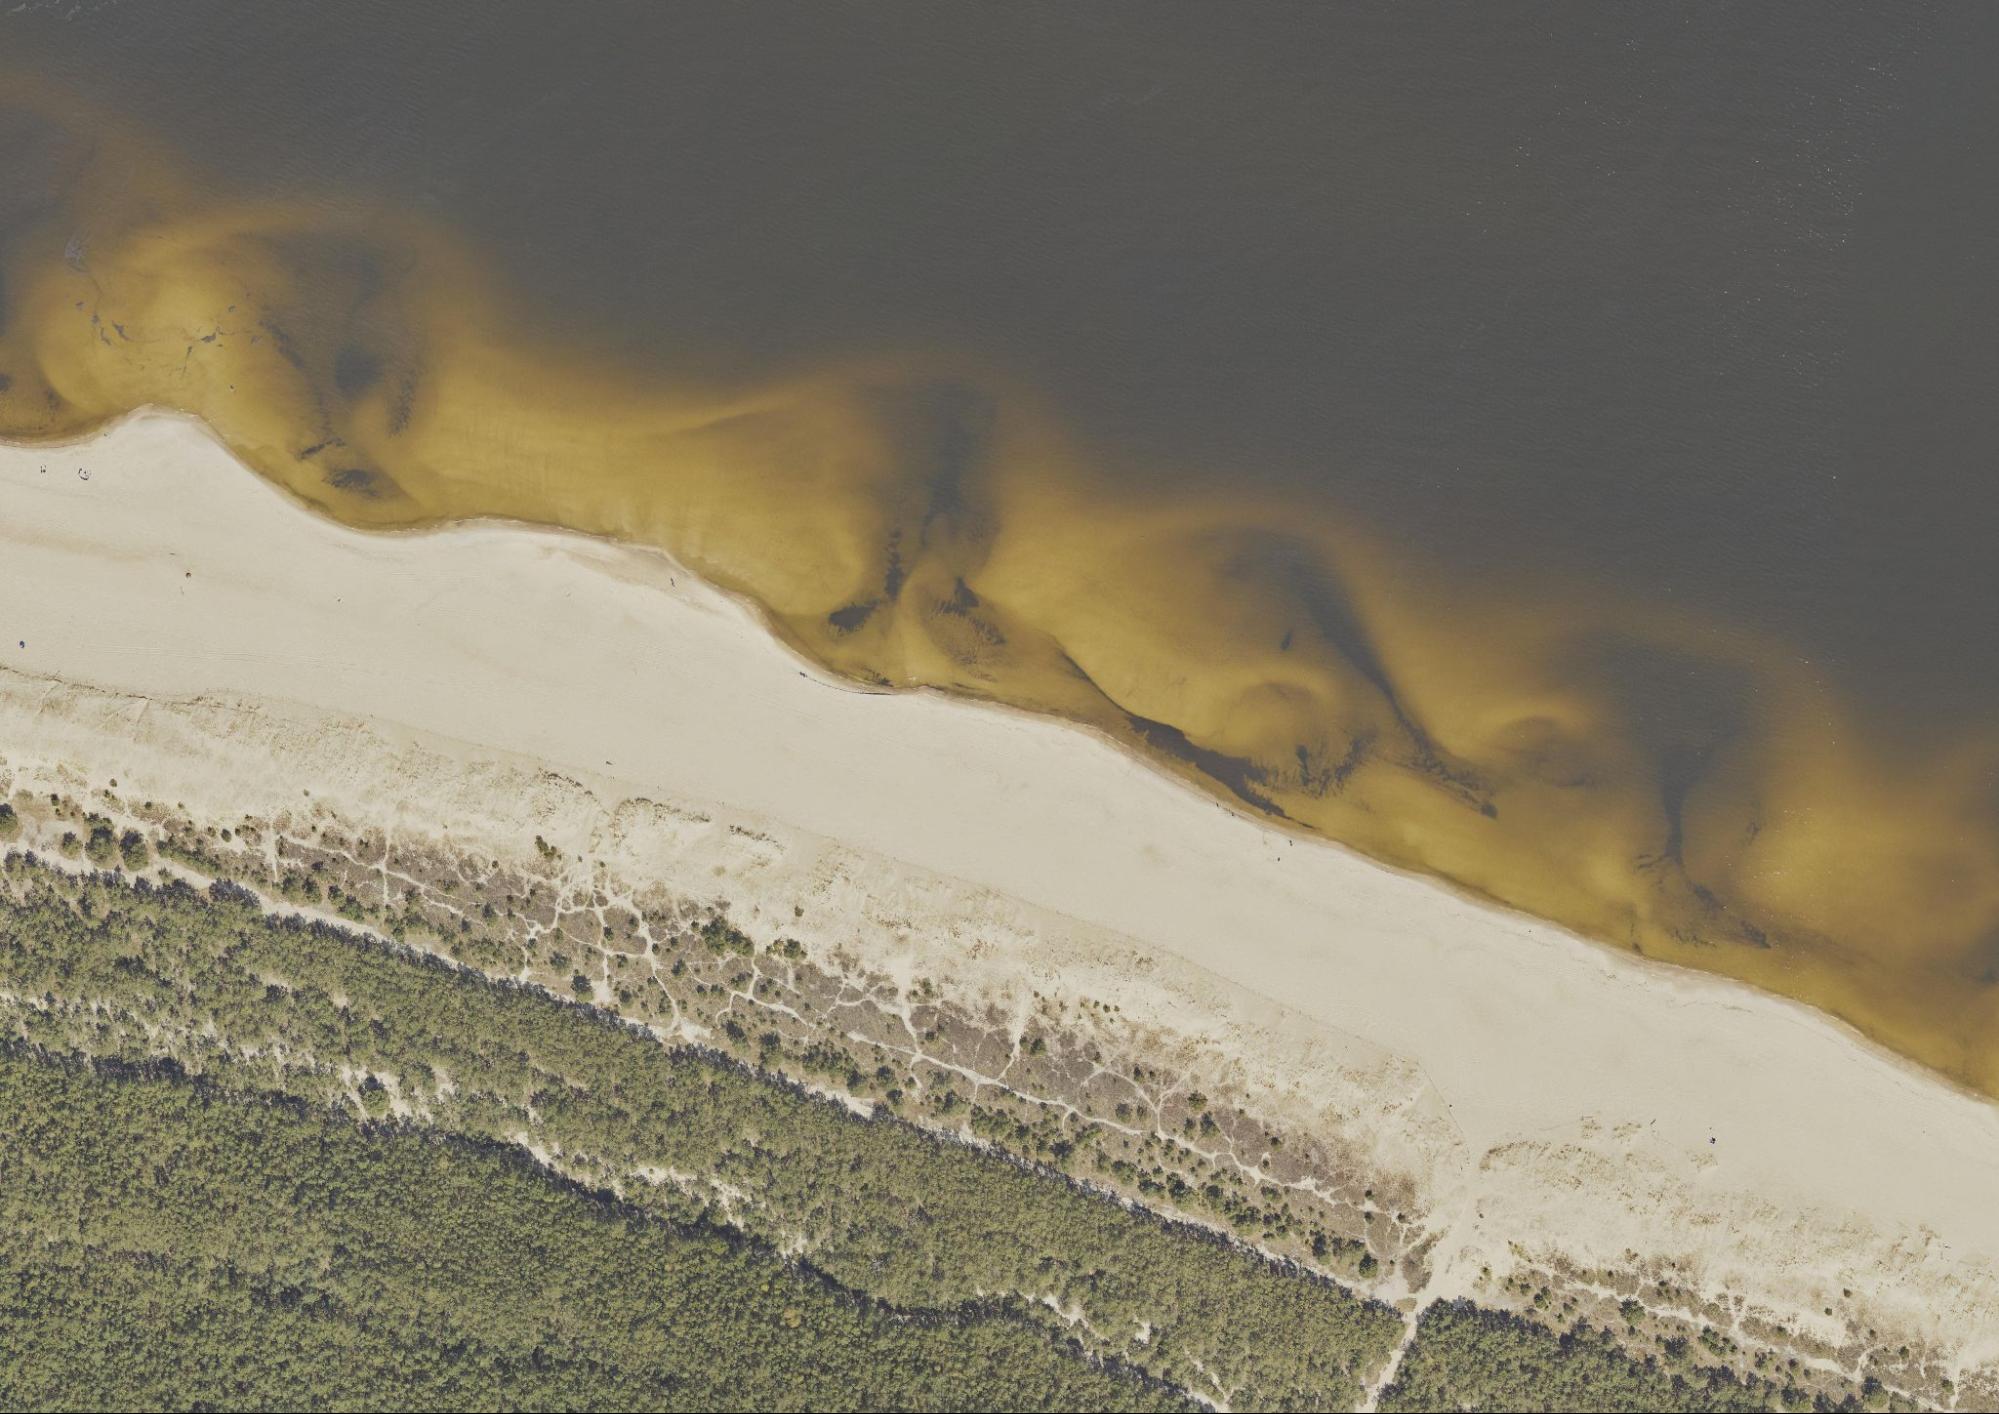
Shoreline monitoring:
Case study: Shoreline near Gdańsk, Poland
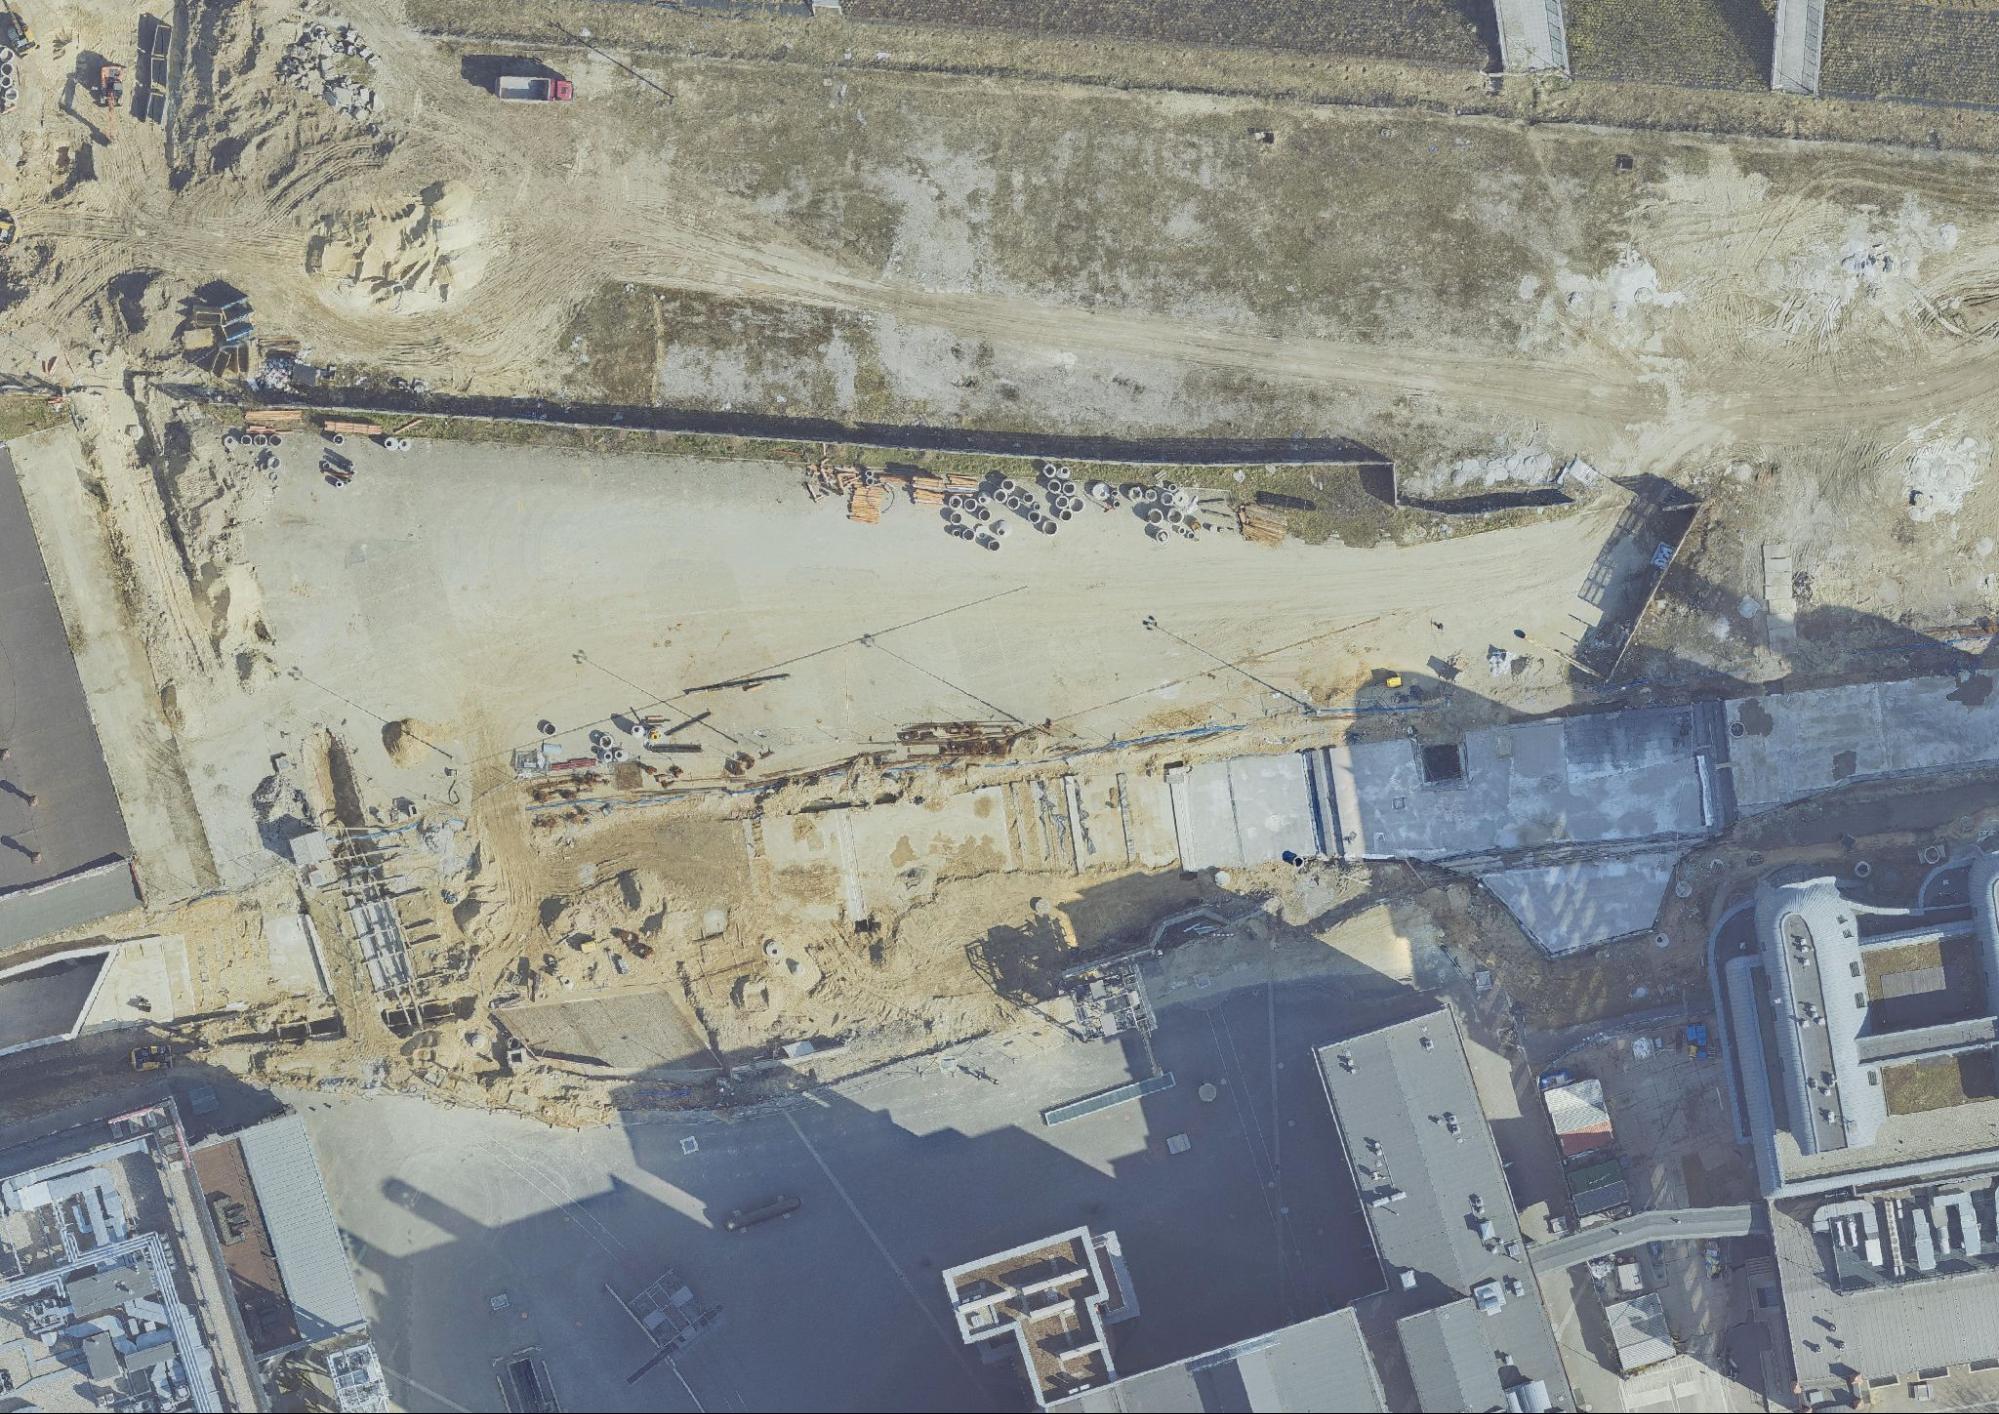
Construction monitoring:
Case study: Łódź, Poland
Car traffic monitoring:
Case study: Częstochowa, Poland
Orthoimages repository
In summary, orthorectification removes sensor/satellite motion and terrain-related geometric distortions to obtain map-suitable images. By correcting distortions, we ensure a uniform scale. This facilitates GIS integration and provides enhanced visualization.
Orthorectification plays a key role in effective real-world terrain mapping across various applications—from urban planning to environmental monitoring and disaster response.
Want to perform orthorectification yourself? Check out UP42’s practical guide.
Did you like the article? Read more and subscribe to our monthly newsletter!

