#Business

Citymapper starts cab service in London while Uber gets banned
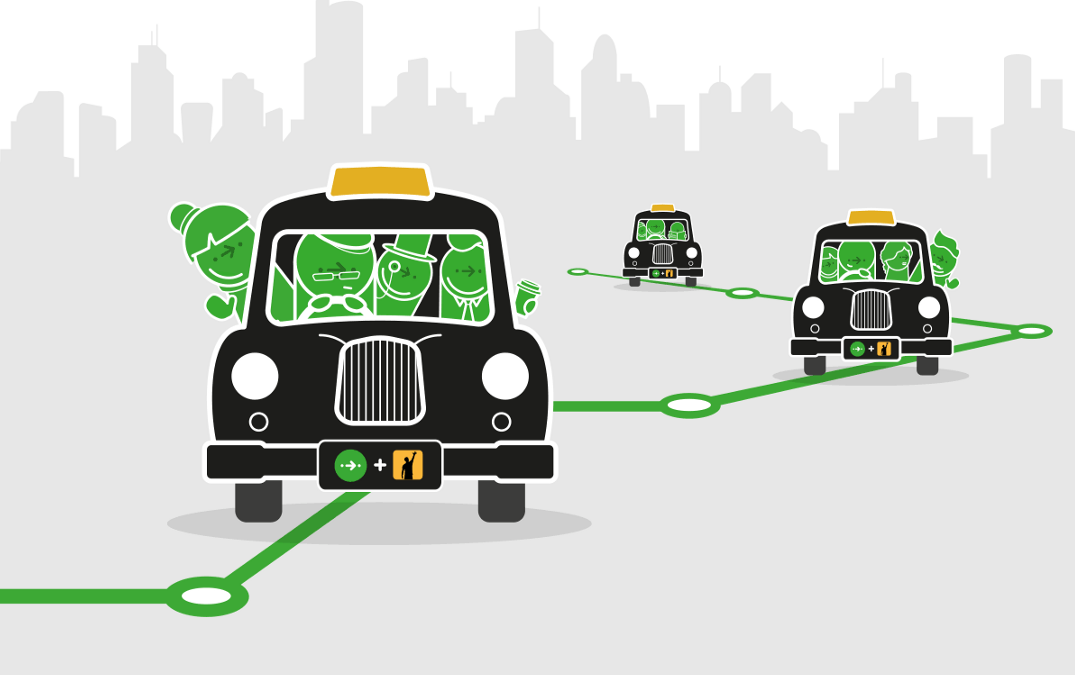
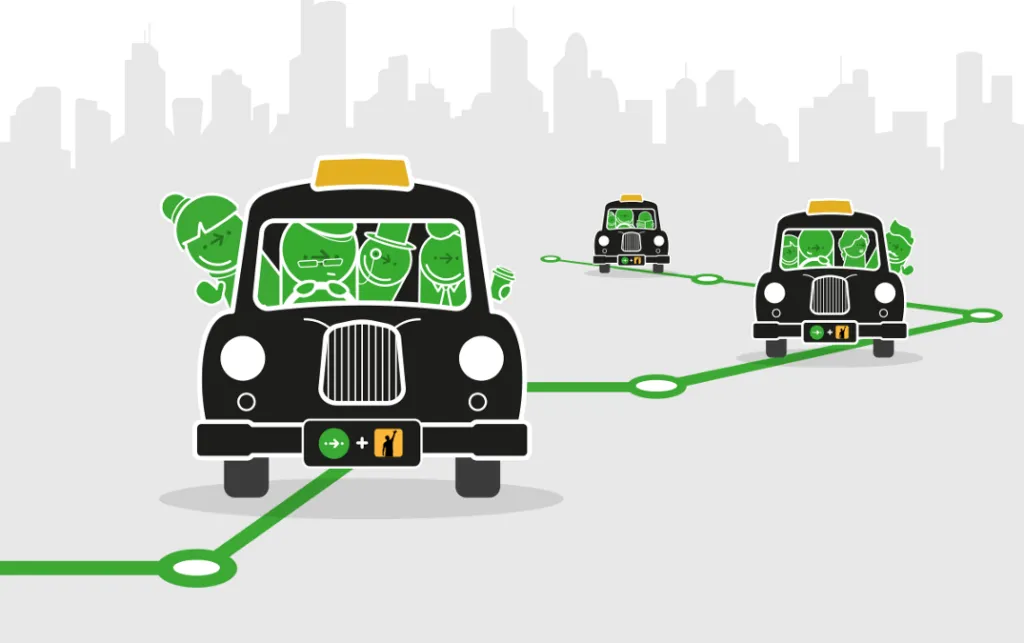
Talk about timing! Urban transport startup Citymapper is starting a shared cab service in London in collaboration with UK’s black cab app, Gett. The initial service is being offered on a fixed route which was found to be underserved when Citymapper analyzed the millions of journeys logged into its app by commuters. And this development comes just one day before Transport for London (TfL) announced its ban of Uber ride-hailing service on account of safety concerns.

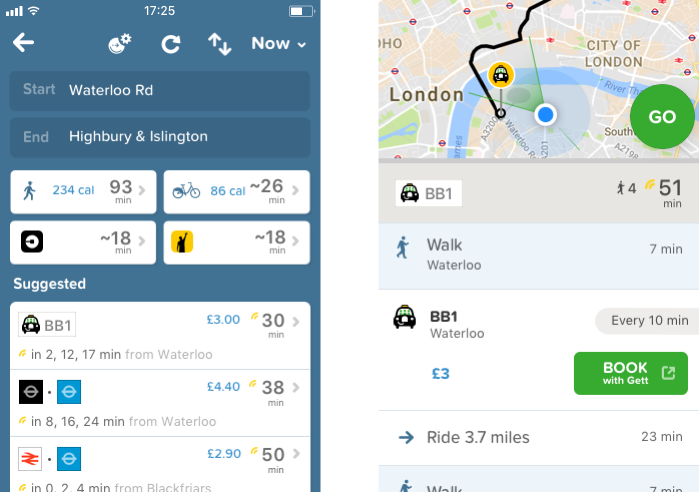
Now, Citymapper and Gett’s ‘Black Bus’ service is not looking to replace Uber. The project has in fact given a new twist to taxi-sharing by offering a cab at the price of public transport. For only £3, commuters can hop on and off anywhere between Highbury and Waterloo in London. Right now, the service is being offered only during peak rush hours, between 7am – 10am and 5pm – 8pm, when other modes of public transportation are bursting at their seams.

Citymapper believes that such innovative, alternate commute options point to the future of public transport. “We can respond quickly to user needs, by editing and evolving the route as we learn. Regular buses can’t do that. The future of the city should be smart, shared and responsive,” the geospatial startup explains in a blog post.
This, of course, isn’t the first time Citymapper has come up with an answer to urban mobility using its route creation and evaluation analytics. Earlier this year, the company launched its first night bus service on the most vomit-prone route in East London. It fitted its swanky, tech-high buses with smart displays to let tipplers know the vehicle’s progress, and powered the vehicles using a proprietary tracking and management software to minimize the wait time for passengers.

The new Black Buses are fully integrated with London’s transport network and can be pulled up in Citymapper’s app. The shared cabs are multimodal ready, which means they will allow commuters to mix and match the service with other modes of public transport and reduce travel times for a wide range of A to Bs across the city.

Well, how successful the Black Buses would become remains to be seen, but it’s good to know that Londoners have another smart alternative at their hands while Uber appeals the ban.

Say thanks for this article (0)
The community is supported by:
Become a sponsor
#Business
#Business #Featured #GeoDev
Geo Addressing Decoded, Part 4: Exploring the Applications of Geo Addressing Solutions
Aleks Buczkowski 06.25.2024
AWESOME 2
#Business #Featured #GeoDev
Geo Addressing Decoded Part 2: Beyond Coordinates – Exploring the Depth and Impact of Geo Addressing
Aleks Buczkowski 05.2.2024
AWESOME 4
#Business #Events #Featured
Gain Insights from Spectral, SAR, and LiDAR Thoughts Leaders at Geo Sessions 2024
Avatar for NV5 Geospatial
NV5 Geospatial 09.30.2024
AWESOME 4
Next article
#Business

Would you survive a nuke attack on your city?

Between North Korea’s obsession with showing off its military might, US President Donald Trump’s “no choice but to totally destroy North Korea” comments, and the limbo on Iran nuclear agreement, the news cycle has left many of us feeling anxious. People have been wondering: “What would happen if someone drops a nuclear bomb on my city?”

Alex Wellerstein, a historian of nuclear weapons, has an answer. He is the creator of an interactive visualization called the Nukemap. The model allows users to select different types of nuclear weapons and see what kind of impact they would have when detonated on different locations on earth.

“Most people have a very bad sense of what an exploding nuclear weapon can actually do,” Wellerstein explains. “Some people think they destroy everything in the world all that once, some people think they are not very different from conventional bombs. The reality is somewhere in between: nuclear weapons can cause immense destruction and huge losses of life, but the effects are still comprehendible on a human scale.”

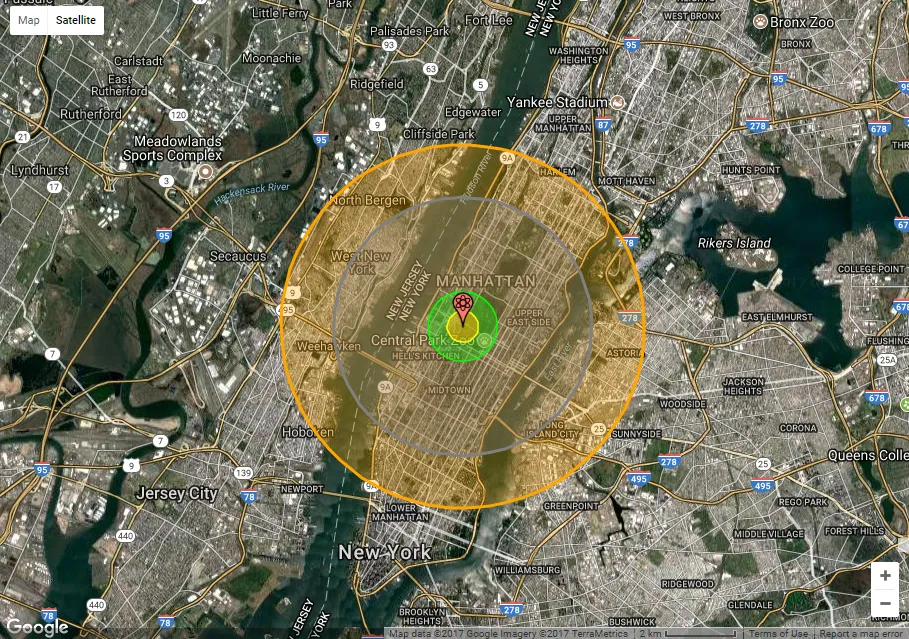
Take the visualization below for example. It shows that if the bomb that was recently tested by North Korea were to fall on Manhattan, New York, it would lead to an estimated 818,240 deaths and about 1,551,410 injuries.

nuclear map

The center portion is the fireball radius which is estimated to be around 450 m, followed by a kilometer-wide radiation zone. The grey portion shows the almost 4 km-wide air blast region, while the last ring denotes more than 5 km-wide thermal radiation zone which would give third-degree burns to anyone who falls in it.

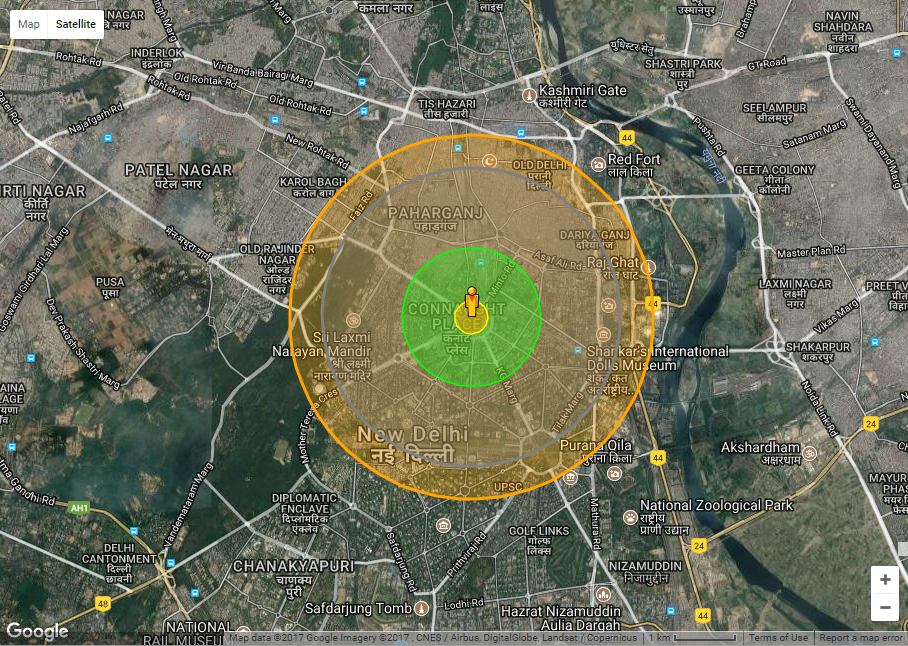
Below, you can see what Pakistan’s largest tested weapon would do to the busy city center of New Delhi:

nuclear map

Wellerstein says, “The Nukemap is aimed at helping people visualize nuclear weapons on terms they can make sense of — helping them to get a sense of the scale of the bombs. By allowing people to use arbitrarily picked geographical locations, I hope that people will come to understand what a nuclear weapon would do to places they are familiar with, and how the different sizes of nuclear weapons change the results.”

You can explore the Nukemap here. Peace, please!

Read on
Search