Big Time BCN – Beautiful interactive map of the architectural history of Barcelona
 Barcelona is definitely one of the coolest and most beautiful cities in the world. And definitely one of my favourite places on the planet. Architecture, atmosphere, people, scent, food, sea… everything makes the city very inspiring. Maybe that’s one of the reasons behind the most interesting map I’ve seen for some time.
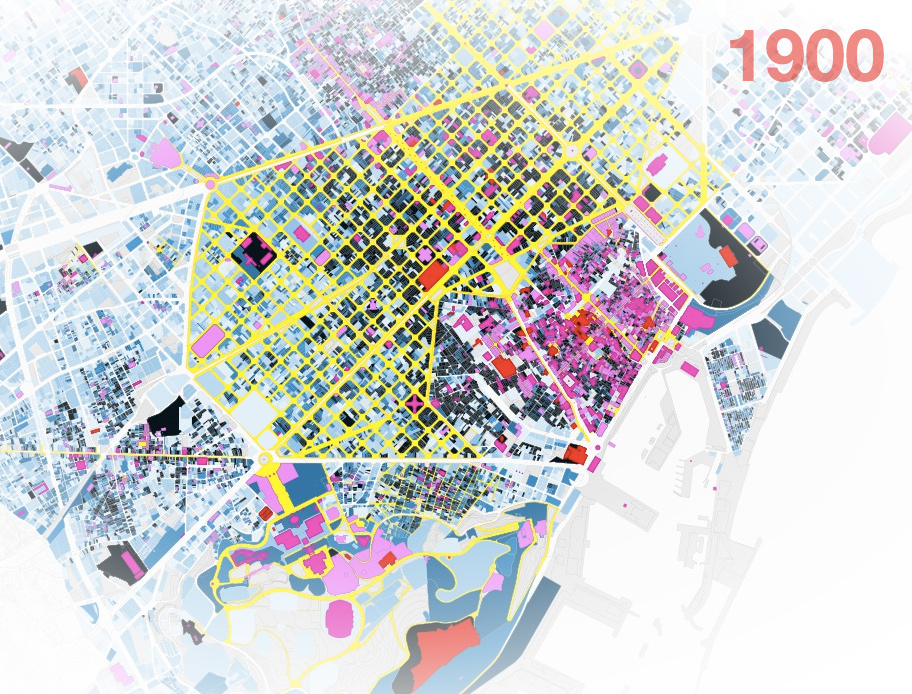
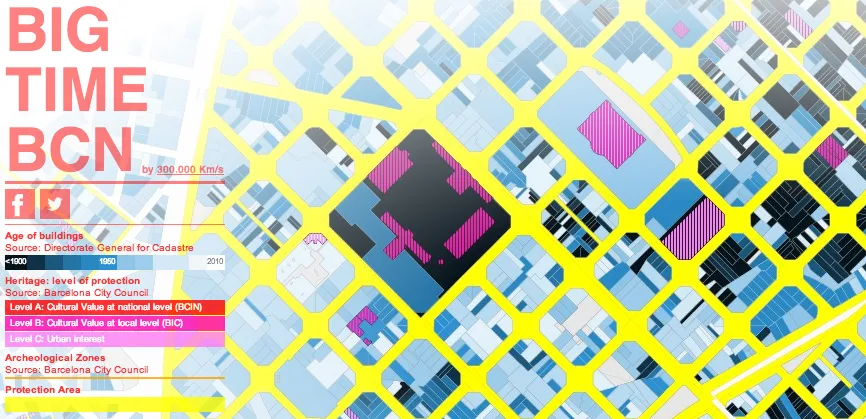
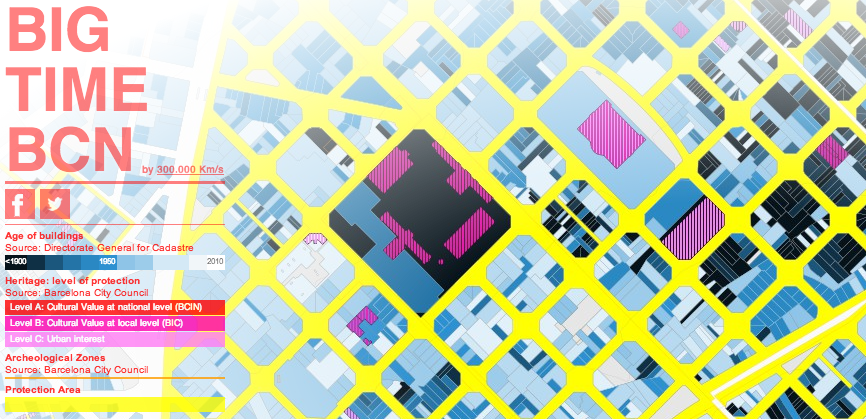
Big Time BCN (Barcelona) is an interactive visualisation of data from more than 70,000 plots and 3,000 monuments created by Pablo Martinez, Mar Santamaria and Oriol Hostench fro,m 300.000km/s design firm. In addition to its most celebrated monuments, such as the Sagrada Familia or Parc Güell, Barcelona has several thousands of other places worth seeing. The map seeks to visualise these places in an flexible format in order to raise awareness about the richness and importance of architectural and urban heritage.
The web app has been done in Leaflet with cadastral map data. The colours of the map represent several levels of information. The first level represents the age of the building – black indicates structures built before 1900, lighter shades of blue indicate more recent structures. Another level of information is from pink to red and it stands for cultural value of the item. When you click on that elements you’ll get a pop-up window with extra info about this particular venue. Yellow colour represents the protected area of urban heritage.
There’s also an Android app available which is basically mobile version of the website. Simple but might be useful. From the practical point of view the project is definitely no the best travel guide out there and not the best database, but from cartographic side it is a piece of really good looking map. Don’t you think?


