Australia’s bushfires as seen from space: Satellite pictures reveal overwhelming scale
When Australia’s fire season begun in September 2019, nobody could have imaged it would turn out to be one of the worst seen in decades. The raging inferno has led to the death of at least 24 people and half a billion animals to date. More than 1,500 houses have been destroyed and roughly 15 million acres of land – about twice the size of Belgium – scorched. As the grim outlook continues, here are some satellite images that reveal just how bad the fires really are.
Southeastern Australia: Now and Then

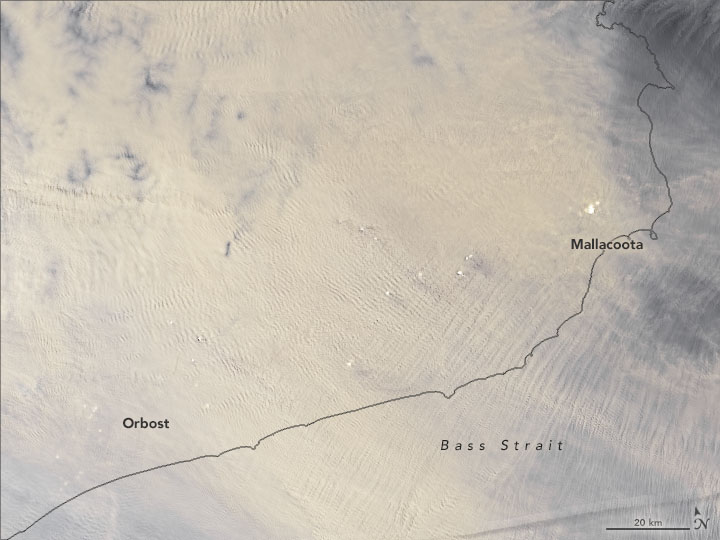
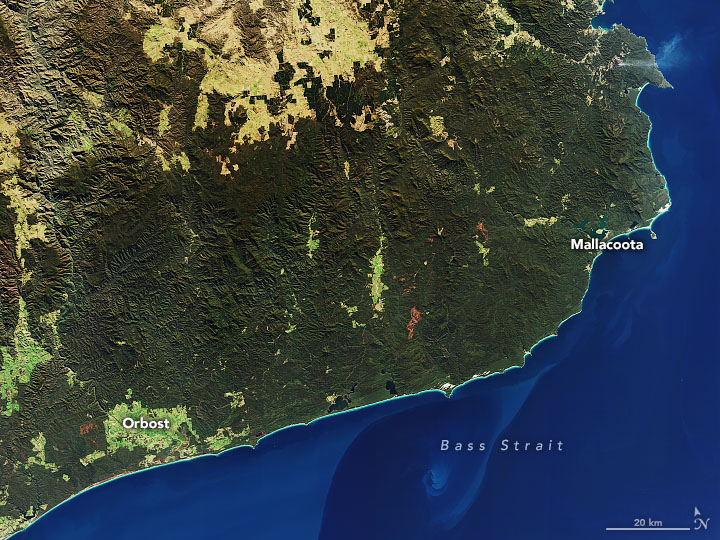
On January 1, 2020, the Operational Land Imager (OLI) on NASA’s Landsat 8 acquired a natural-color image (above) of thick smoke blanketing southeastern Australia along the border of Victoria and New South Wales. For comparison, the image below shows what the same area looked like under cloud- and smoke-free conditions on July 24, 2019.
Australia’s bushfires: Explosive fire in the state of Victoria
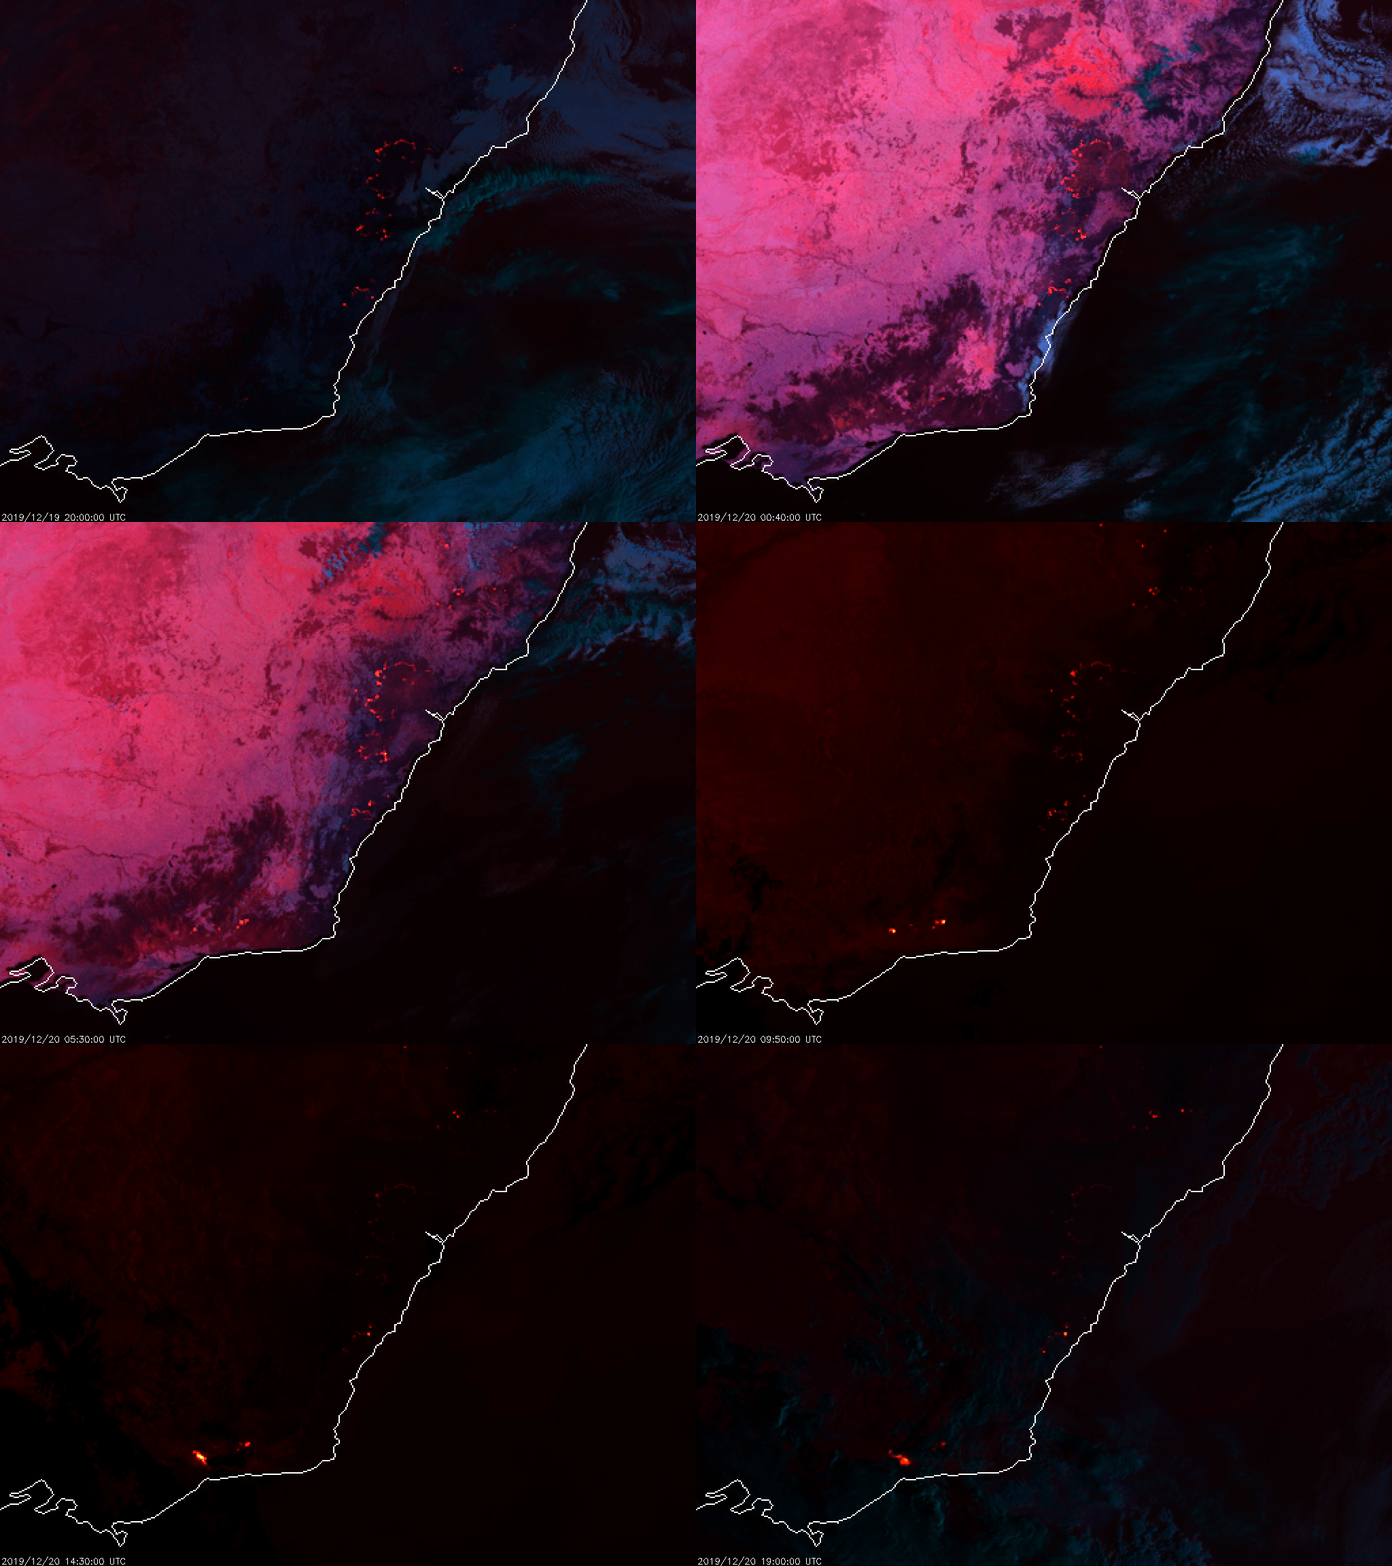
Japanese geostationary weather satellite Himawari-8 overlooks the western hemisphere and captures multi-band colored images every 10 minutes. On December 20, 2019, as massive wildfires raged in Australia, the satellite captured the below fire temperature.
Traces of Australia on New Zealand Glaciers
Acquired by NASA’s OLI, the below side-by-side comparison shows the areas of dirty snow and ice in New Zealand’s Southern Alps. While the left image shows the area on December 15, 2014, during a typical year, the image on the right was acquired on November 11, 2019, during the current bushfire season. Notice the difference in color and clarity of the images. 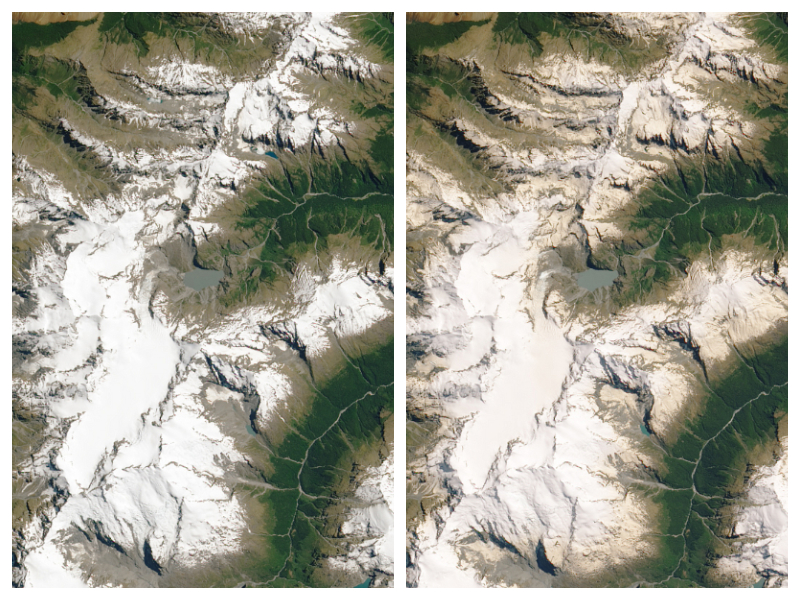
Australia’s bushfires: Colors of Fire
In this loop captured by Japan’s Himawari-8, you can see massive wildfires along the east coast. While the image on the left side shows natural fire color (aka day land cloud fire RGB), the one on the right highlights the hotspots in infrared light.
Massive Brownish-Gray Smoke
From its vantage point nearly 23,000 miles up, NOAA’s GOES-West weather monitoring satellite watches massive amounts of brownish-gray smoke from the Australian wildfires spreading over NewZealand and the South Pacific on January 3, 2020.
From its vantage point nearly 23,000 miles up, #GOESWest can see massive amounts of brownish-gray #smoke from the #AustralianBushFires spreading over #NewZealand and the #SouthPacific.
More real-time imagery: https://t.co/U2kJQTbbdy#FullDiskFriday #Australia #NSWFires #BushFire pic.twitter.com/Uv7v1MYmb4— NOAA Satellites (@NOAASatellites) January 3, 2020
Smoke Drifts over the Tasman Sea
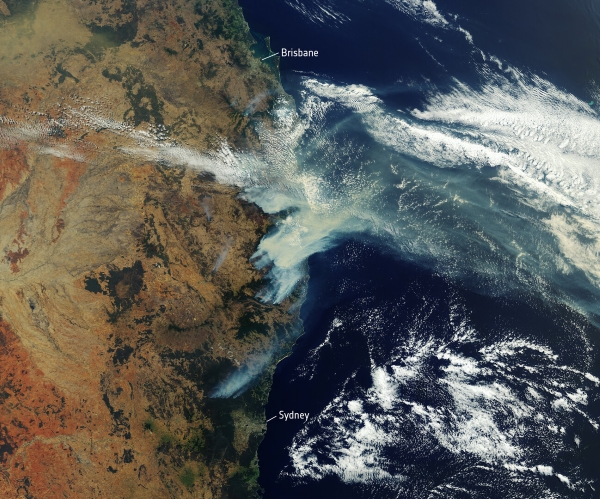
In this November 12, 2019 image, the Copernicus Sentinel-3 mission captured the multiple bushfires burning across Australia’s east coast with plumes of smoke drifting east over the Tasman Sea.
If you enjoyed this article, read more and subscribe to our monthly newsletter!


