#Ideas #Science

The Atlas of the underworld is the first complete map of Earth’s mantle and its evolution

Plate tectonics is a fascinating concept – it’s amazing to see how our planet has changed over the course of millions of years all due to movement of the tectonic plates at the rate of a few centimetres each year. Mountains arise where none existed, Continents drift apart, and Volcanoes are created all because the plates move few centimetres each year!
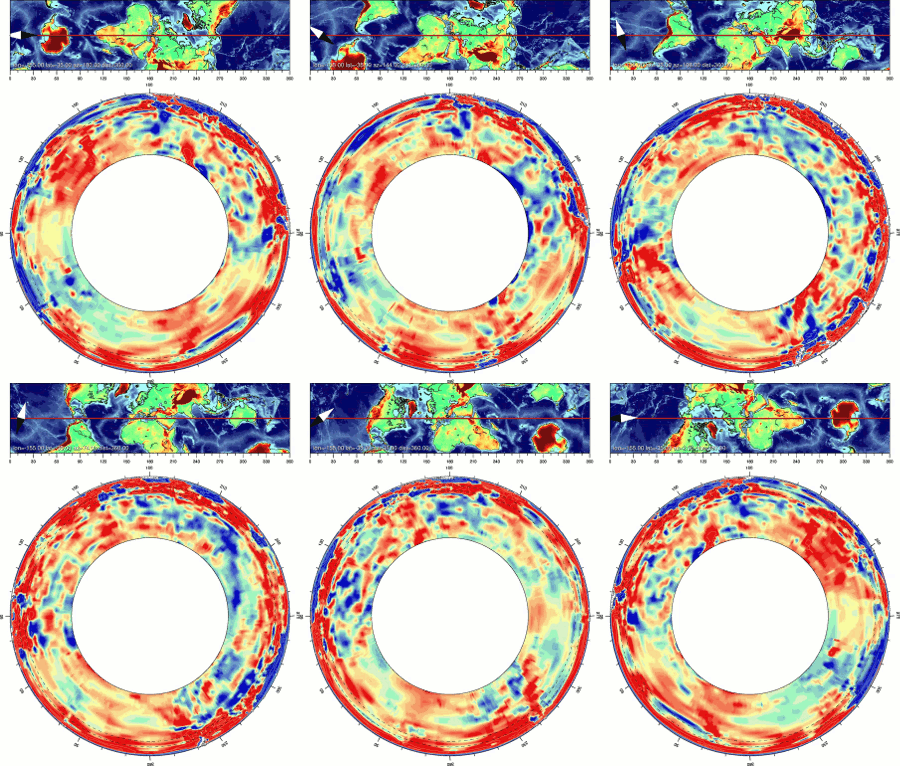
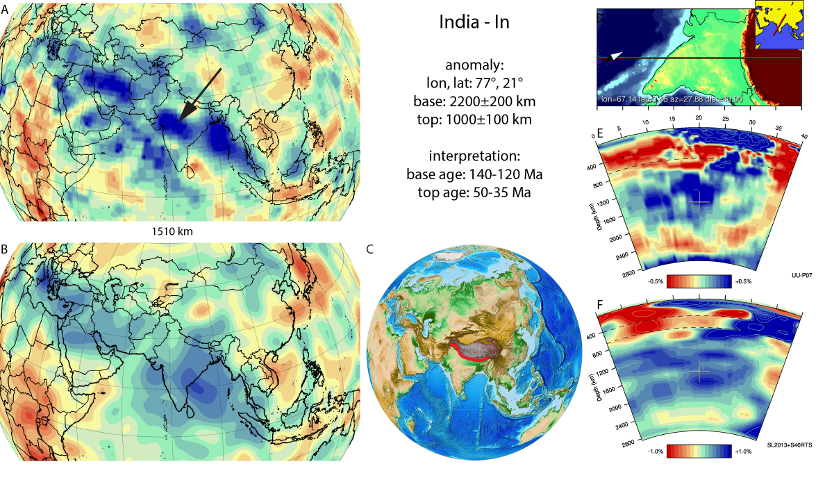
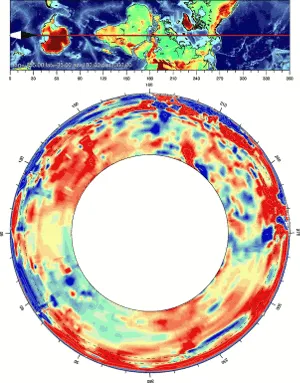
The Atlas of the underworld is the first complete map of Earth’s mantle and the evolution of the tectonic plates over the last 300 million years. The Atlas is the result of a 17-year effort by a team of researchers from the Utrecht University, who published their research in the journal Tectonophysics.

Mapping the Earth’s Underworld

“Now we can trace not only how plates move over the surface, but how they sink to the core-mantle boundary,” That’s the cool thing for me—we can learn about the physics inside the Earth. You may think that plates that sink deep into the mantle just melt—but in fact, they stick around for a long time and can sink as deep as 3,000 kilometers [1,860 miles]” – Douwe van Hinsbergen from the University of Utrecht in the Netherlands to Gizmodo.

Scientists mapped the earth’s underworld into various tectonic slabs using seismic tomography. Thankfully, all the data behind “Atlas of the underworld” is openly accessible, and in the portal, researchers have categorised images of the tectonic slabs according to their name, age, depth and location. If you are interested in viewing the different tectonic plates by location – here’s the link to the map.

Say thanks for this article (0)
The community is supported by:
Become a sponsor
#Ideas
#Contributing Writers #Fun #Ideas
Exploring New Geospatial Features on Google Maps
Sebastian Walczak 09.3.2024
AWESOME 2
#Business #Fun #Ideas #People
History of GIS | Top 6 Figures in GIS and Geospatial
Nikita Marwaha Kraetzig 08.12.2024
AWESOME 2
#Fun #Ideas #People
‘You Are #Geoawesome’ Original Series: A Step-by-Step Guide
Sebastian Walczak 10.9.2024
AWESOME 0
Next article
#Business

Dive into USGS’ massive database of seafloor photos, ‘Street View’ style

Over the past several decades, the US Geological Survey (USGS) has collected thousands of photographs and amassed hundreds of video hours capturing the country’s seafloor. From coastal California and Massachusetts to segments of the Gulf of Mexico and mid-Atlantic coasts, its treasure trove of data contains 100,000 photos and 1,000 hours of videos spanning around 3,200 kilometers of the US coastline.

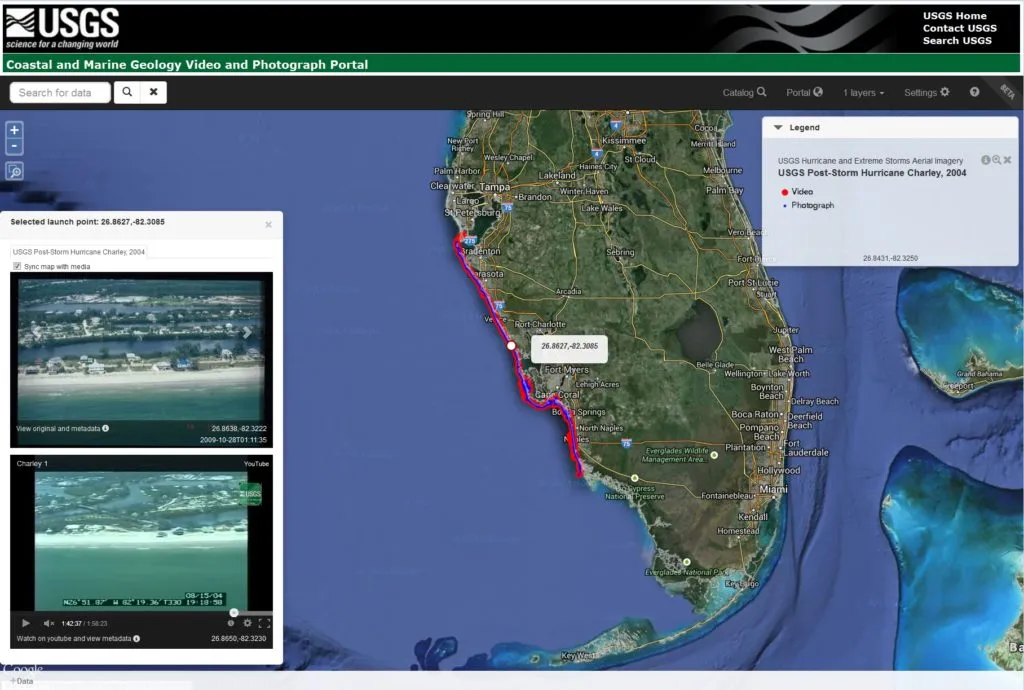
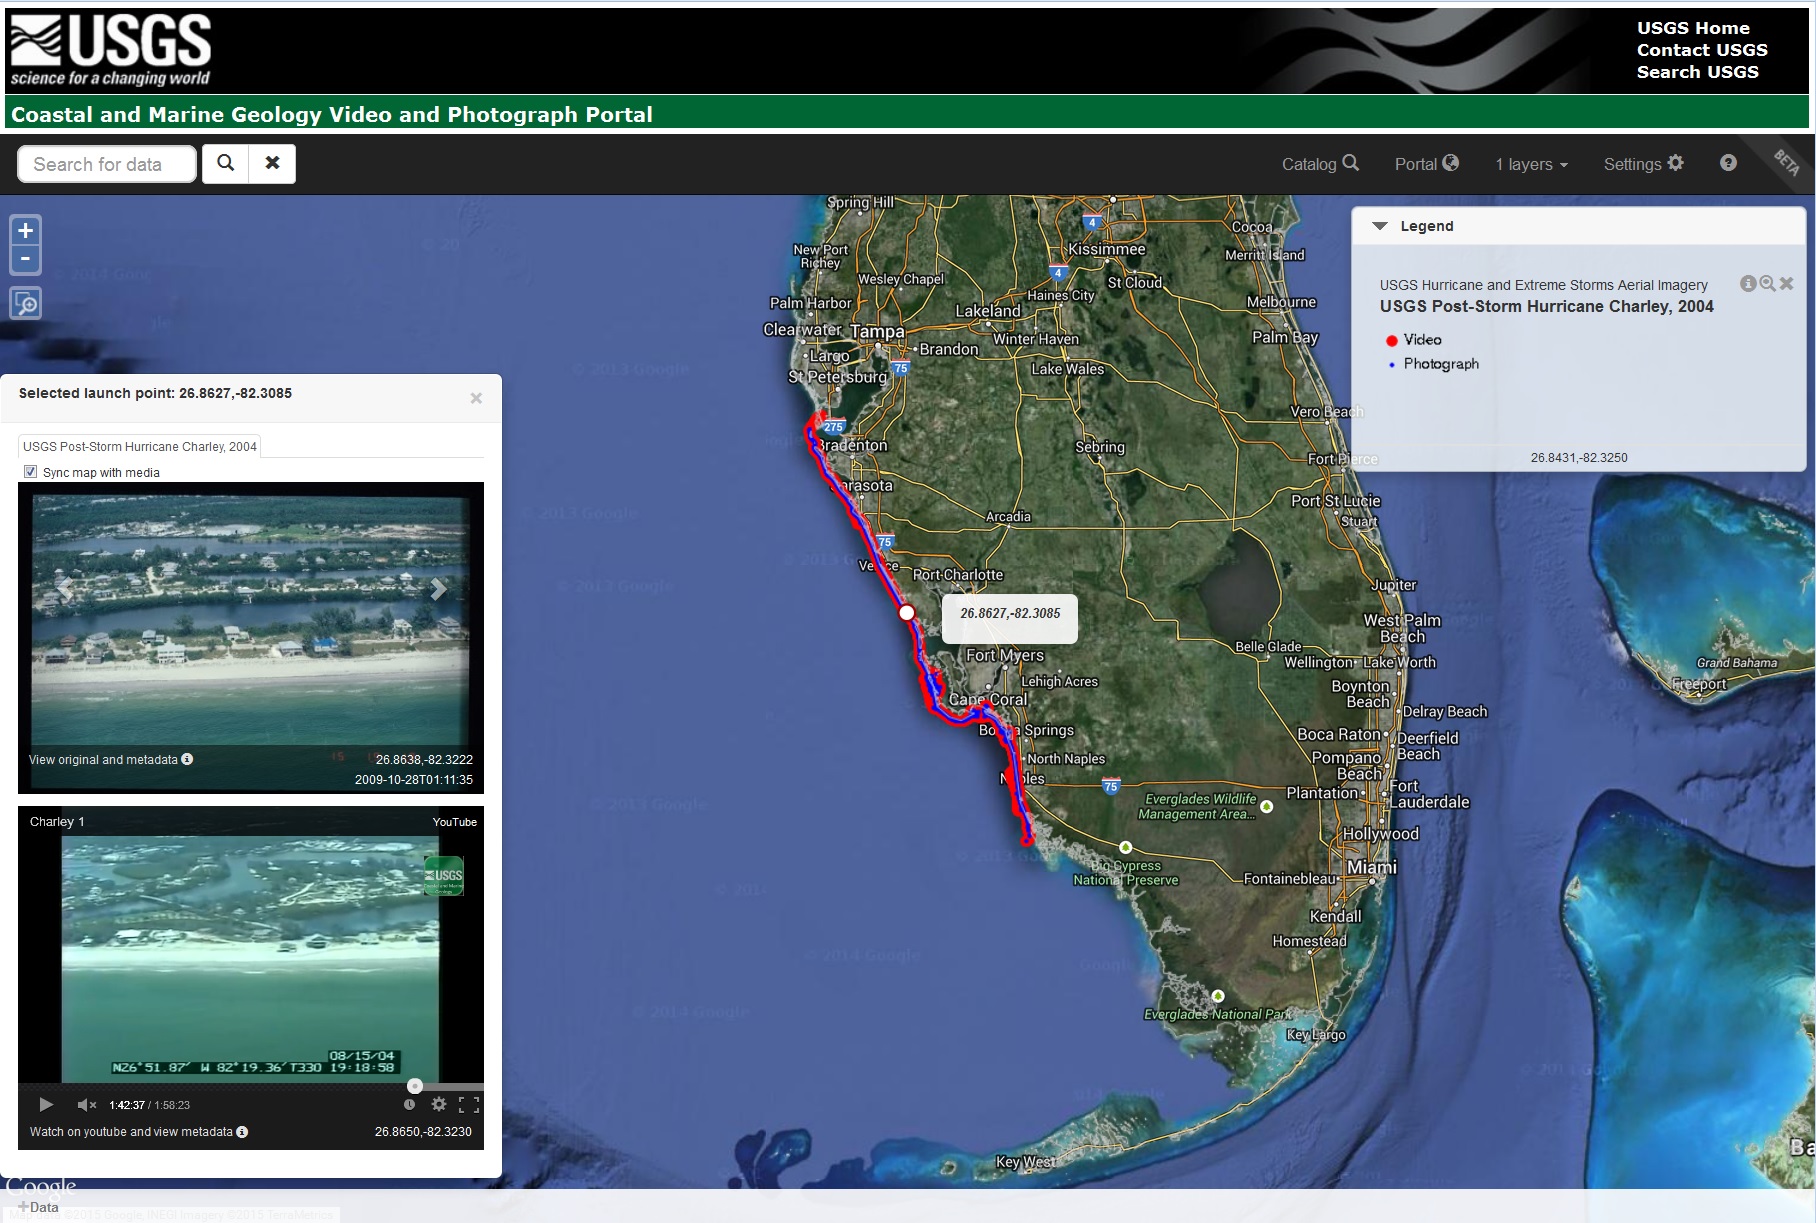
Since these underwater and aerial datasets were collected as part of the Coastal and Marine Geology Program Seafloor Mapping projects and Hurricane and Extreme Storm research, for the longest time, only a few of these imageries and videos were publicly accessible. The scientific agency changed that by compiling its rich archive into the Coastal and Marine Geology Program Video and Photograph Portal.

This easy-to-use, interactive portal gives you a Google Street View-style look into the rich geography of the US, with a choice between a satellite-view and basic black and white basemap. The areas available to browse right now include the Pacific, Atlantic, and the Gulf Coast, with special features on Hawaii, Washington State’s Puget Sound, and the Arctic, Puerto Rico, and mid-Atlantic Coast.

Zoom into an area of your interest and you will see lines where continuous video footage has been taken. The dots represent still photographs. If you click on a segment, the video will launch in a pop-up window, with pictures appearing alongside. If you want to explore the data quickly, simply hover the mouse cursor over any of these lines or dots representing the video or imagery, and you will see a pop-up preview of that data. All datasets include basic information, such as the lat-long, data and time of that photo or video. We recommend you click here to dive right in!

Read on
Search