#Business

How accurate is the altimeter in a GPS watch?
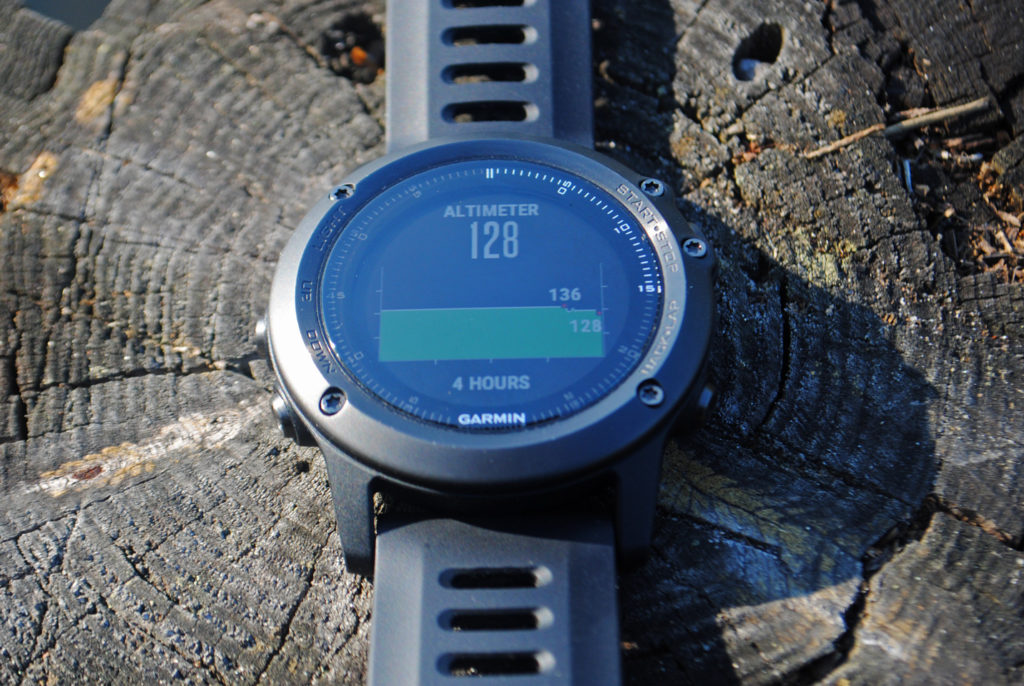
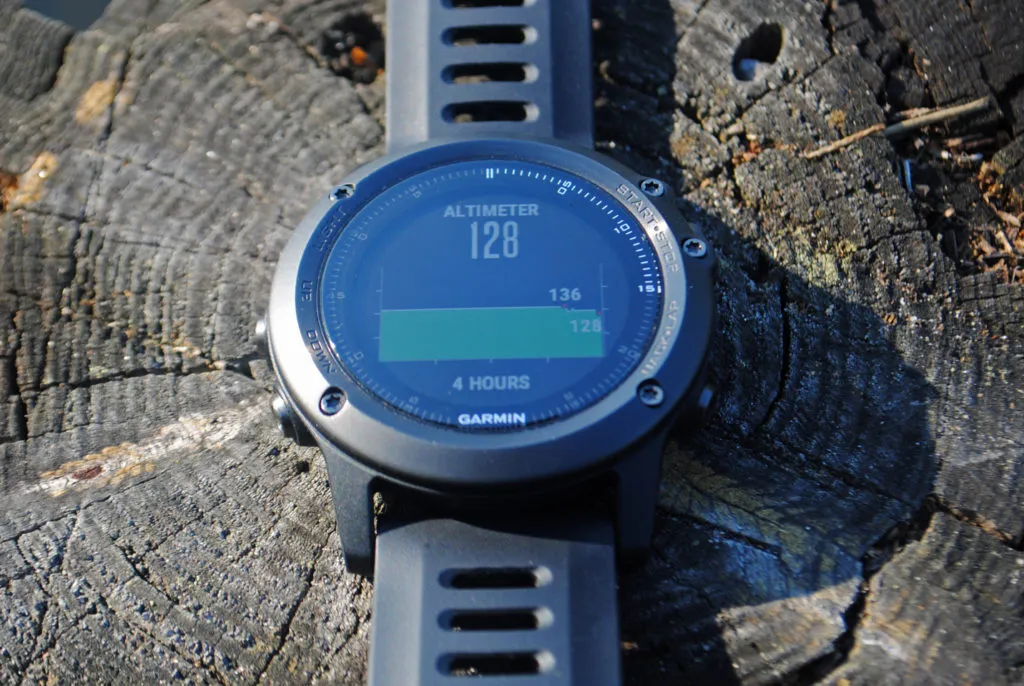
If you’re an outdoorsy person, you’d know there are quite a few sports like hiking, climbing, skiing, and skydiving, where knowing the altitude or the elevation of a place not only satisfies your inherent curiosity, it is, in fact, imperative for your safety.

If you’re an outdoorsy person who likes these sports, chances are you own a GPS watch with a built-in altimeter – an instrument that measures your height above a fixed level, usually adjusted for the mean sea level.

If you’re an outdoorsy person who likes these sports and owns a GPS watch with a built-in altimeter, there has probably been a time when you’ve seen the device giving you some pretty erratic altitude data. Ever wondered why? To figure this out, you first need to understand how an altimeter watch works.

Traditional altimeter watches

Traditional altimeter watches use atmospheric pressure as a gauge to measure and track changes in the altitude – just like a barometer. The atmospheric pressure is greatest near the earth’s surface because gravity pulls everything, even air molecules, toward it. As you go up, the pressure starts to decrease, and the altimeter compares this new pressure to the previously-known sea level to determine your height.

But altitude is not the only factor that causes variations in pressure; weather changes do too (high temperature = pressure drop, and vice versa). So, to get an accurate reading, a traditional barometric altimeter watch would need to be calibrated almost on a daily basis to match the known reference height. This can easily be done using Google Earth: Just search for your exact location and note down the elevation mentioned at the bottom of the page.

GPS-based altimeter watches

On the other hand, an altimeter that uses the Global Positioning System to determine the altitude draws on the signals from GPS satellites (and sometimes GLONASS), pretty much in the same manner as positioning technology. While a GPS receiver needs to triangulate signals from three or more satellites to pinpoint its exact position, signals from at least four satellites are essential to calculate the elevation. And to achieve any kind of reasonable accuracy, at least one of these satellites need to be directly overhead the receiver.

Though this condition is not exactly hard to fulfill with 31 functional GPS satellites orbiting the Earth right now, discrepancies crop up because the speed at which radio waves travel gets affected by the variations in the density of the ionosphere. The general rule of the thumb is that vertical error is three times the horizontal error. If a decent signal reception is available, a modern GPS receiver should be able to give elevation data accurate to a range of 10 to 20 meters (35 to 70 feet) post correction.

And that’s exactly where the problem with GPS-based altimeter watches meant for the great outdoors lies. The GPS reception isn’t always terrific and hikers have reportedly found the altitude measurements to be off by as much as 400 feet!

Garmin confirms this, explaining that the main source of error has to do with the arrangement of the satellite configurations during fix determinations. “The earth blocks out satellites needed to get a good quality vertical measurement. Once the vertical datum is taken into account, the accuracy permitted by geometry considerations remains less than that of horizontal positions.” As such, the values provided by GPS-based altimeters should be used with caution when navigating.

So, while it’s obvious that both systems have their pros and cons, if you’re looking for an accurate elevation data (and a way to ensure you don’t get caught in a white-out storm), you would be better off if your GPS watch uses a barometric altimeter as a system of checks and balances.

Say thanks for this article (6)
The community is supported by:
Become a sponsor
#Business
#Business #Featured
Call for nominations: Global Top 100 Geospatial Companies 2025 Edition
Avatar for Muthukumar Kumar
Muthukumar Kumar 10.1.2024
AWESOME 1
#Business #Featured
Global Top 100 Geospatial Companies – 2024 Edition
Avatar for Muthukumar Kumar
Muthukumar Kumar 01.31.2024
AWESOME 10
#Business #Featured #GeoDev
Geo Addressing Decoded Part 2: Beyond Coordinates – Exploring the Depth and Impact of Geo Addressing
Aleks Buczkowski 05.2.2024
AWESOME 4
Next article
#Ideas

Serving Spatial Realness à la RuPaul: Season 9 Finale Edition


Pride month may be over but I’m still reminiscing on the highs, lows, sashays, and death drops. In the past, I always looked forward to the marches as a way to experience the diversity, vibrancy, and pride of the LGBTQI (and whatever new letters have been added) community in all its glittery glory. Perhaps because I now live in Buenos Aires which celebrates pride in November, or maybe because we live in the in the global, meme-able world of 2017, this June I found the brightest beacon of the charisma, uniqueness, nerve, and talent of all the colors in the gay rainbow to be the RuPaul’s Drag Race season 9 finale. That and Babadook.

For many, the finale of RuPaul’s Drag Race this June 23rd may have looked like the Superbowl half time show, but for the fans it was the real gayme. Just like the Superbowl, the season 9 finale was the most trending program on all of television at its airtime. Given this, I will be giving it a proper play-by-play, analyzing of the key moments, and generally serving map and data viz realness. There will be lots of pretty pictures so try not to sashay away.

U.S., Mexico, & Carribean Tweet Density

Based on the density map, the U.S. and Brazil are the world’s biggest Drag Race fanatics, at least during the Season 9 finale. New York, Los Angeles, Chicago, Washington D.C., Boston, Houston, Orlando, and somewhere in upstate New York are the United States’ top tweeters. In South America Santiago de Chile, São Paulo, Rio de Janeiro, and Brazil as a whole sent some serious social media love. Some cities in Western Europe, especially in the U.K. and Spain, also seemed to enjoy Drag Race, with a little over six hundred tweets coming from the region as a whole. But they were not on the same level as the U.S. or Brazil.

South America Shows Drag Race Some Twitter Love
Western European RuPaul’s Drag Race Fandom

Just like sports teams, drag queens’ supporters are divided based on geography, with hometown pride being an important factor. Sasha Velour hails from Brooklyn, New York and her biggest supporters are stationed in São Paulo (45), Rio de Janeiro (43), Santiago (39), Brazil (38), and Brasil (37) and unleashed 3.5k tweets, over three times that of the runner up, from Franca, SP, Brazil (16), Manhattan (15), Barra Mansa, Brazil (13), and Natal, Brazil (9).

Chicagoan Shea Couleé’s army is based in Curitiba, Brazil (39), Chicago (18), Brazil (14), São Paulo (13), and Brasil (13) and sent off 920 tweets primarily from Chicago (6), Natal (4), Arhus (3), and Manhattan (3) during the hour-long season culmination.

Peppermint is a New Yorker with a strong following in in Nebraska (25), United States (16), Houston (13), New York, NY (13), and São Paulo (11), firing 900 tweets from Manhattan (8), Houston (4), Arhus (3), and Columbus, OH, USA (3) the night of the finale.

Pageant queen Trinity is from Orlando, Florida and her team is based in São Bernardo Do Campo, SP, Brazil (40), São Paulo (15), Brasil (14), Brazil (9), and Chicago (9) tweeting 796 times from Chicago (3), São Paulo (2), Queens (2), and Não-Me-Toque, Brazil (2).

And now for a proper play-by-play of some of the more important moments of the gayme that required an instant replay. Because scrolling is hard I’ve copied the video above.

Because #TeamSasha tweets dominated the night, the overall tweet timeline mimics that of her followers. Logically, #teamSasha tweets spike during her interview and her lip syncs and crowning.

Perhaps the most magical moment of the night, Sasha Velour’s iconic revealing rose rain. Seriously, how many emojis did this movement spark? In any case, the maneuver gave her eight times the tweets of her competitor in that moment.

#teamShea tweets were most even throughout the program even after her elimination.

During Shea’s interview, #teamSasha tweets were booted from the top spot; the only time this happens, except Peppermint and Trinity’s lip sync.

#teamPeppermint tweets spike during both her first and second lip syncs.

#teamTrinity tweets peak at various points throughout the competition, most notably her interview and lip sync.

Even though many feel Trinity out-performed Peppermint during her lip sync, atleast until Pepper’s reveal, #teamPeppermint still had more tweets during this time.

World Drag Race Tweet Density Map

Overall, it seems the most drag-crazy cities this season finale are São Paulo, Chicago, and New York, followed by Los Angeles, Rio de Janeiro, Orlando, Houston, Washington D.C., Boston, and Santiago de Chile, not necessarily in that order. Orlando likely made the list because it is Trinity’s stomping (or prancing) ground. Yet, in the case of New York and Chicago, it is more of a chicken and the egg situation where major metropolises produce talented queens and large viewing populations, who then inspire hometown pride. The fact that Brazil is just as or perhaps more RuPaul’s Drag Race-obsessed than even ‘Muricah despite having no representation on the show and a linguistic barrier is something that would have even RuPaul gagging. Maybe since the release of Alaska’s “Come to Brazil” song, the Brazilian LGBTQI community felt like they had a reputation to uphold.

Regardless of the team you play for or where you come from, hopefully we can agree that Drag Race, as the name implies, is just as much a high-octane sport as NASCAR. And, just like the Daytona 500, Superbowl, or the World Cup, you can clock key moments when someone snatched the crown, the game, or was simply snatched on a map.

Were you #teamSasha, #teamShea, #teamPeppermint, or #teamTrinity?

Read on
Search