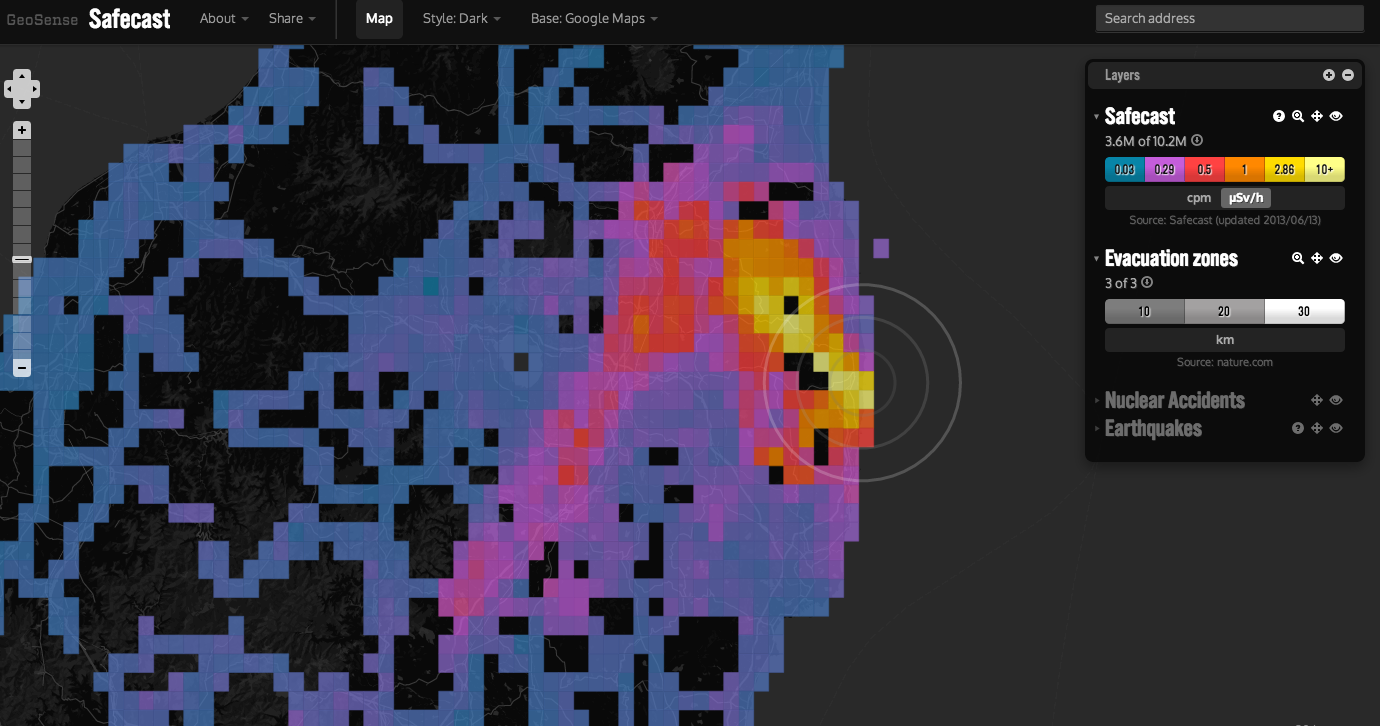
 Safecast have implemented Volunteered Geographic Information (VGI), where the Japanese public have been able to create, edit and uploaded content to provide online information regarding radiation levels due to the major leak at Fukushima. This method is commonly know as locational crowd sourcing, whereby members of the public undertake tasks that are normally done by professionals. Nevertheless, this type of data has been criticized owing to the fact it may not be consistent or to the required standard of regulating authorities. Additionally uploaded data may not be anonymised, raising concerns about being able to identify participants. However, owing to the fact that people are volunteering information they should be well aware of the risks, and may be more willing to contribute if data can be assigned to their username to gain awards such as the online site Wikimapia and Open Street Map. Both these sites are open editable maps, which anyone can access, edit and add geographic data to.
The March 2011 radiation leak at Fukushima Daiichi nuclear plant in Japan provides a prime example of the contested nature embedded in VGI data. Initial reports suggested that the Japanese Government withheld radiation information from the public and were not sufficiently monitoring radiation. Consequently the voluntary organisation Safecast distributed mobile radiation detectors to provide the public with the required information and a year after the event over 3 million data points had been collected. The attempt by Safecast to distribute the data may well have saved millions of lives and the global community should recognise what impact they have had. Safecast have now developed their own Geiger counter to distribute in Japan and the World. However, the Japanese Government does not consider non-government readings to be authentic and urged the public to only rely on government readings. Yet the Japanese Government failed to implement appropriate exclusion zones. Safecast found that in a voluntary exclusion zone there was the equivalent of 6 chest x-rays every day. The police officers patrolling the boarder of the exclusion zone have been informed they are safe, yet Safecast data provides cause for concern. This raises a big dilemma for Japanese citizens, either they listen to their Government who say they are safe, or to Safecast, who provide data to suggest otherwise.
The obvious issue in this situation is the lack of Government data distribution, thus meaning the public had to rely on Safecast’s map.
In this situation Safecast provided a lifeline for the citizens of Japan and it showcased the potential power of web VGI. If a similar situation is to arise in the future VGI may play a big role in disaster alleviation.


