#Science

With ArcGIS Maps for Adobe you can finally style your maps in Photoshop and Illustrator without any hassle

Making beautiful maps is a difficult task. Online geoviz platforms like Mapbox, CartoDB or ArcGIS Online are cool for interactive visualisations but sometimes you just need to quickly make a great looking static map. Normally you prepare the data in any GIS software that most likely has advanced spatial analysis tools but very poor visualisation capabilities. So in order to style it you need export you map to Adobe Photoshop or Illustrator. The problem is that the process is a real hassle. Typically you would get your data cut into strips with messed labels and layers. There are some tricks to make it work but it’s a frustrating and time-consuming.

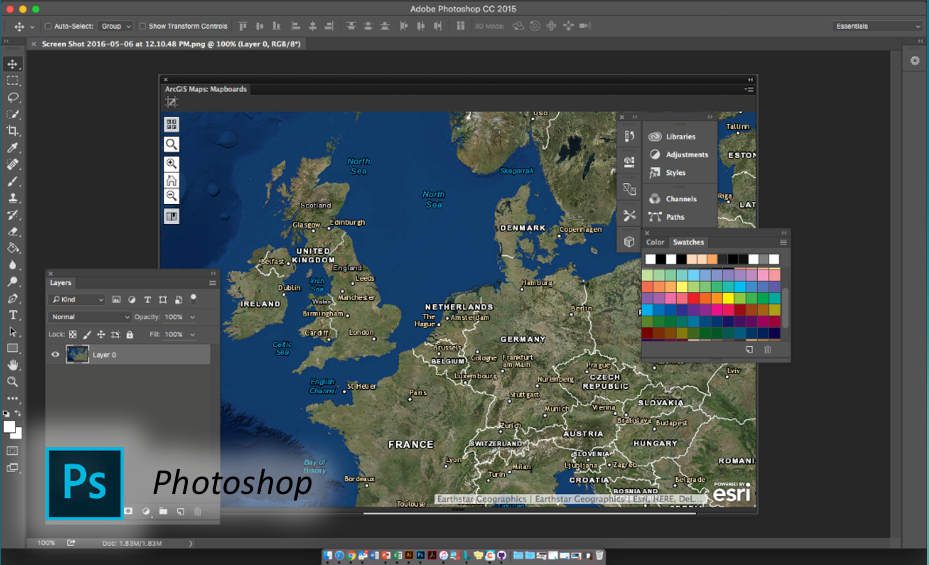
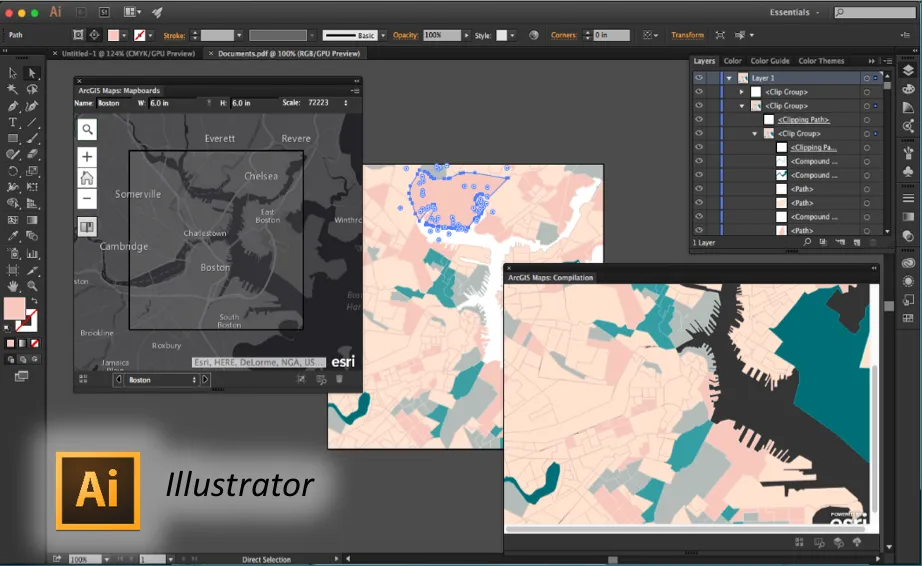
Today Esri announced something that will make all cartographers and map designers happy – ArcGIS Maps for Adobe Creative Cloud Beta. It is an extension for Adobe design environment where users can download their ArcGIS Online maps directly to Photoshop and Illustrator. You just sign in to your Esri account and download any map or data layer as a vector or high-resolution image. It’s still in beta so a lot of things might change and Esri is counting on your feedback. You can sign in for the trial program here.

Frankly speaking it’s a great news and I’ve been waiting for it for years!
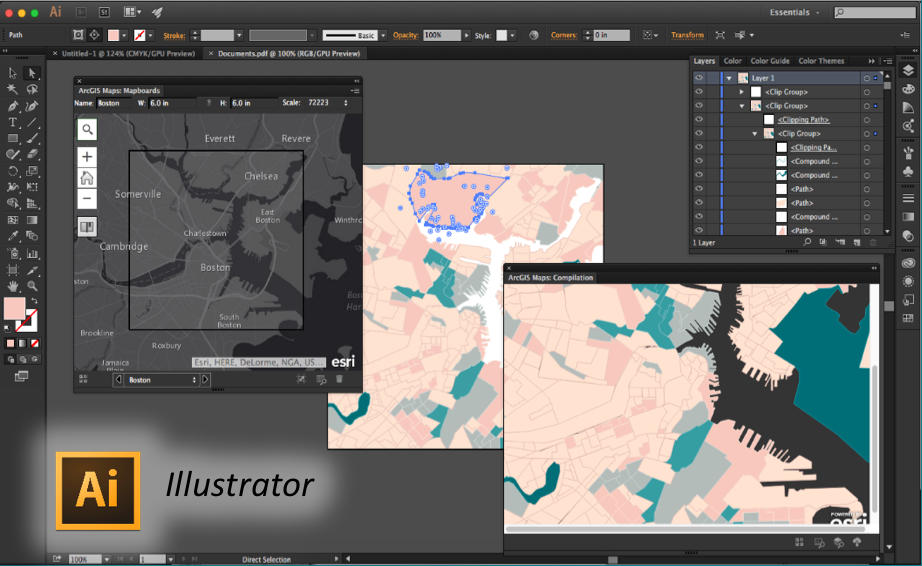
ArcGIS-Maps-4-Adobe-Creative-Cloud-Overview-Illustrator-Logo

ArcGIS-Maps-4-Adobe-Creative-Cloud-Overview-PhotoShop-Logo1

Say thanks for this article (0)
The community is supported by:
Become a sponsor
#Science
#Environment #Fun #Satellites #Science
Simple Raster Analysis: Detection of Landslide Zones
Sebastian Walczak 08.20.2024
AWESOME 1
#Contributing Writers #Fun #Science
From Artistic Works of Art to Modern Digital Maps
Sebastian Walczak & Nikita Marwaha Kraetzig 07.7.2024
AWESOME 1
#Satellites #Science
Exploring Earth’s Displacements using InSAR data
Sebastian Walczak 03.28.2024
AWESOME 2
Next article
#GeoDev #Ideas

What’s trending on OpenStreetMap?

Ever wanted to know what’s trending on OpenStreetMap? Looks like there is an easy way to find out the answer to that question! Researchers at the Geometa lab at the HSR University of Applied Sciences have an experimental bot project “Trending Places in OpenStreetMap” that is analysing the views on OSM tiles and verifying which ones are gaining in popularity due to a hike in interest, thereby determining the “Trending Places”.

What is a Trending Place?

Places that have unusually higher views than their normal views, implying that places like tourist hot spots are not trending unless there is an increase in the number of views from the average. – Geometa Lab Webpage

The bot also tweets out the most trending places (with a two day delay). The top 10 most trending place on 26th June –

Trending Place in OpenStreetMap is definitely a #GeoGeek’s project but what is interesting is that already they have been able to link trends on the map to actual events on ground e.g. 04th May this year, Fort McMurray, Canada was trending on OSM and was the victim of wildfire in the beginning of May 2016.

P.S: The Matlab style plots are perhaps too geeky for the general public… and considering all the awesome work behind the project, it would be really cool if the community can help, with maybe creating a heat map of the trending places 😉 The entire project is licensed under MIT License.

More information

If you are interested in taking a look at the code behind the project – here’s the link to the GitHub page. If you’d rather first read more about the terminology and the current challenges of the project – here’s the link to the project website.

“Trending Places on OpenStreetMap” #Geoawesomeness 🙂

Read on
Search