
Cities are often described as collections of buildings, roads, and green spaces. In practice, they function through connections. What matters is not only where things are, but how they depend on each other.
This became clear during the 2003 North American Blackout. A surge in electricity demand on a hot day in Ohio caused power lines to sag into trees, triggering a chain reaction across the grid. Within minutes, roughly 50 million people across the United States and Canada lost power, not because of a single failure, but because the network itself amplified it.
Events like this are hard to reason about with maps alone. Geospatial graphs model places as nodes and connections as edges, making it possible to analyze flow, dependency, and vulnerability across entire systems. This article introduces geospatial graphs from a practical perspective for practitioners who want to move beyond geometry and understand cities as networks.
What Is a Graph?
- In computer science, it is a simple way to describe relationships. At its core, a graph has only two elements: Nodes (or vertices) represent entities or locations within the network. In a city, a node could be a street intersection, a bus stop, a power substation, or even an entire building.
- Edges (the links) link the nodes together. They represent relationships or paths, such as road segments, water pipes, rail lines, or fiber-optic cables, following the basic ideas of graph theory definitions commonly used in network analysis.
If this sounds abstract, think of a family tree or your LinkedIn network. You are a node, and your connection to another person is an edge. Cities work the same way, just at a much larger scale.
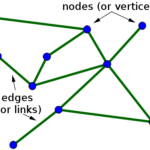
Source: Math Insight
Why Maps Alone Are Not Enough?
Traditional maps, whether paper maps or the navigation app on your dashboard, are built on Euclidean space. They focus on exact coordinates, precise geometry, and straight-line distances.
Cities and people, however, do not operate this way. We rely much more on topological thinking, which focuses on how elements are connected rather than their exact shape or distance. When navigating a city, it often matters less how long or curved a road is and more whether it connects two places at all.
This distinction between geometry and topology underpins how maps and graphs differ. Geometric representations preserve shape and distance, while topological ones preserve connectivity, an idea commonly discussed in comparisons of geometrical versus topological space.
Transit maps make this difference obvious. Metro and subway diagrams deliberately distort geography so that connections between stations and lines are easy to understand. Stations that are far apart in reality may appear close together, while others are stretched apart, because the goal is not geographic accuracy but clarity of movement.
For cities, the key question is often not how far Point A is from Point B, but whether a viable path exists between them and how that path interacts with the rest of the system.
Where Graphs Already Exist in Geospatial Data?
Graphs already underpin many geospatial systems, even if they are not always described that way. River networks, road systems, logistics chains, and urban infrastructure all rely on connected structures rather than isolated spatial objects.
This becomes clear when looking at recent research on applications of graph theory in geospatial analysis, which brings together examples ranging from hydrological modeling and transportation networks to digital twins and urban infrastructure systems. Across these domains, graphs are used to represent flow, dependency, and vulnerability in ways that traditional geometric representations struggle to capture.
The key takeaway is that graphs are not a niche abstraction. They already sit at the core of many geospatial workflows, providing a common language for understanding how complex spatial systems behave as a whole.
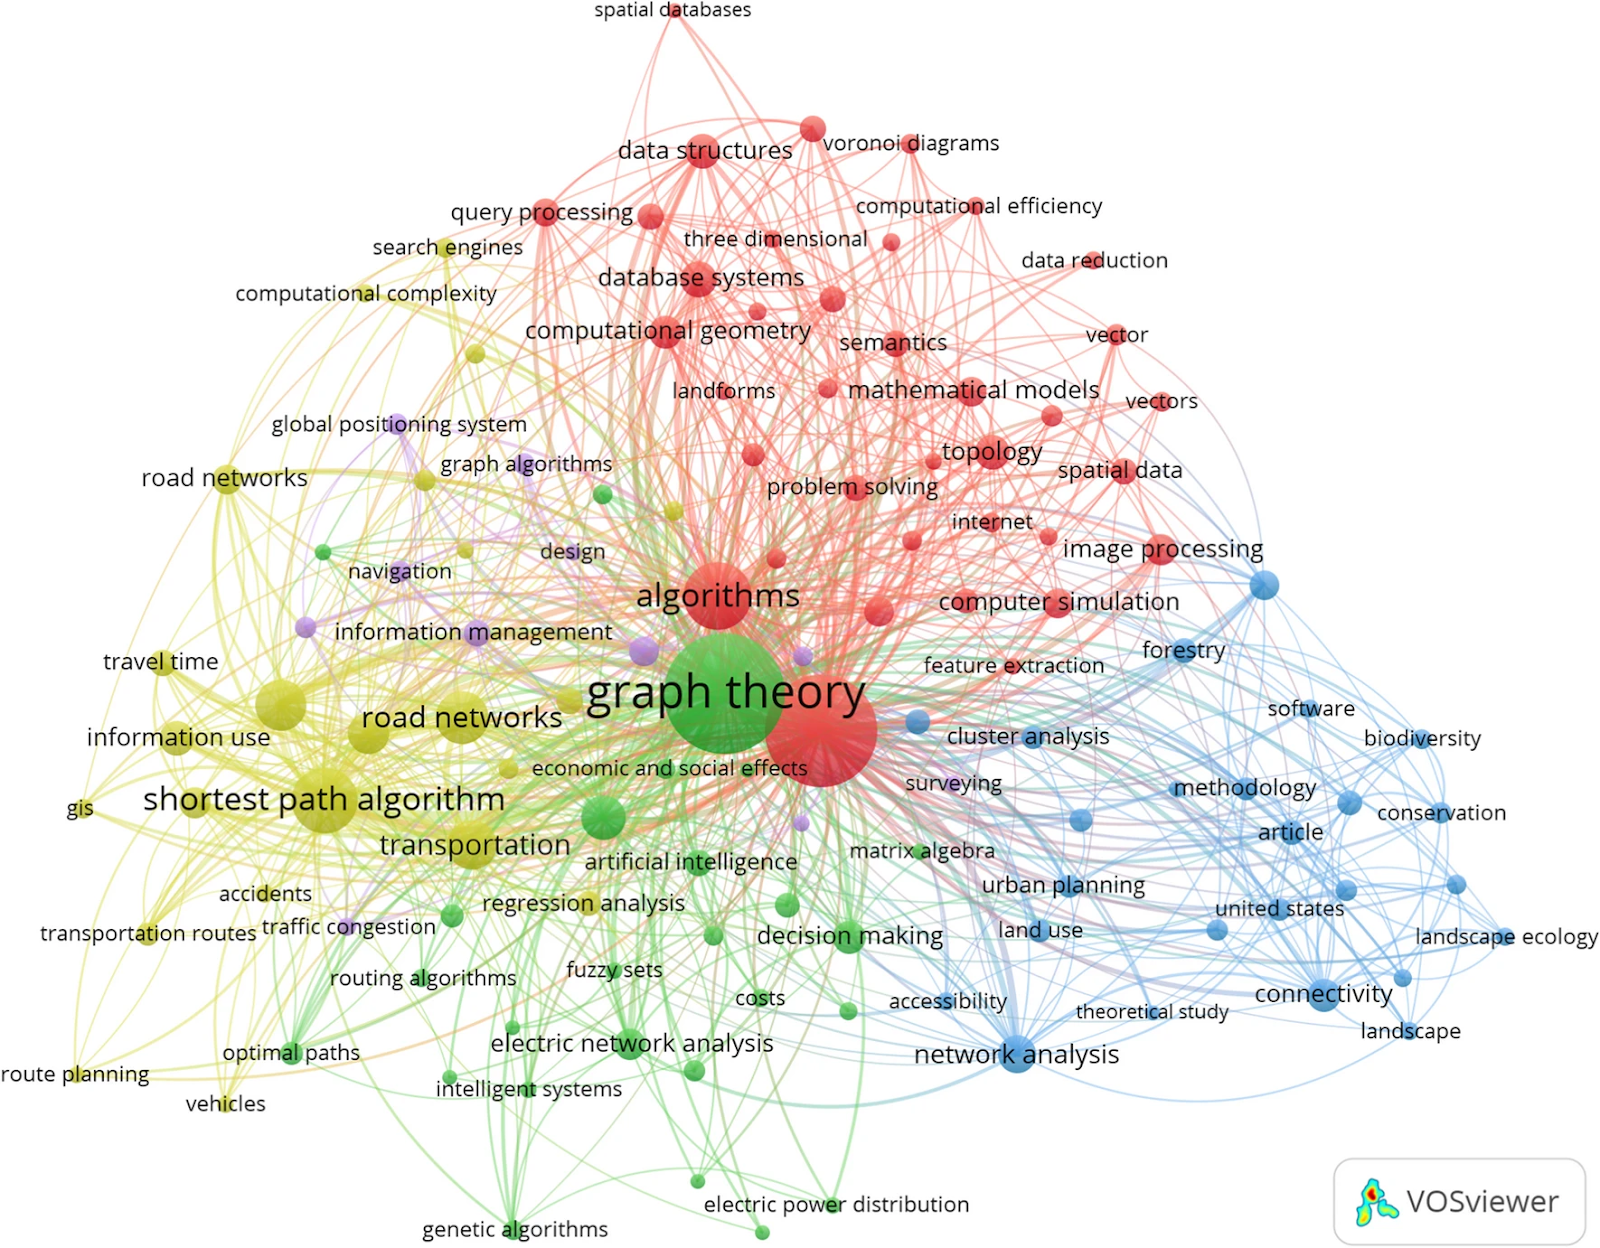
Graph theory applications for advanced geospatial modelling and decision-making. Source: Springer
What Becomes Possible With Graph Thinking?
Once a map is converted into a graph, you can start asking questions that are difficult or impossible to answer with geometry alone. One of the most useful ideas here is centrality, which helps identify which parts of a city matter most for keeping the whole system functioning.
A particularly powerful measure is betweenness centrality. It captures how often a node, such as a road intersection or transfer station, lies on the shortest paths between other parts of the network. An intersection with high betweenness centrality acts as a bridge, connecting otherwise distant areas of the city.
If such a node is blocked or fails, the impact is rarely local. Because so many routes depend on it, disruption spreads quickly across the network, leading to congestion, delays, or even system-wide breakdowns. This way of reasoning about importance and vulnerability is central to how network analysts interpret urban systems, as described in practical explanations of betweenness centrality and related centrality measures used in network analysis.
Practical Example: A City District as a Graph
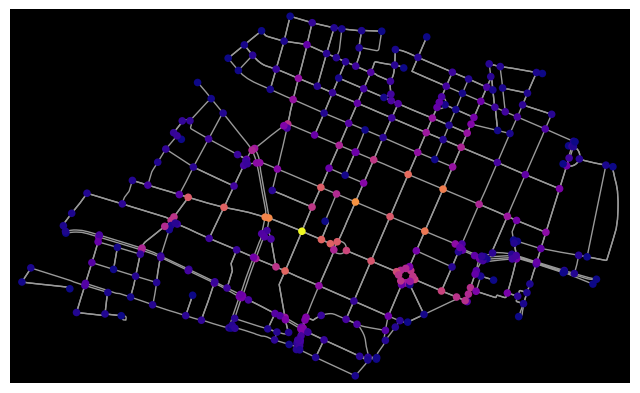
Using a Python library called OSMnx, you can turn any city district into a graph in just a few lines of code. In this example, the street network of Maxvorstadt in Munich is downloaded from OpenStreetMap. Intersections are treated as nodes, and road segments as edges.
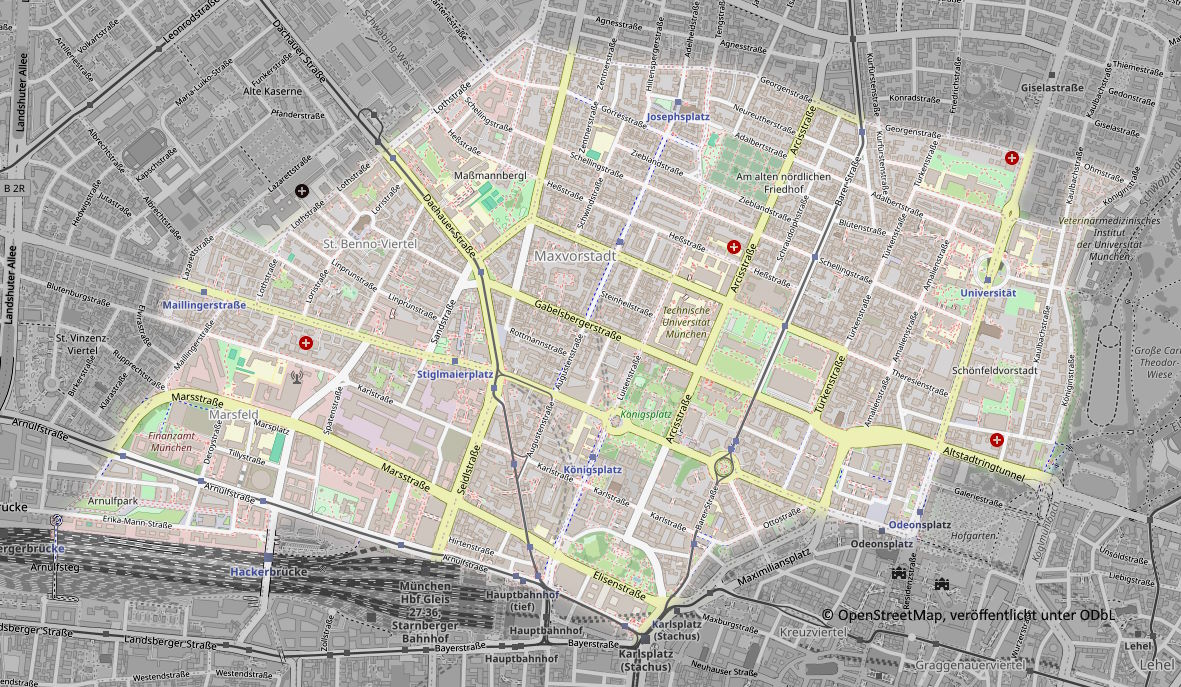
Maxvorstadt District Map. Source: Bei uns in München
OSMnx automatically estimates travel speeds and travel times for each road segment using OpenStreetMap tags. This allows the graph to represent how traffic actually flows through the street network, including the effects of one-way streets and different road types, rather than relying only on geometric distance. The key step is computing betweennesas centrality, which highlights intersections that act as bridges for movement across the district.
You can replace the district name with any neighborhood you know. Running this at the district scale keeps the analysis fast, while still revealing which small parts of the network quietly carry the most importance.
In the output visualization, most intersections appear in dark blue, indicating low centrality, while a small number stand out in warmer tones like yellow and orange. These highly central nodes account for a disproportionate share of movement across the district, acting as critical bridges in the network.
Why This Matters for Real Decisions?
Graph thinking is already influencing real-world planning decisions. For example, in Astana, where rapid urban growth is expected to push the population toward 2.5 million by 2035, planners used graph-based analysis to understand how traffic and accessibility were distributed across the road network.
By examining measures such as traffic polarity and network connectivity, they identified districts that were becoming overly dependent on a small number of critical routes. These areas were especially vulnerable to congestion and disruptions. Instead of expanding roads everywhere, planners focused on targeted changes that improved the structure of the network itself.
The resulting interventions included adding new through-streets to break up oversized blocks, relocating logistics centers outside the city ring road to reduce heavy vehicle traffic in the core, and increasing overall road density to introduce redundancy. The Astana case shows how graph-based reasoning can move beyond diagnosis and directly guide resilient infrastructure design.
How Graphs Connect to Modern Geospatial AI?
Graph Neural Networks (GNNs) extend graph thinking into modern geospatial AI. Instead of treating roads, sensors, or intersections as isolated features, these models learn directly from the structure of the network, capturing how activity and disruptions propagate through connected systems.
Recent work on UAV and ground-sensor graph models for urban prediction demonstrates this shift. By feeding real-time data from drones and ground sensors into a city-scale graph, the model learns relationships between different parts of the network. This makes it possible to anticipate downstream effects, such as how an incident on a highway can translate into delays on specific bus routes minutes before they occur.
This approach matters because it aligns AI with how cities actually function: not as collections of points, but as interconnected systems where local events can trigger city-wide consequences.
Limitations
Graphs are powerful, but they come with important caveats.
Reporting bias is a major issue when graphs are built from complaint or service data. For example, studies using NYC 311 service requests show that wealthier neighborhoods often appear to have more problems simply because residents report issues more frequently, not because infrastructure is objectively worse.
Messy data is another challenge. Geospatial graphs often combine multiple datasets with inconsistent identifiers, naming conventions, or missing links. Problems like entity resolution and schema mismatches are well documented in discussions on data quality in network analysis and can easily lead to disconnected or misleading graphs.
Finally, there is the snapshot problem. Cities change continuously, while most graphs represent a single moment in time. Updating graphs dynamically remains difficult at scale, a limitation highlighted in research on dynamic and temporal graphs used for evolving systems.
Maps remain essential for understanding where things are in space. But to understand how a city moves, adapts, and sometimes fails, connections matter more than coordinates. Graphs make those connections explicit, revealing how local decisions can trigger city-wide consequences.
As cities generate more real-time data and geospatial AI continues to evolve, graph-based approaches will play an increasingly central role. Future research is moving toward dynamic graphs, graph-based learning, and hybrid models that combine geometry with network structure. These directions promise not just better predictions, but better questions about resilience, accessibility, and equity.
Seeing cities as graphs does not replace maps. It complements them. Together, they offer a way to design urban systems that are not only larger or faster, but also more robust and better prepared for the challenges ahead.
Further Resources
- https://arxiv.org/abs/2405.07664
- https://www.youtube.com/watch?v=-fs8ozxKklQ
- https://graphwise.ai/blog/geoai-how-graphrag-unlocks-complex-geospatial-knowledge/
How do you like this article? Read more and subscribe to our monthly newsletter!


#Contributing Writers

Next article

This article is part of the “Tech for Earth” series exploring the intersection of technology, sustainability, and planetary intelligence.
As we enter 2026, satellite and space technologies have moved from specialized scientific tools to essential infrastructure underpinning the global economy. Recent developments from December 2025 and early January 2026 show how Earth observation data has become central to decision-making across industries, from agriculture and urban planning to climate response and disaster management.
New Satellite Missions and Global High-Precision Monitoring
The final months of 2025 saw the launch and activation of several satellite missions. On December 16, 2025, the Copernicus Sentinel-6B delivered its first altimeter images, tracking sea-level variations in the North Atlantic with ultra-precision. Currently flying just 30 seconds behind its twin, Sentinel-6 Michael Freilich, the satellite has entered a “tandem phase” to allow for precise cross-calibration of sea-level measurements to within a fraction of a millimeter. This mission serves as the “gold-standard” reference for monitoring global sea-level rise, which is currently averaging 4.3 millimeters per year.
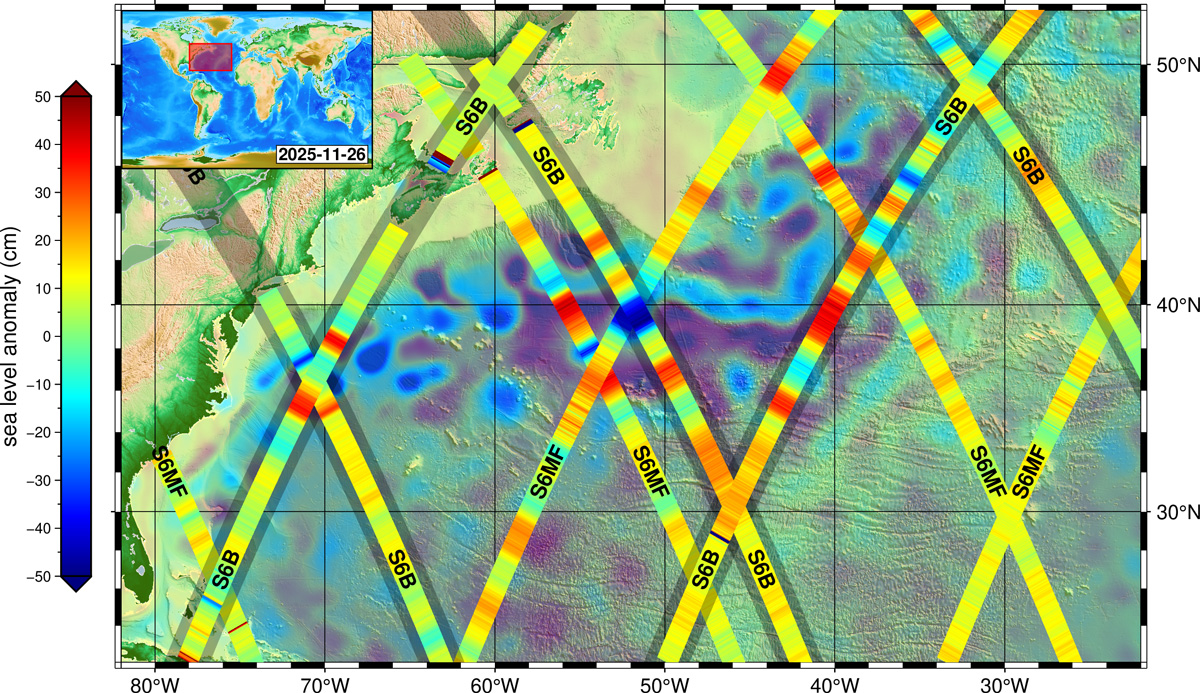
Altimeter measurement by Sentinel-6B and Sentinel-6 Michael Freilich
Meanwhile, the Sentinel-5 mission has begun a new era of air-quality monitoring, providing detailed maps of pollutants such as nitrogen dioxide and sulphur dioxide. In the commercial sector, Vantor’s WorldView Legion constellation is now fully operational, capable of collecting nearly 7 million square kilometers of imagery daily. Additionally, the NISAR mission has entered its science phase, deploying its 12-meter antenna to monitor river deltas and agricultural landscapes.
Mapping Innovations: 3D Models and Radical Narratives
Our ability to visualize the world has been revolutionized by the release of the GlobalBuildingAtlas, a dataset capturing 2.75 billion buildings in 3D. Developed by researchers at the Technical University of Munich (TUM), this atlas provides volumetric data that offers far more precise insights into urbanization and population density than traditional 2D maps.
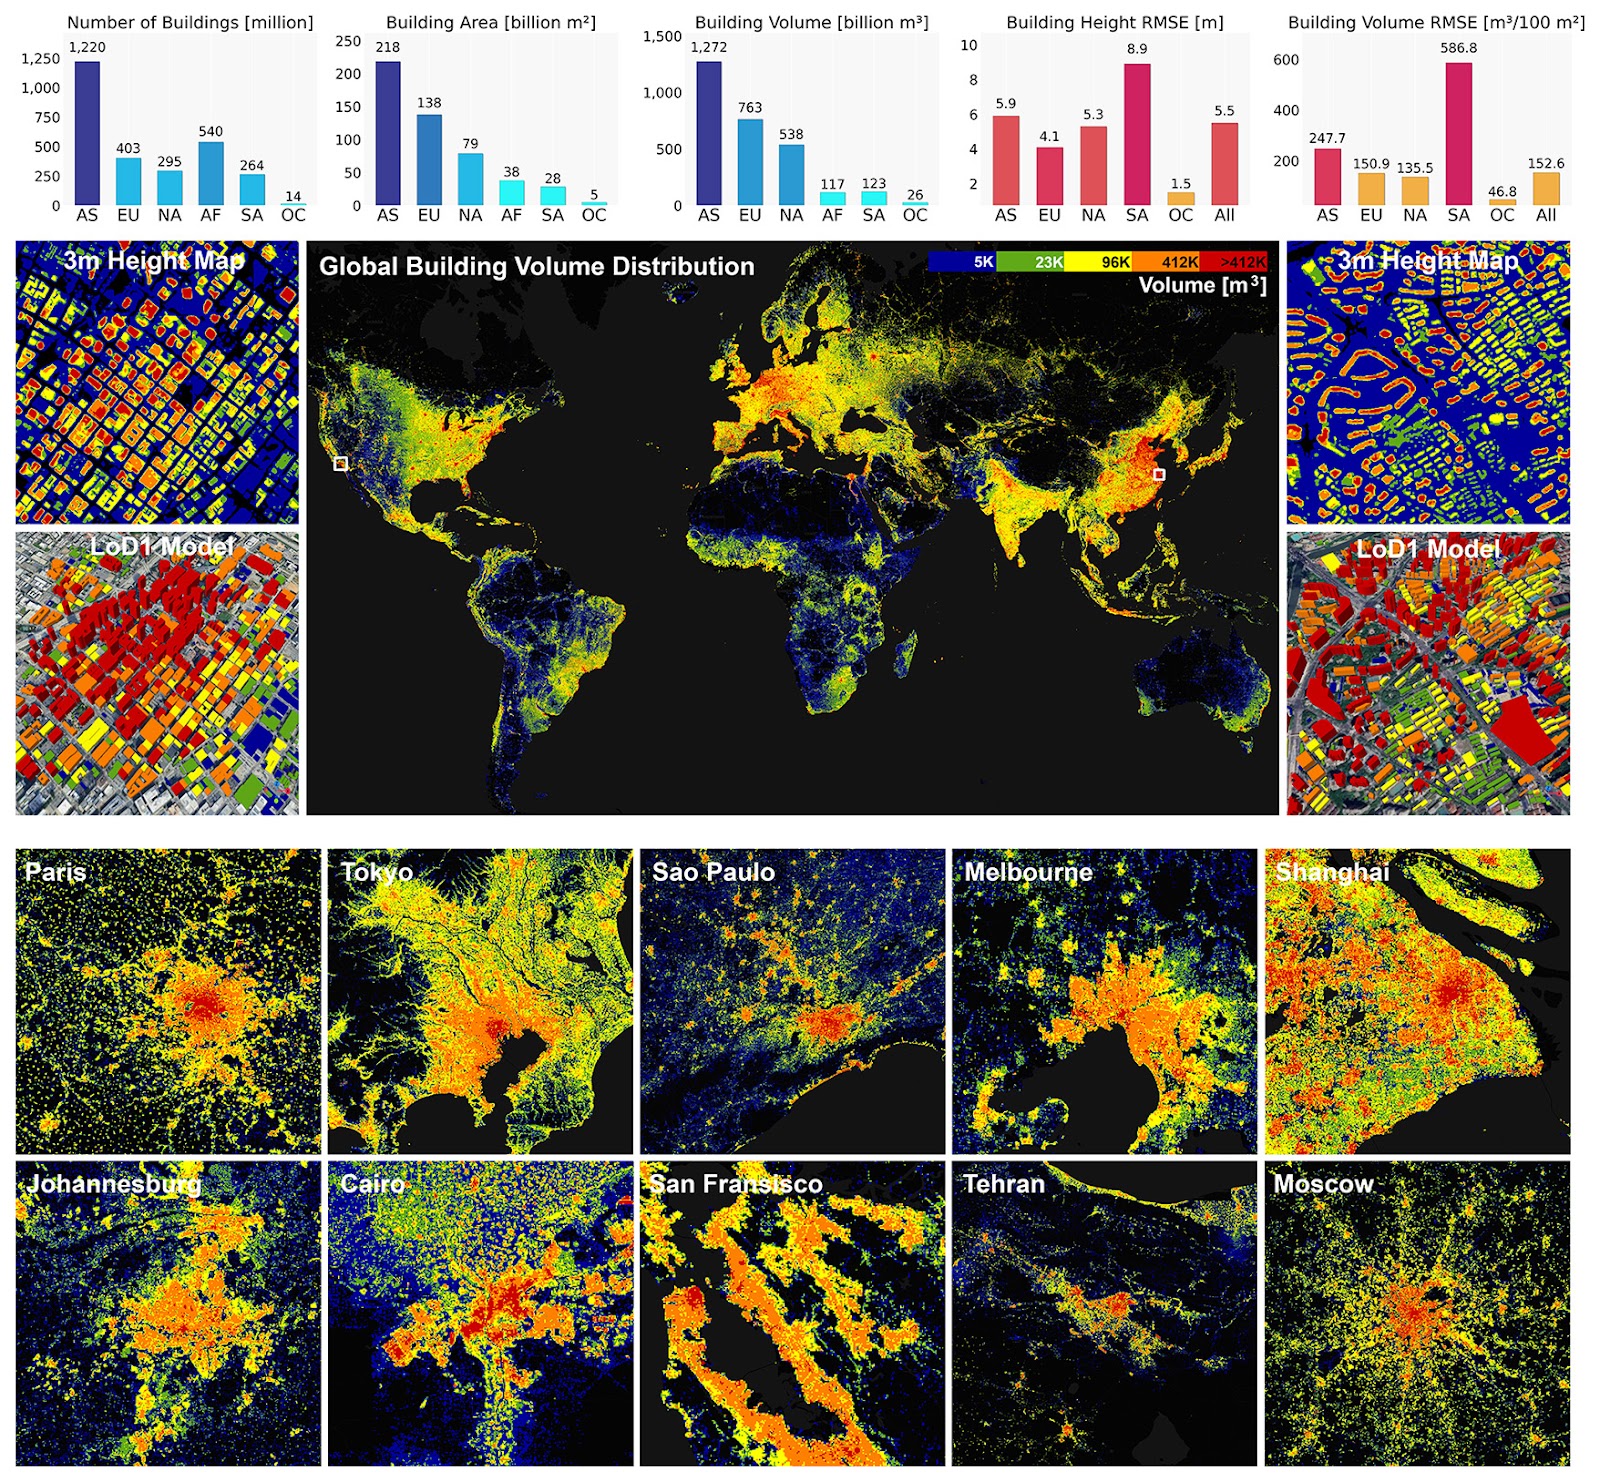
GlobalBuildingAtlas, overview
Parallel to these 3D advancements, the USGS has introduced the Seamless 1 Meter Digital Elevation Model (S1M), a nationwide dataset that merges trillions of lidar points to eliminate gaps and artifacts across project boundaries. Beyond technical precision, the “Equal Earth” movement, supported by the African Union, is gaining ground to replace the 16th-century Mercator projection with the Equal Earth projection, correcting historical distortions that shrink the true size of Africa. As explored in William Rankin’s new book, Radical Cartography, modern mapmaking is increasingly focusing on values like uncertainty and multiplicity to tell more robust stories of human experience.
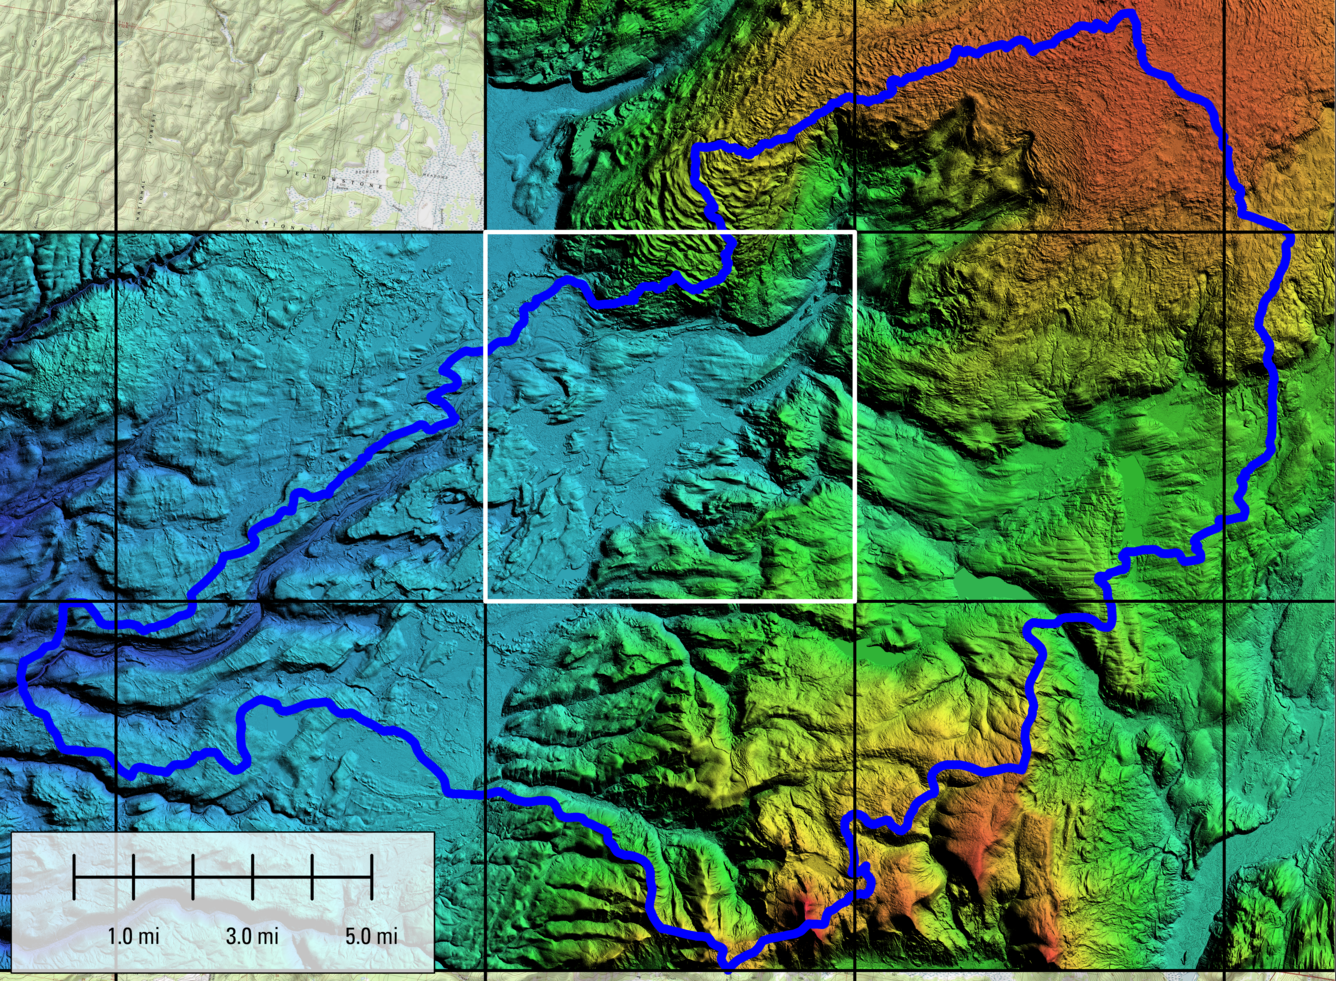
Seamless 1 Meter Digital Elevation Model (S1M)
The AI and Geospatial Revolution
Artificial intelligence has emerged as the “super trend” of 2026, integrating with satellite data to move from simple computer vision to true “machine understanding”.
- Health: GeoAI is now used to detect “green pools” for mosquito breeding and forecast emergency department surges.
- Agriculture: Tools like WorldCereal and Sen4Stat are leveraging Copernicus data to create customized crop-type maps and improve national agricultural statistics.
- National Security: Experts are proposing a National Geospatial-Intelligence Embedding Model (NGEM) that would unify radar, thermal, and text reports into a single searchable “latent space” for automated change detection.
Climate Monitoring: Records and Extremes
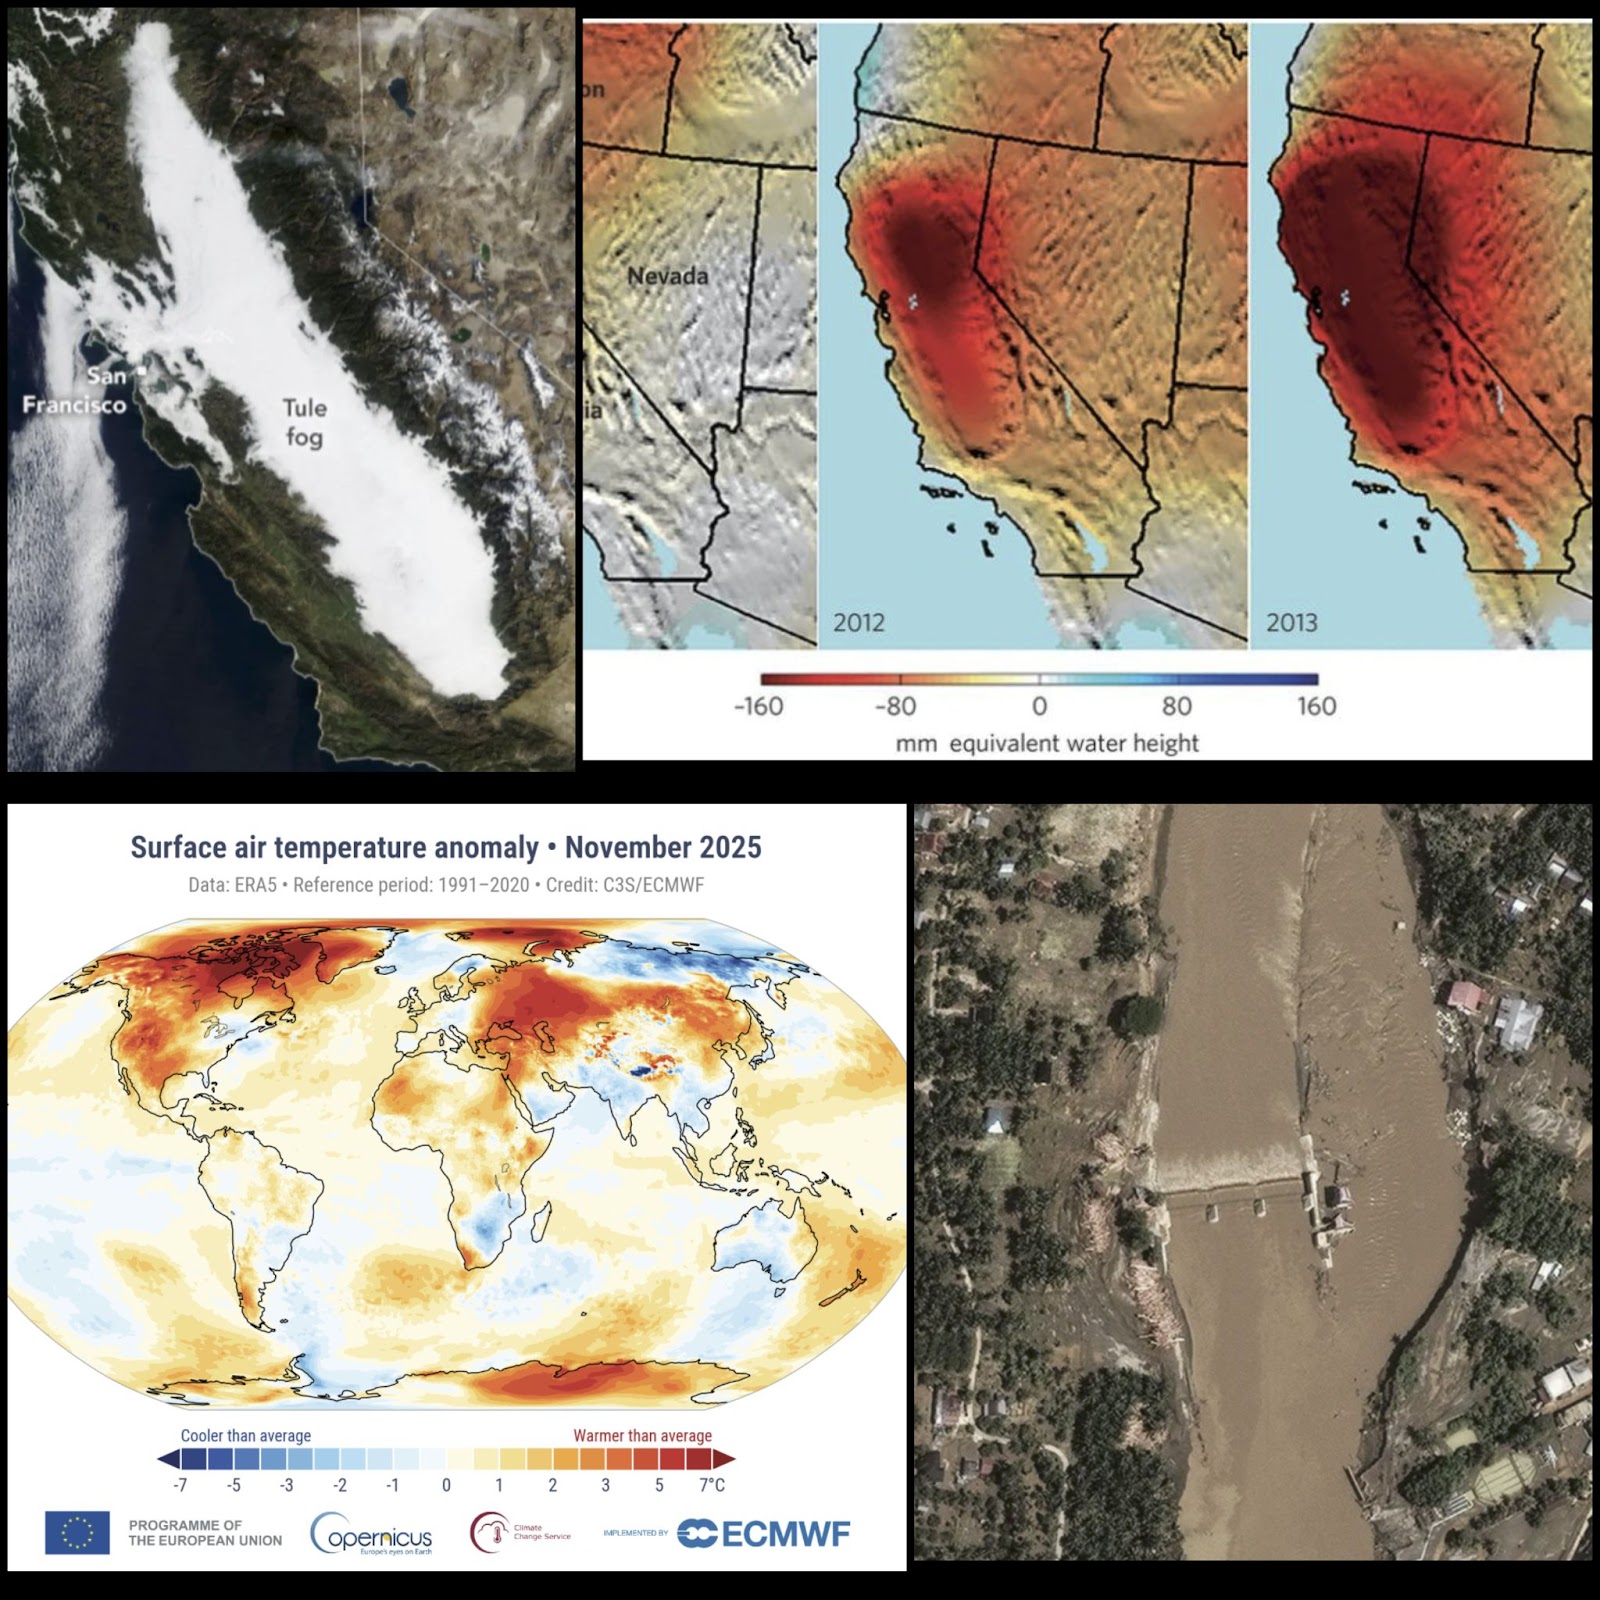
Environmental data from late 2025 confirms a warming planet. The Copernicus Climate Change Service (C3S) reports that 2025 is virtually certain to be the joint-second warmest year on record. This warming has been accompanied by extreme events:
- Persistent Fog: A massive 400-mile-long “tule fog” haunted California’s Central Valley for weeks, trapped by a temperature inversion and moist soil from heavy autumn rains.
- Devastating Floods: Cyclone Ditwah and Cyclone Senyar battered Southeast Asia, causing landslides and flooding that killed over 1,200 people across Indonesia, Sri Lanka, and Thailand.
- Groundwater Tracking: Missions like GRACE-FO continue to monitor the alarming depletion of major aquifers, such as the Central Valley aquifer, which has lost significant water volume over the past decade.
Climate Monitoring: Records and Extremes
Practical Applications: Property and Conservation
These high-tech tools are providing real-world solutions across various sectors:
- Infrastructure: Renewable Water Resources (ReWa) used a GIS data warehouse to manage 177 properties totaling 1,883 acres, facilitating property inspections and riparian restoration.
- Marine Protection: Scientists used ArcGIS Pro to map 52 critical species in the Mediterranean, supporting the creation of new marine protected areas in Greece.
- Field Operations: The latest ArcGIS Field Maps (version 25.3) introduced tasks and improved data capture, with AI-assisted data capture and Geospatial PDF support planned for 2026.
Conclusion: A Connected, Data-Driven Future
The innovations of 2025 and early 2026 demonstrate that we are moving toward a state of “sovereign space” and integrated intelligence. By combining satellite precision with AI-driven machine understanding, humanity is gaining the “decision advantage” necessary to manage resource depletion and climate volatility. As these technologies mature, they will continue to reshape how our societies communicate, move, and synchronize with the planet.
How do you like this article? Read more and subscribe to our monthly newsletter!

