
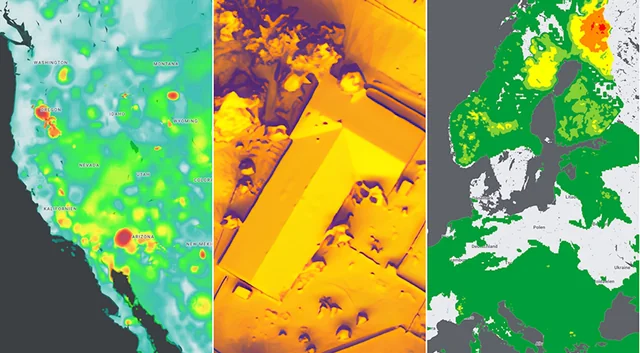
What if we could measure plant health, detect water stress, or monitor urban heat just by looking at light we can’t even see? Thanks to remote sensing and spectral indices like NDVI, we can.
These indices allow scientists, farmers, and conservationists to monitor Earth’s surface through satellite imagery, detecting patterns invisible to the human eye. This article explains what spectral indices are, how they work, where to get the data, and how to start using them.
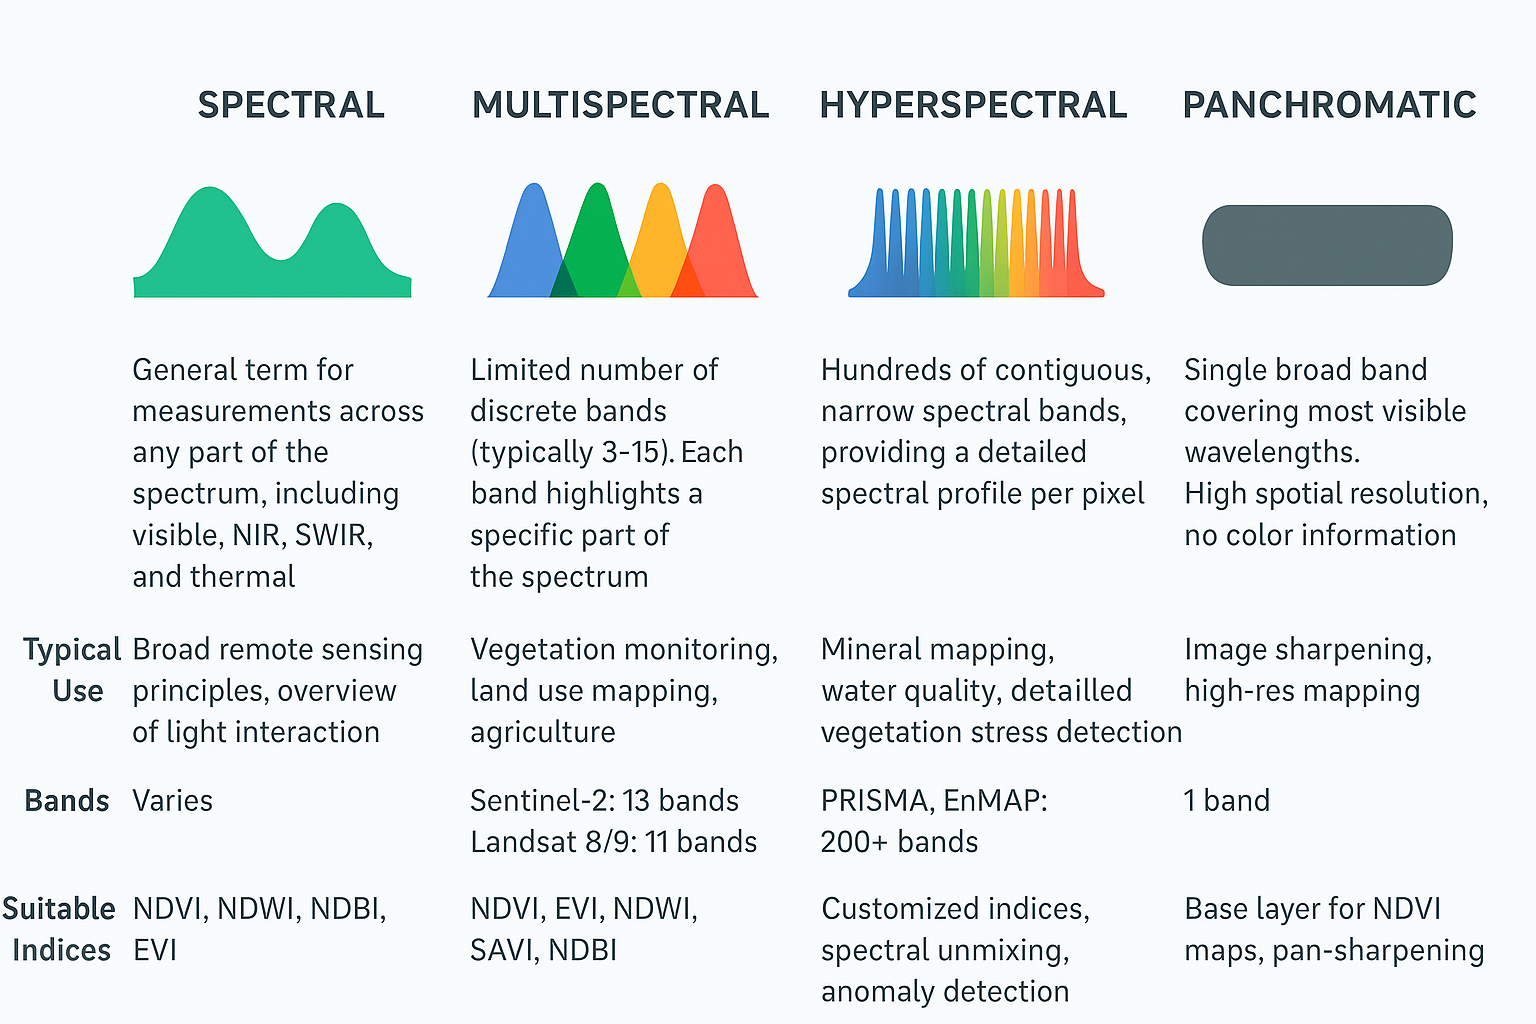
Spectral, Multispectral, and Hyperspectral: What’s the Difference?
Not all satellite sensors see the Earth in the same way. Some capture just a few broad slices of the spectrum, while others record hundreds of narrow bands. This distinction — spectral, multispectral, and hyperspectral data — determines how much detail we can extract about vegetation, water, soil, or urban areas.
Understanding NDVI and Its Applications by Geoawesome
A great repository for spectral indices is:
Awesome Spectral Indices
 Python package: spyndex
Where to Get the Data
Spectral indices require multispectral imagery, which is widely available for free.
| Sensor | Bands Available | Spatial Resolution | Access |
|---|---|---|---|
| Sentinel-2 | 13 bands (incl. Red, NIR, SWIR) | 10–20 m | EO Browser |
| Landsat 8/9 | 11 bands | 30 m | USGS EarthExplorer |
| MODIS | 36 bands | 250m–1km | NASA Worldview |
| PRISMA / EnMAP | Hyperspectral (200+ bands) | 30 m | ASI PRISMA Portal |
Tools to Compute Spectral Indices
Desktop Tools
- QGIS
- Plugin: Semi-Automatic Classification Plugin (SCP)
- Allows NDVI calculation from Sentinel, Landsat
- SNAP Toolbox
- Ideal for processing Sentinel-1 and Sentinel-2
- NDVI and NDWI modules built in
Python (for automation & large-scale analysis)
- rasterio – for raster handling
- earthpy – plotting and calculating indices
- spyndex – large set of ready-to-use indices
- geemap – visualize on Google Earth Engine
Cloud Platforms
- Google Earth Engine
- Code-based platform for calculating NDVI and more
- Supports huge archives (MODIS, Sentinel, Landsat)
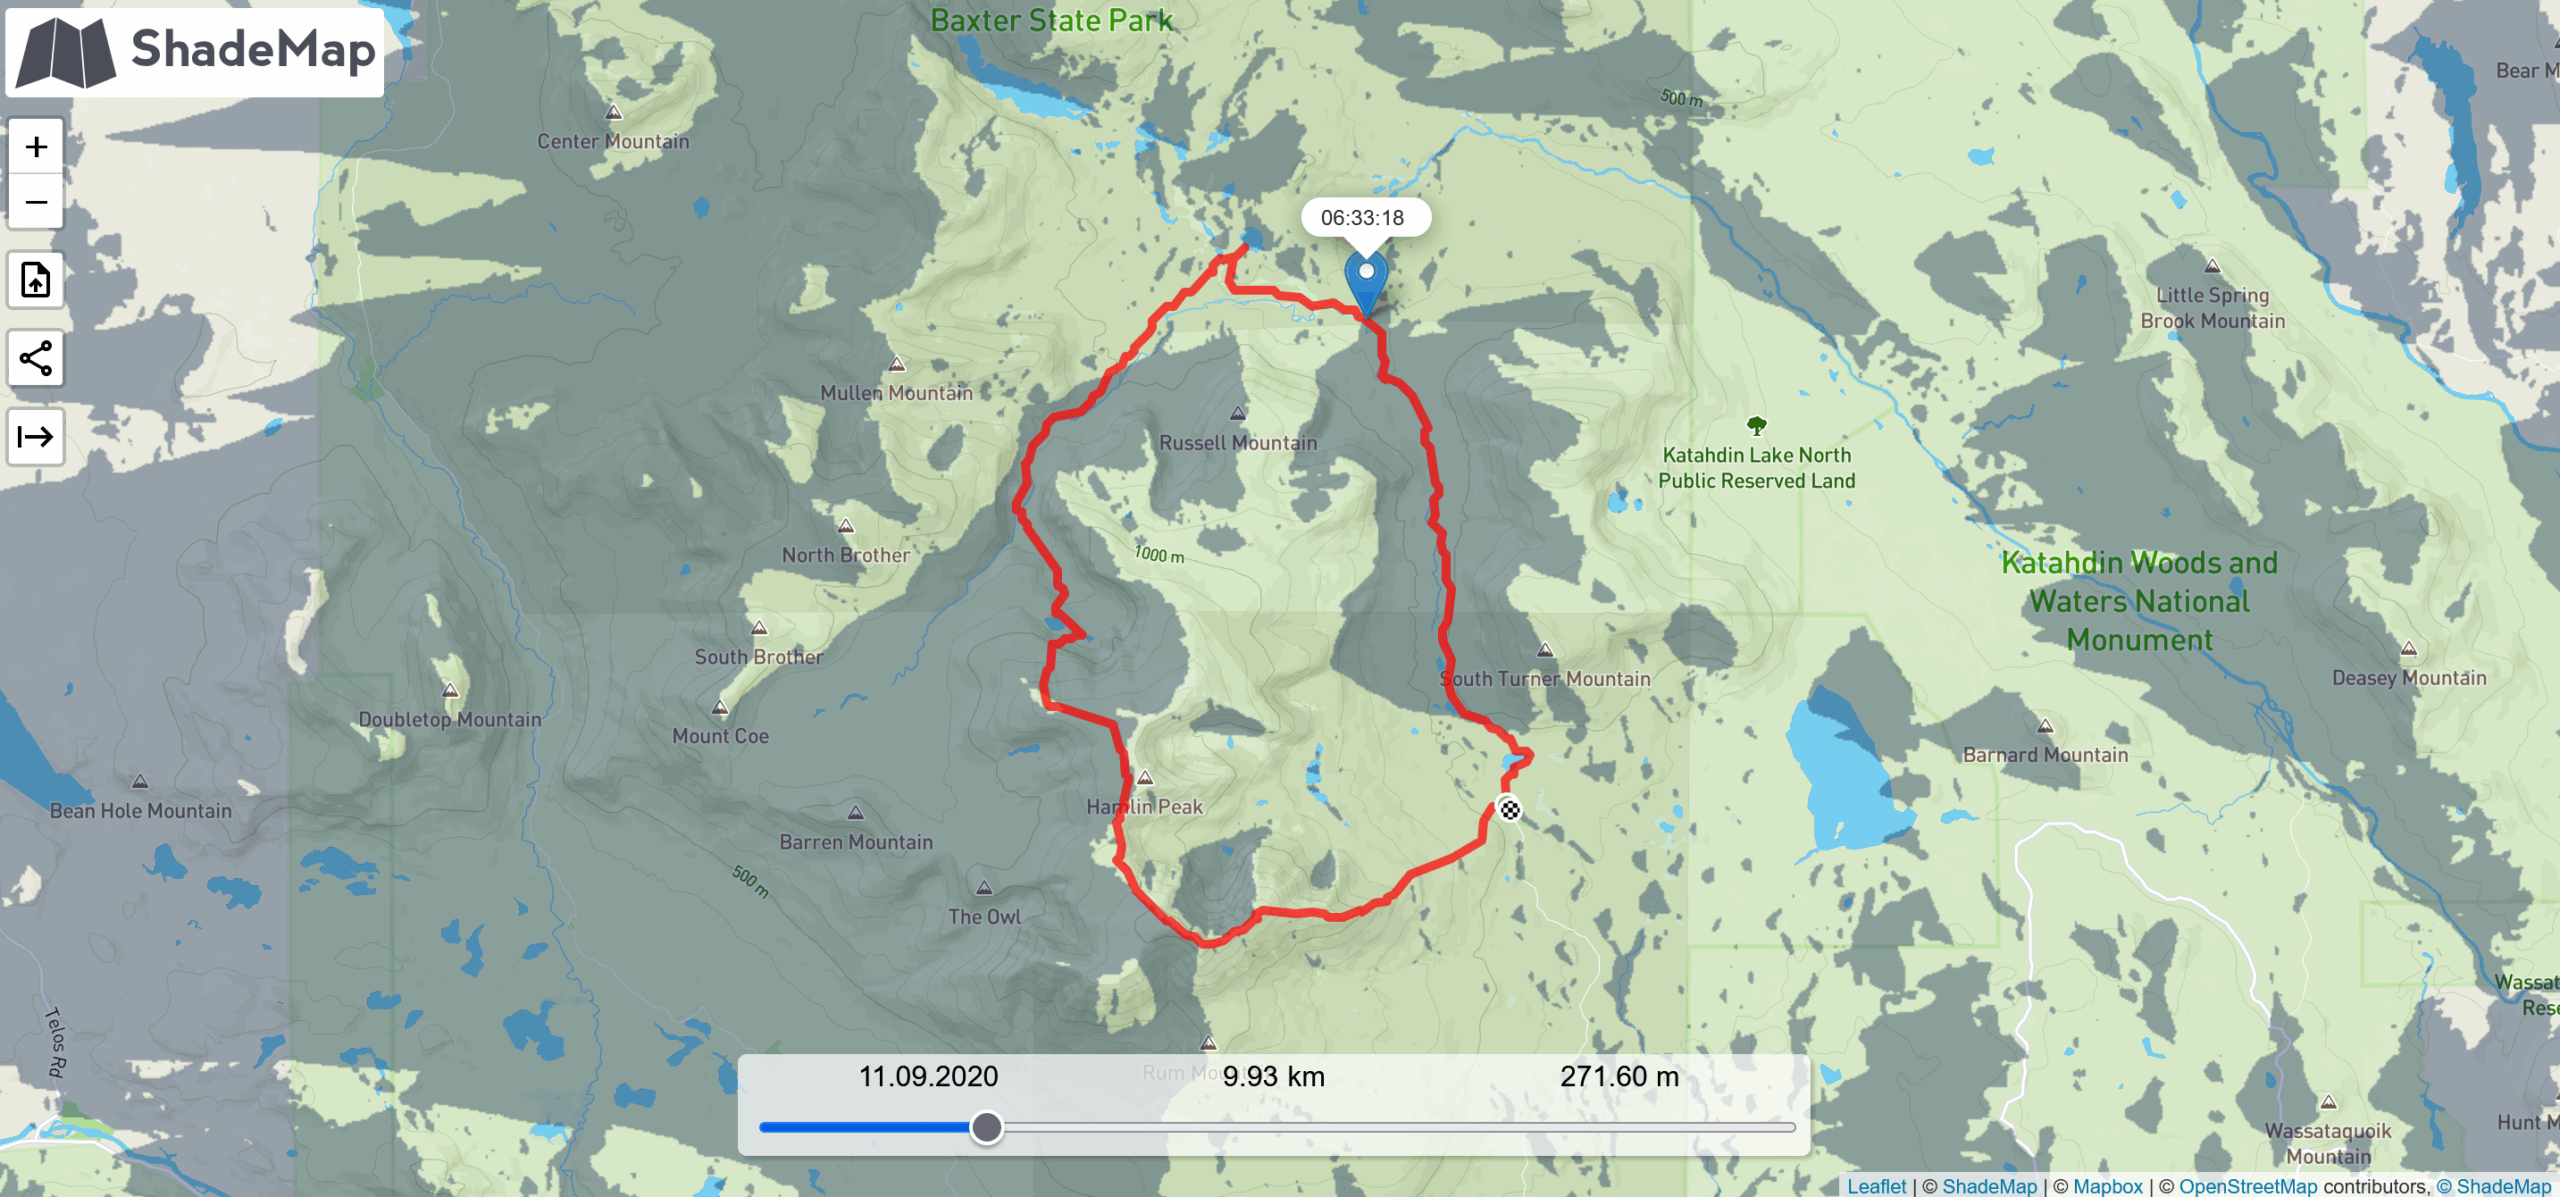
Case Study: Using Multiple Indices to Classify Land Cover
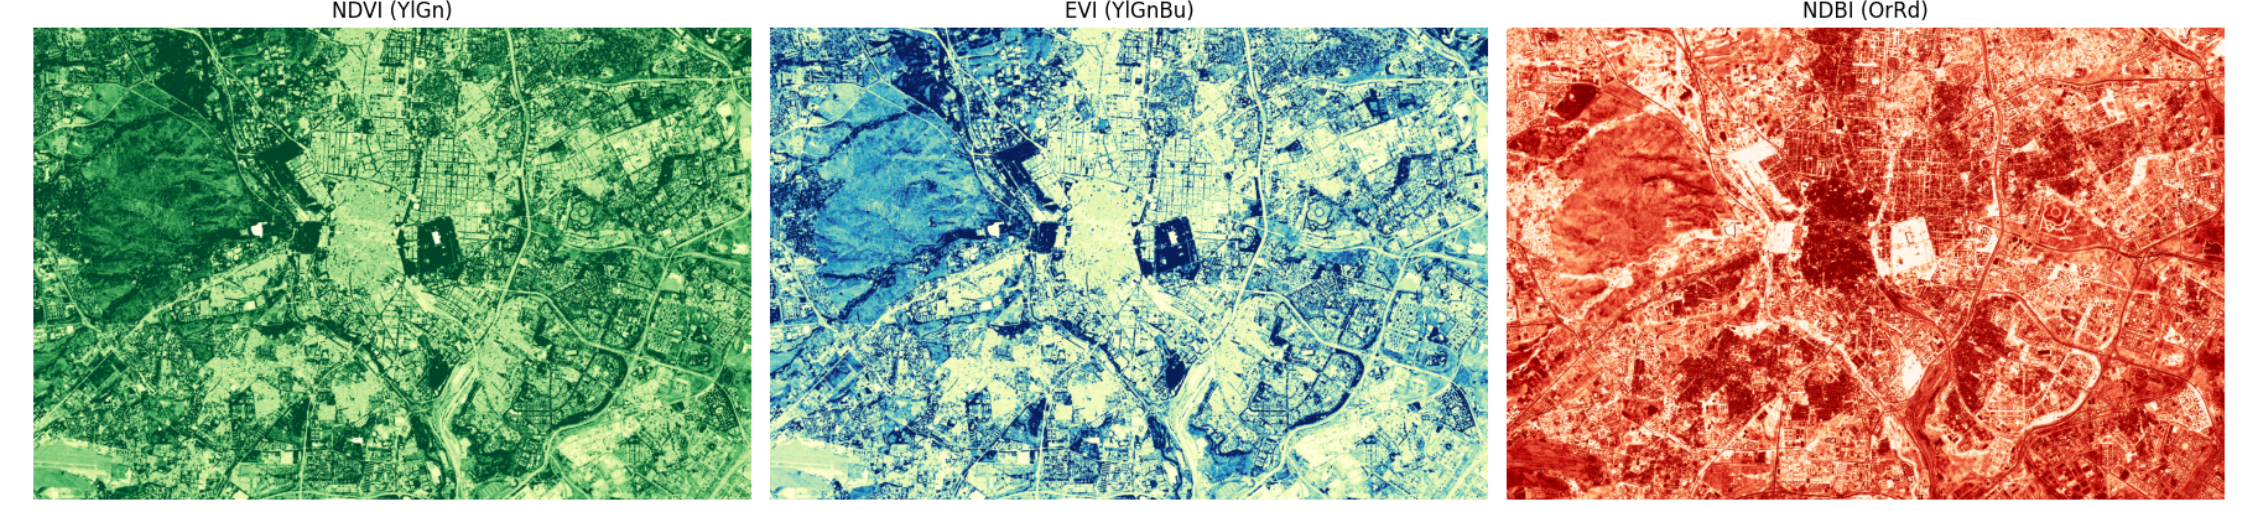
Area of Interest (AOI): Madrid, Spain
In this case study, we explore how multiple vegetation and built-up indices can be combined to classify land cover in the metropolitan area of Madrid, Spain. The indices used include the Normalized Difference Vegetation Index (NDVI), the Enhanced Vegetation Index (EVI), and the Normalized Difference Built-up Index (NDBI). Each index highlights different land cover characteristics and, when used together, provide a framework for land cover classification.
For example, NDVI measures vegetation health by comparing near-infrared and red light reflectance. High NDVI values indicate dense, healthy vegetation. EVI: Similar to NDVI but optimized to reduce atmospheric and soil background influences, providing enhanced sensitivity in high biomass regions. NDBI: Highlights built-up or urban areas by contrasting the shortwave infrared and near-infrared bands.
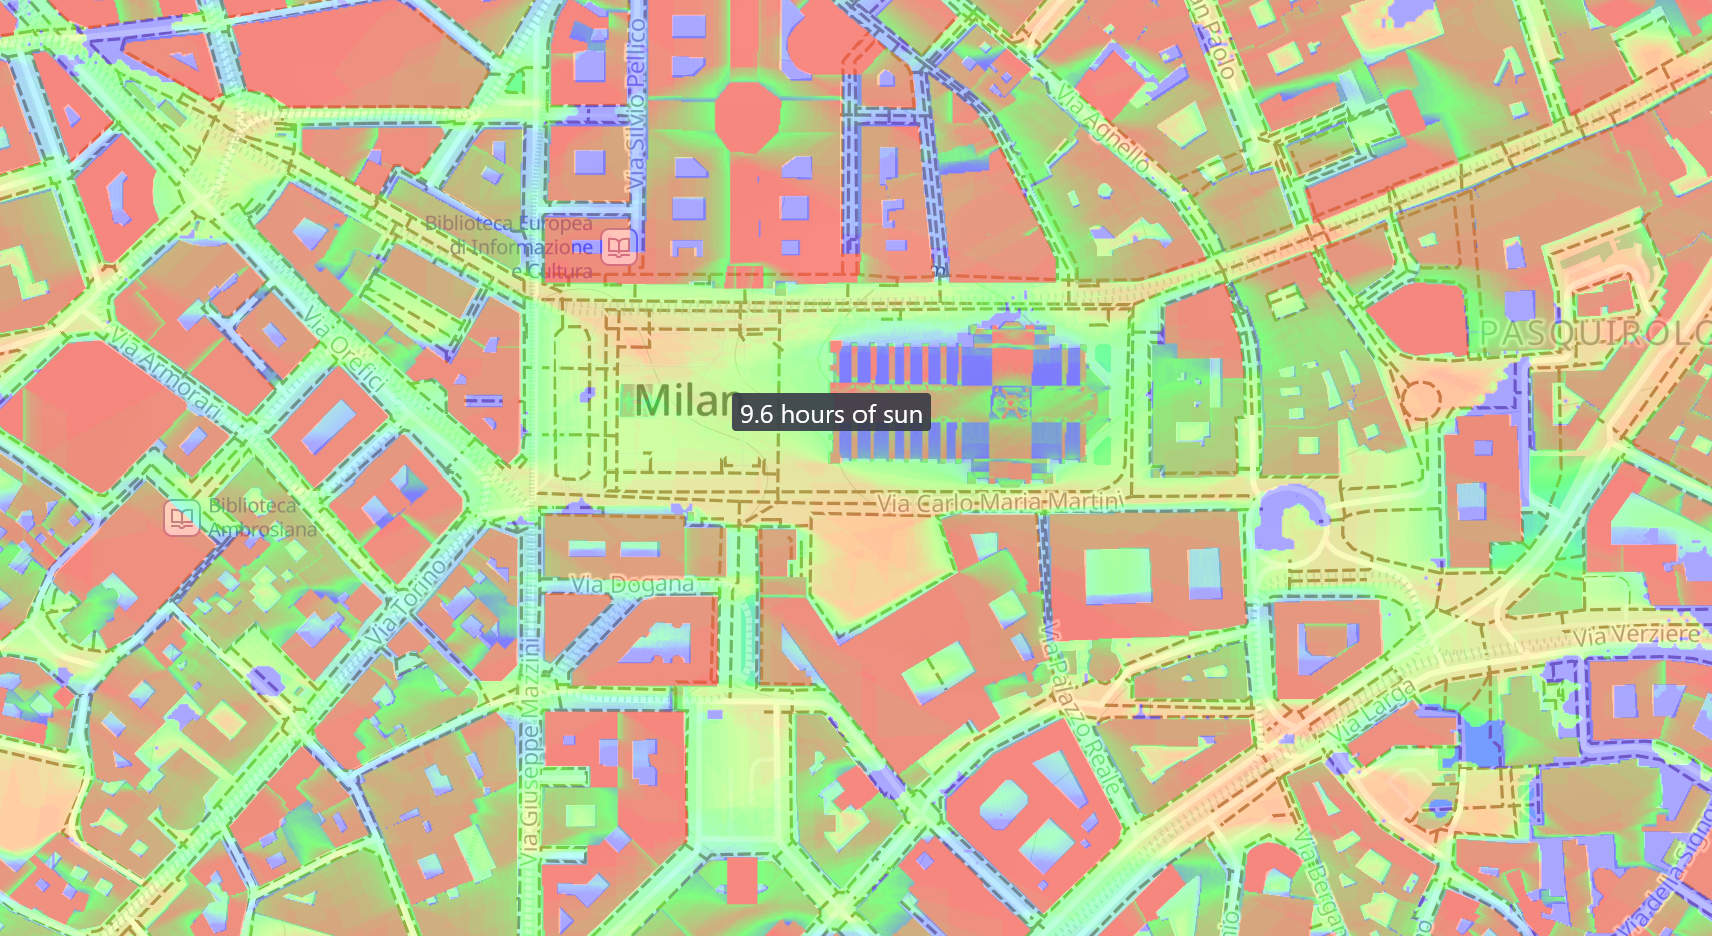
Visualizing Data with Maps and Histograms
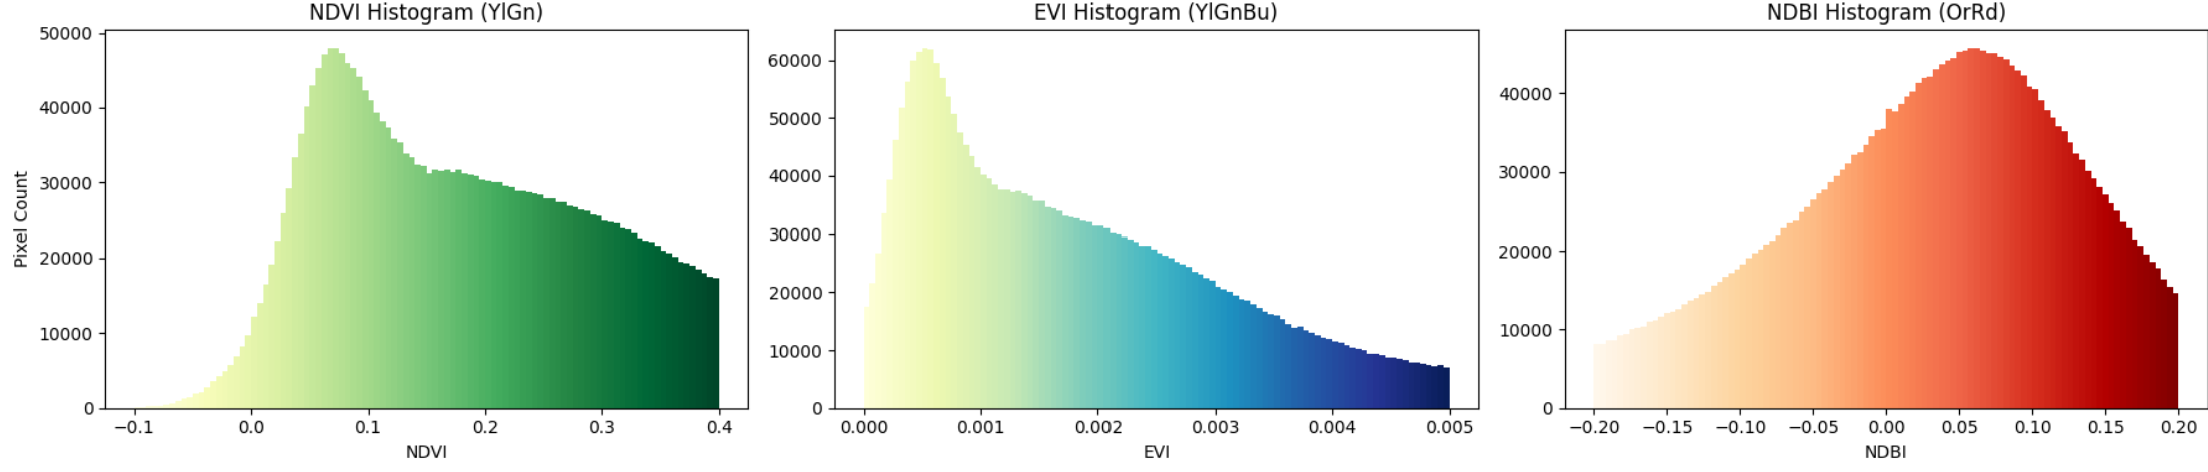
To analyze spatial patterns and value distributions within the AOI, we generate maps and histograms for each index.
- Maps provide a spatial representation, allowing us to see where vegetation, urban areas, or water bodies dominate.
- Histograms are graphical plots that show the frequency distribution of pixel values for each index across the AOI. This statistical visualization helps identify the range and common values in the data, aiding in threshold selection for classification.
Interactive Feature for Threshold Tuning
An interactive tool was developed to experiment with different threshold values for NDVI, EVI, and NDBI. This interface allows users to adjust slider controls corresponding to each index’s classification threshold and immediately visualize the impact on land cover maps. By testing various combinations, users can optimize the classification scheme to best reflect real-world land cover patterns.
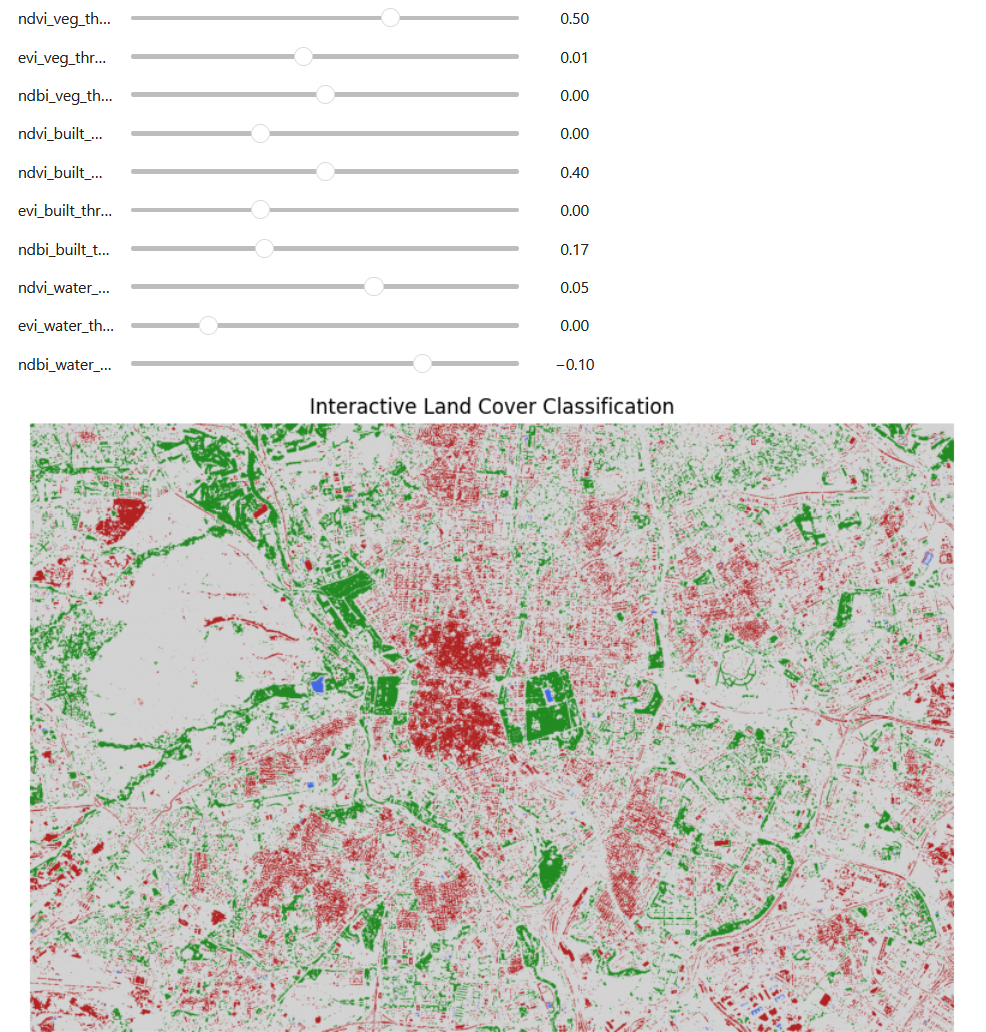
This approach illustrates the application of indices in a standard remote sensing workflow, specifically in the classification stage.
In summary, spectral indices like NDVI are powerful, scalable, and often free to use. With open satellite platforms, public data archives, and tools like QGIS or Earth Engine, anyone can “see the unseen” — from deforestation alerts to water availability and beyond.
Learn & Explore More
- NDVI Paper: Rouse, J. W., et al. (1974). Monitoring Vegetation Systems in the Great Plains with ERTS.
- GitHub Repo: Awesome Spectral Indices
- Global Tools:
How do you like this article? Read more and subscribe to our monthly newsletter!


#Environment

Next article
In the world of Geographic Information Systems (GIS), everyday tools converge with the science of space. A new generation of apps blends geospatial mapping, augmented reality (AR), and astronomical ephemerides into powerful platforms. These tools allow professionals or everyday users to plan and analyze with celestial precision.
Geospatial Data and Mapping Foundations
GPS, Maps & Elevation Models
- Most sun/earth apps use GPS for precise time and space positioning.
- Works seamlessly with base maps (satellite or terrain) from providers: Google, Mapbox, and OpenStreetMap (OSM).
- Elevation data (e.g., Google Elevation API in Sun Surveyor (arxiv.org) helps calculate sun/moon angles, shadow lengths, and horizon visibility.
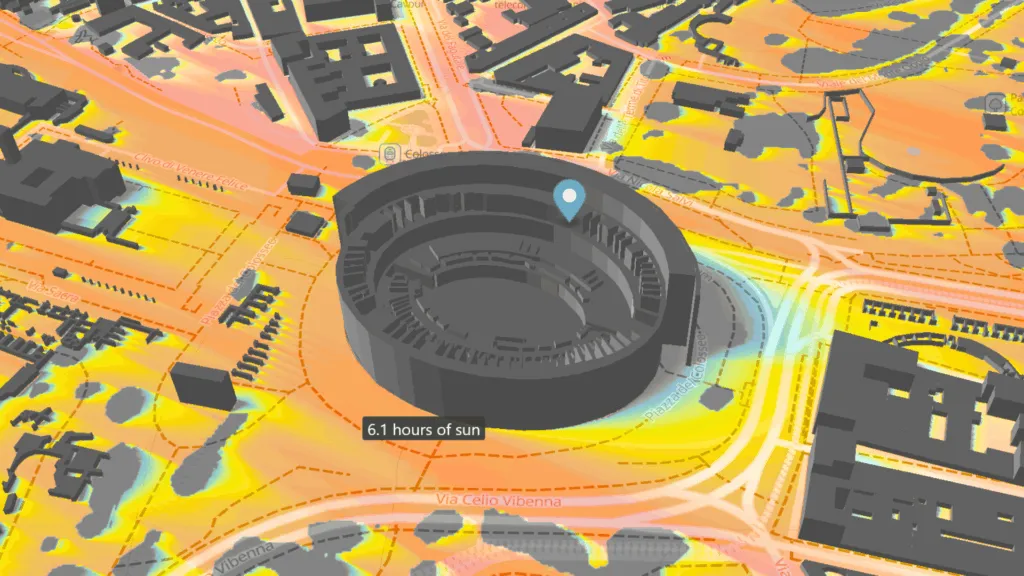
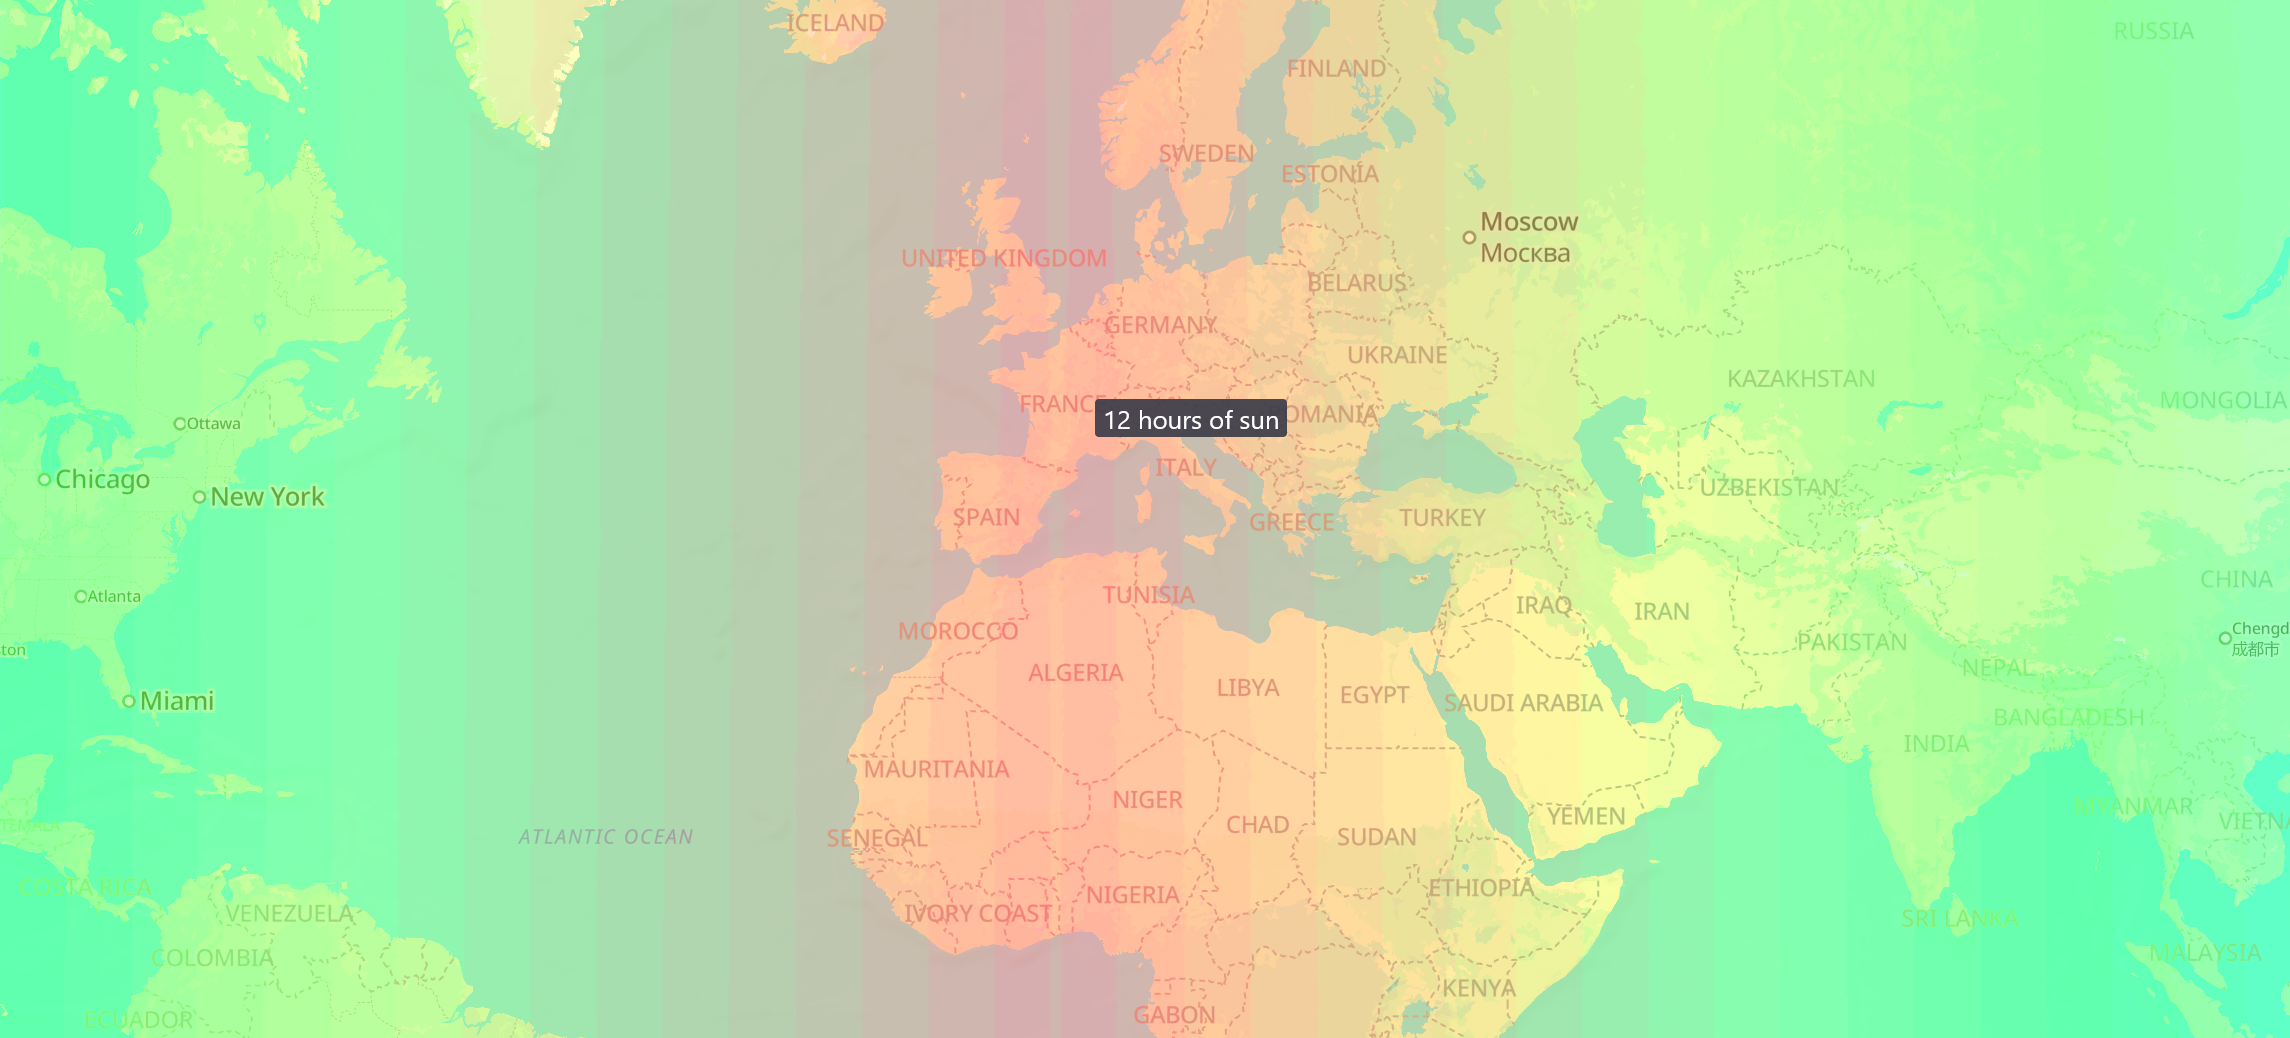
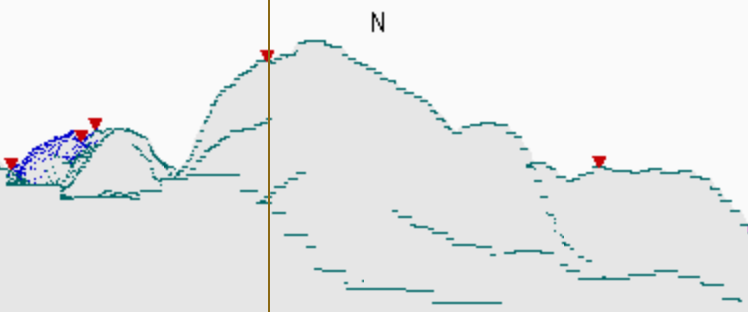
3D Horizon Extraction & Visualization
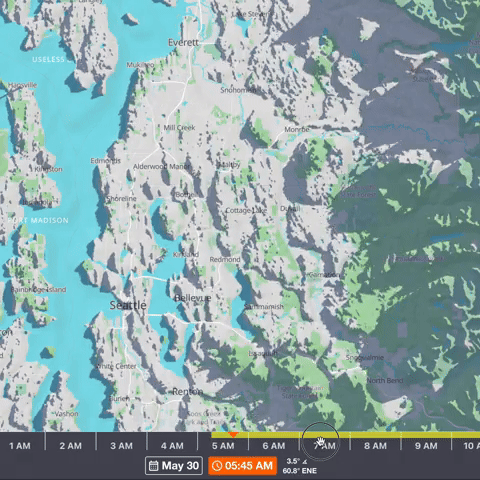
Some tools, like Shadowmap, let users simulate shade across time using GIS-derived 3D building and terrain data, often sourced from OSM building footprints and digital surface models.
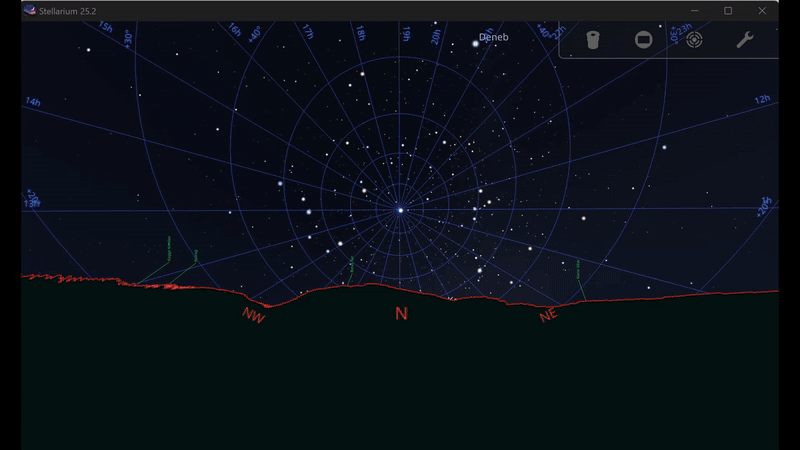
GIS techniques are used to create horizon polygons from SRTM elevation data (e.g., HeyWhatsThat), a method also used in Stellarium research for cultural astronomy contexts.
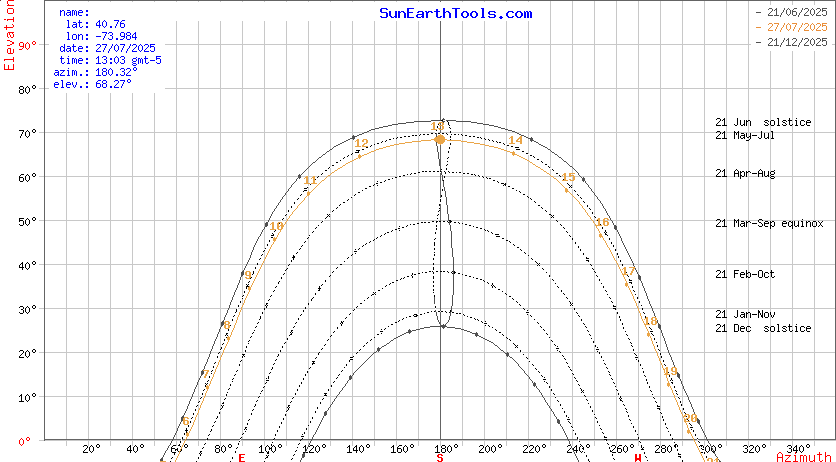
Ephemeris Tables & Sun Paths
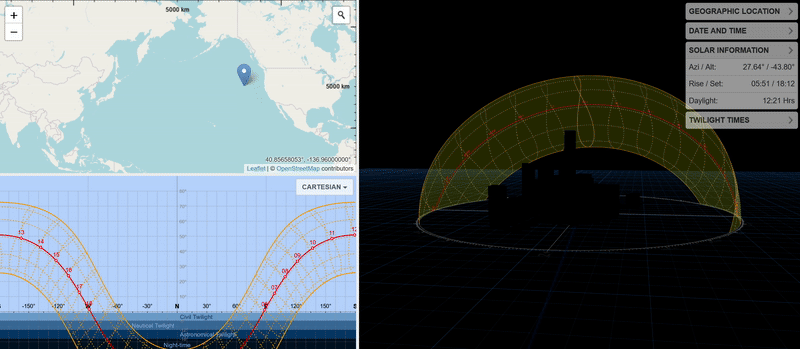
All apps feature sunrise/set, solar noon, twilight phases; many also plot declination, right ascension, azimuth‑altitude graphs (sunearthtools.com). Example: SunCalc shows the solar path, shadow lengths, and key times on a date-location graph.
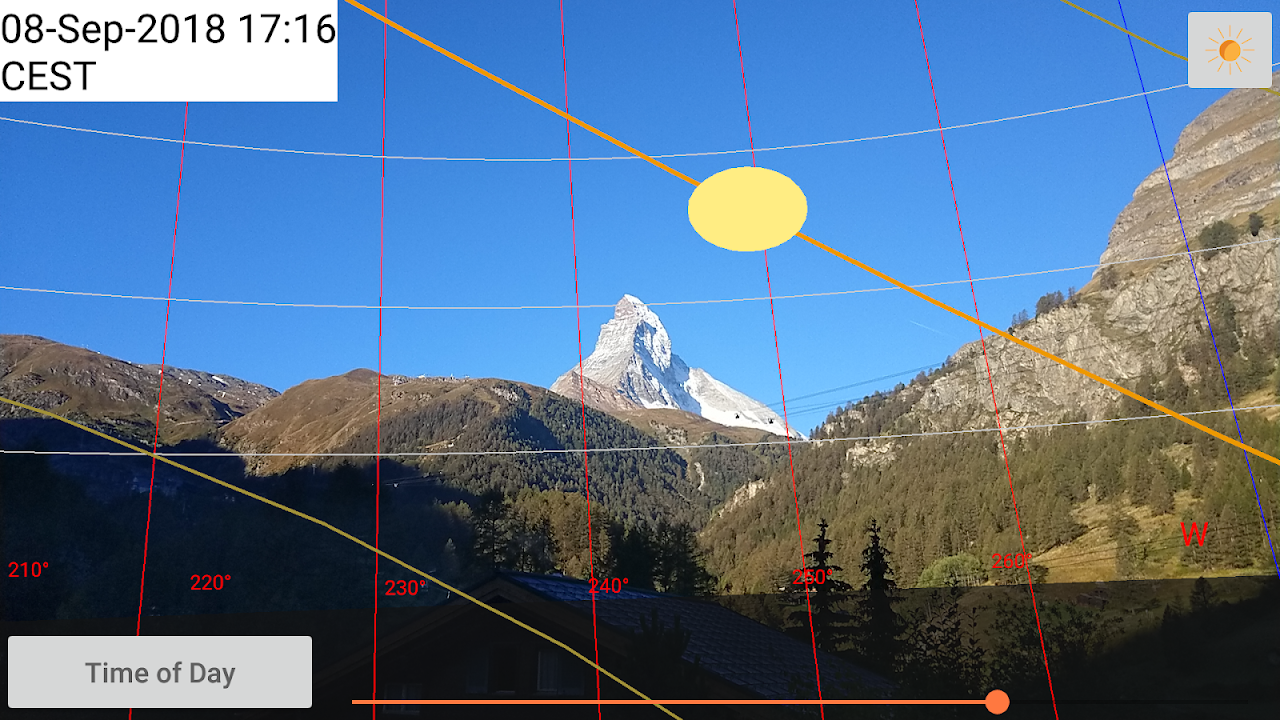
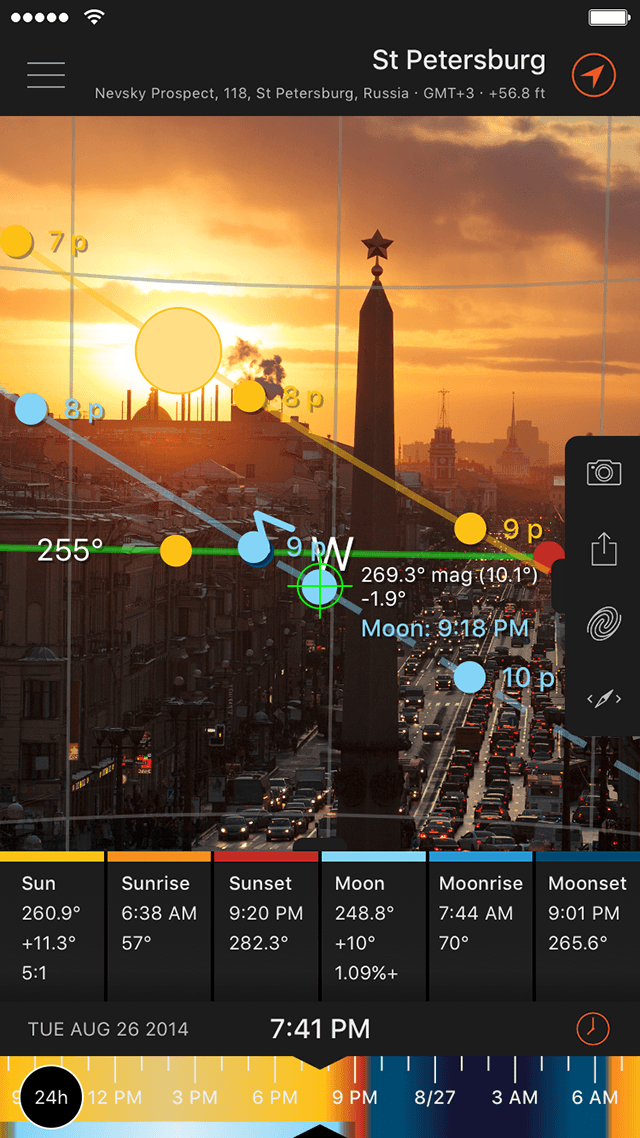
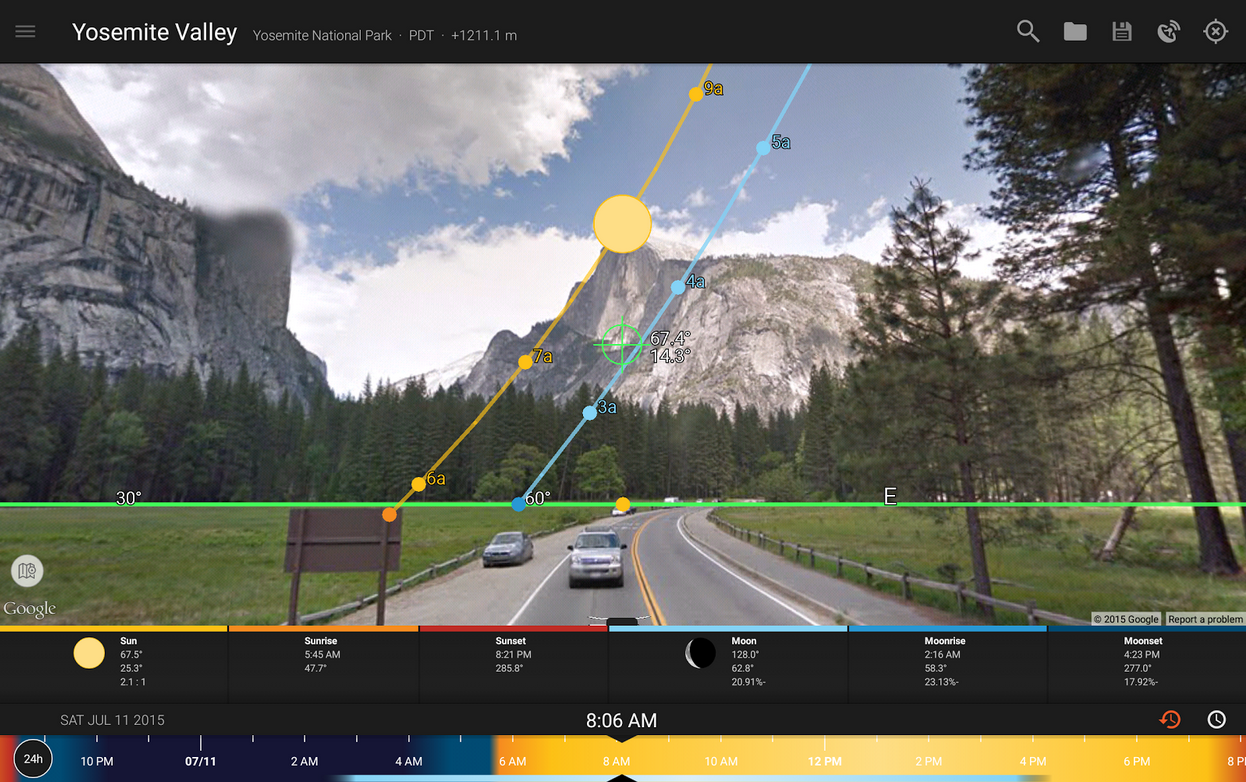
Augmented Reality & Compass Views
Apps like Sun Locator and Sun Surveyor use camera overlays and compass AR to show sun and moon directions in the real world. Use of the device magnetometer/gyroscope means users can physically align with projected celestial paths through 3D compass or street views.
How These Apps Visualize Data
- Polar sun-path plots: Show time along circles with azimuth angle, used by SunCalc.
- Cartesian ephemeris charts: Altitude vs. time graphs in Sun Surveyor.
- 3D AR overlays: Augmented layers of celestial paths in camera view.
- Street View & Map View: 360° panoramas occulted by urban structures with sun/moon tracked.
- Shadow & light simulation maps: 3D sun-exposure grids across terrain and buildings in apps like Shadowmap.
Integrating Geospatial and Astronomic Perspectives
| Use Case | GIS Component | Astronomy Component |
| Shadow planning | OSM building footprints + DSMs | Sun angles through ephemeris |
| Photo scouting | Elevation, terrain, panoramic views | Golden hour timing, path alignments |
| Star visibility estimates | Horizon silhouettes from local DEMs | Milky Way center visibility via Sun Surveyor |
| Solar installers | Building orientation + tilt | Sun path over solstice/equinox |
| Cultural research | Horizon polygons via GIS | Simulation sky epochs in Stellarium |
Why This Fusion Matters
For GIS Professionals
- Charts & maps enhance data interpretations: where sunlight falls and when terrain is illuminated or shaded.
- GIS developers can use API layers (Elevation, Maps SDKs, OSM, DSMs) to integrate astronomical calculators via AstroPy or astroplan packages.
Integrating solar irradiance and roof orientation data enables precise solar panel planning, allowing GIS workflows to estimate potential energy generation for any location. APIs like Google’s Solar API demonstrate how combining sunlight mapping with geospatial layers can help forecast energy output and optimize installations.
For Astronomers
- GIS adds real‑world horizon context, improving sky observability predictions and site analysis.
- Horizon profiles help in environmental light simulations, key in cultural astronomy.
For Educators and Outreach
- AR apps make behind-the-scenes science tangible and accessible.
- Visual tools deliver immediate engagement: understanding seasonal variation, twilight regimes, star rise/set.
The geospatial–astronomy apps showcase the synergy of GIS spatial models with celestial mechanics, bringing next-level insight to photography, architecture, renewable energy, and scientific exploration.
In a nutshell, these apps rely on:
- High-precision GPS/time data
- Elevation/environmental modeling
- Astronomical ephemerides
- AR/mobile visualization
Do you use any of these apps? Read more and subscribe to our monthly newsletter!

