Using Principal Component Analysis (PCA) in Satellite Imagery: A Concise Guide with QGIS Application
Introduction
Principal Component Analysis (PCA) is a statistical technique used in satellite image processing. It helps enhance image data, reduce dimensionality, and improve interpretability while retaining important information—all while preserving crucial information.
So, how does it work? PCA transforms your original correlated variables into a set of values of linearly uncorrelated variables, known as principal components. Think of these components as a refined version of your data. They are derived from your original dataset and capture the most significant variance available.
The first principal component accounts for the largest possible variance. Then, each succeeding component has the highest variance possible under the orthogonal constraint to the previous components.
What’s the outcome? A more manageable dataset that retains the essential features of your satellite images, making them easier to analyze and interpret.
Principal Component Analysis in Satellite Imagery: Finding Patterns in Multispectral Data
In the context of satellite images, PCA is particularly valuable for its ability to reduce the large dimensionality of data while highlighting features that are most informative for further analysis like classification or change detection.
This technique enhances the contrast between features in different bands of a multispectral image, which can be highly important for identifying patterns or anomalies in environmental studies, urban planning, and resource management. This makes it easier to analyze patterns and anomalies.
To summarize, what are the benefits of PCA?
- Dimensionality reduction: PCA compresses multiple spectral bands into fewer, more manageable components without losing important information.
- Enhanced contrast: It improves the visibility of features across different bands, helping with tasks like classification and change detection.
- Noise reduction: By separating relevant signals from noise, PCA reduces noise while enhancing image quality.
Using PCA with QGIS Software and the Semi-Automatic Classification Plugin

SCP logo
QGIS offers tools for implementing PCA through plugins such as the Semi-Automatic Classification Plugin (SCP) and PCA4CD.
The SCP allows users to perform PCA to analyze satellite imagery and generate outputs that can be used for further analysis or visual interpretation.
To use PCA in QGIS through SCP:
- Load your satellite imagery into QGIS.
- Open the SCP and configure your band set by selecting the appropriate satellite bands.
- Navigate to the “Band Processing” tab within SCP and select PCA.
- Specify the number of principal components you wish to generate (commonly three for an RGB image).
Run the PCA, and the plugin will output PCA images which can then be visualized or used in further analyses (more info: QGIS in Mineral Exploration).
Understanding Principal Component Analysis Outputs
The outputs from PCA in QGIS include:
- PCA component images: These images represent the transformed data, typically focusing on the first few components for visualization (e.g., PCA1, PCA2, PCA3 for three-component analysis).
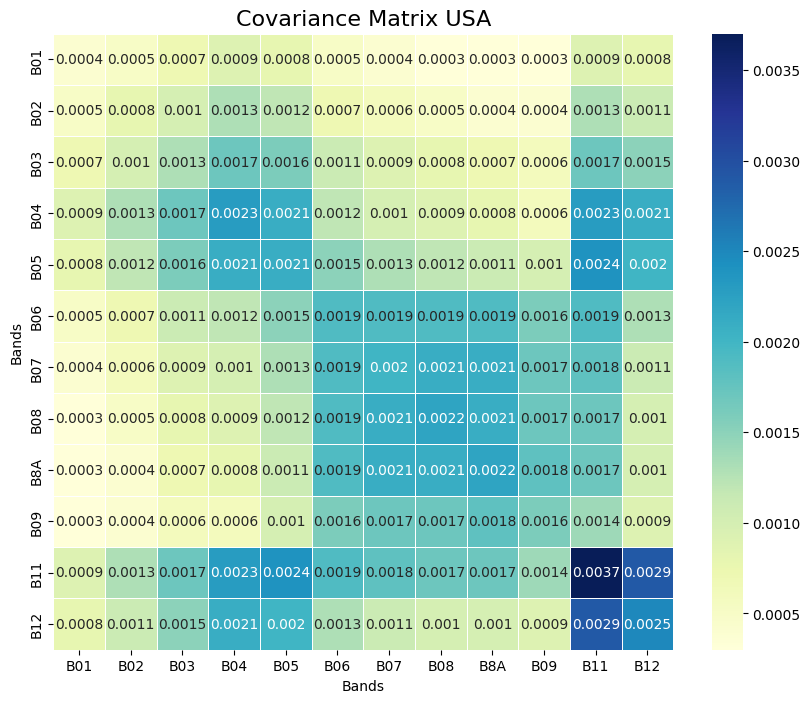
- Statistical metrics: Outputs such as the covariance matrix, correlation matrix, eigenvectors, eigenvalues, accounted variance, and cumulative variance. Equipped with these metrics, you can better understand the data’s underlying structure and how much variance each principal component captures from the source data.
Applications of Principal Component Analysis
PCA is widely used in various fields, including environmental studies, urban planning, and resource management. It helps improve land cover classification, monitor changes over time, and extract critical features from complex datasets.
Let’s look at an example of PCA used for mineral exploration below:
Case Study: In Search of Gold-Prone Zones in Ghana, USA, and Uzbekistan
Implementing PCA on satellite images can also be used in mineral exploration to identify areas with potential mineral deposits.
For instance, analyzing multispectral images of Asanko Gold Mine Camp in Ghana and Uzbek Muruntau Gold Mine using PCA helps highlight geological features that are typically associated with gold deposits, such as alteration minerals and geological structures. This process involves:
- Selecting regions of interest within the satellite images.
- Applying PCA to highlight anomalies and patterns indicative of mineralization.
- Analyzing and interpreting the PCA outputs to pinpoint locations that warrant further field investigation or sampling.
This approach allows geologists and researchers to efficiently target potential gold-prone areas, reducing time, cost, and environmental impact compared to traditional exploration methods.
True view, PCA1, PCA2, PCA3 and band composition (PCA1, PCA2, PCA3) for mine Ghana
True view, PCA1, PCA2, PCA3 and band composition (PCA1, PCA2, PCA3) for mine Uzbekistan
True view, PCA1, PCA2, PCA3 and band composition (PCA1, PCA2, PCA3) for mine in USA
 |
 |
 |
 |
 |
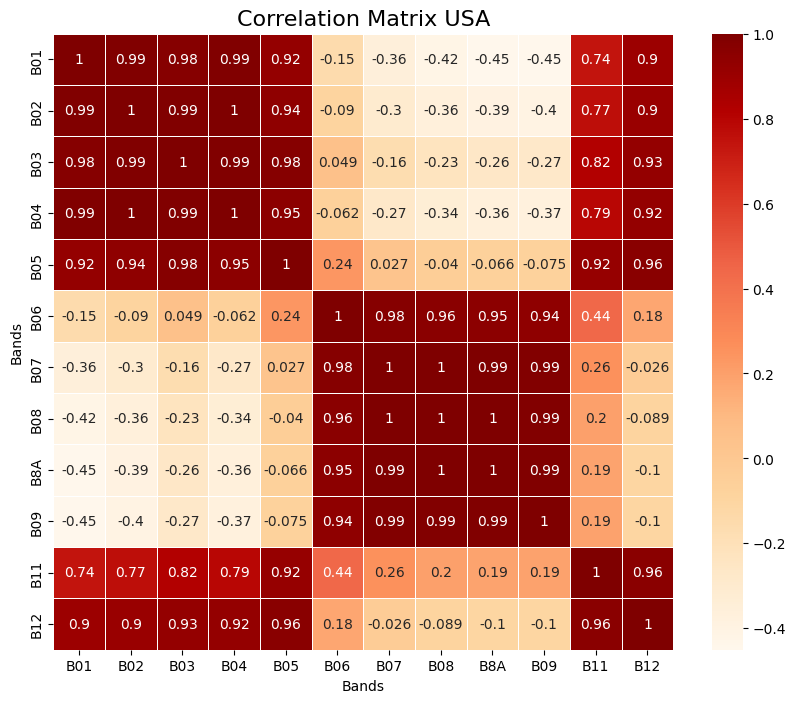 |
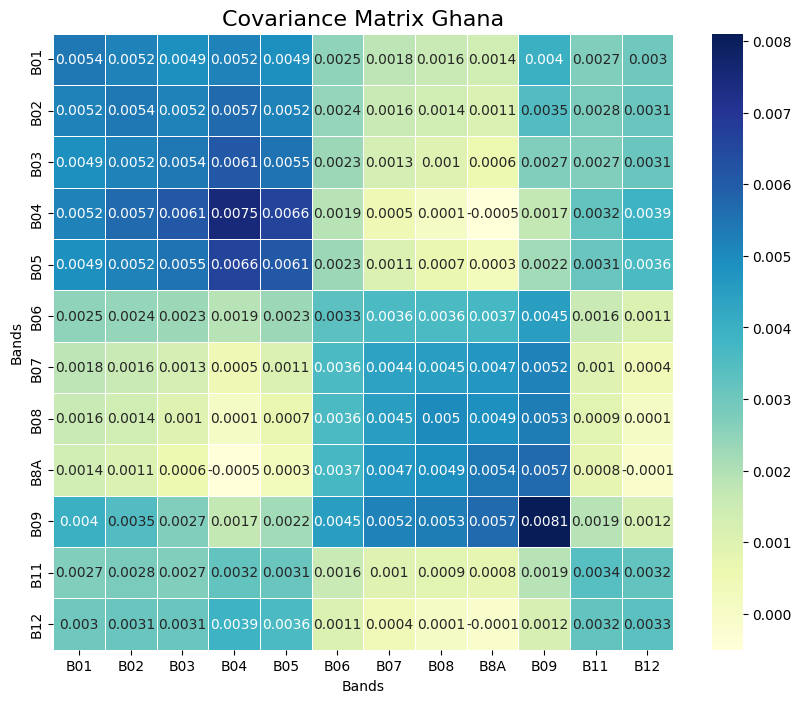
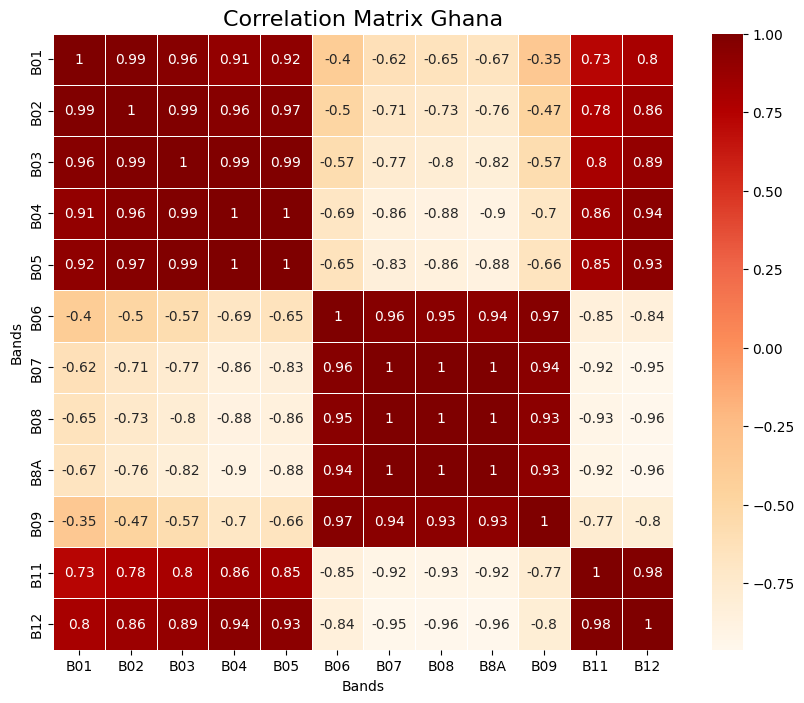
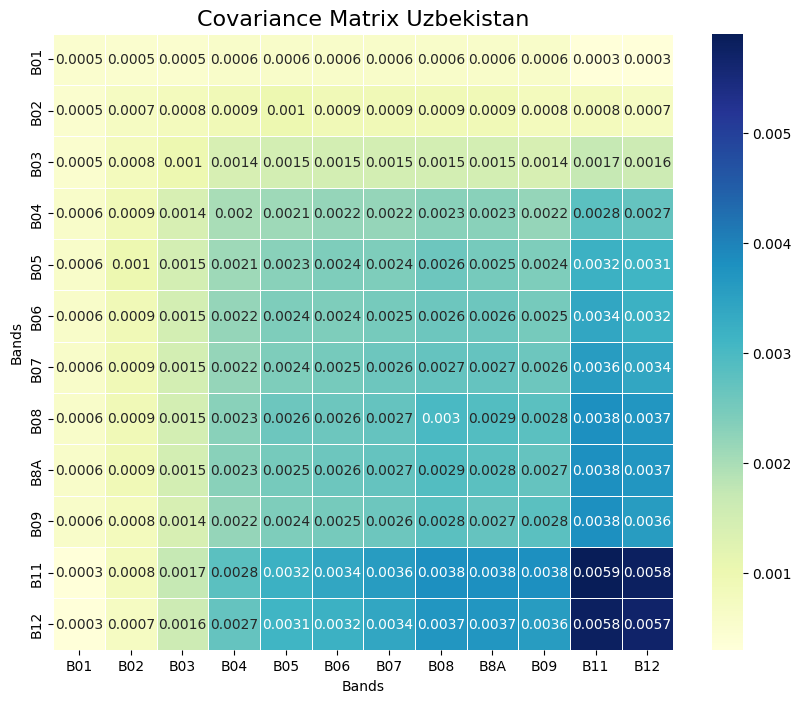
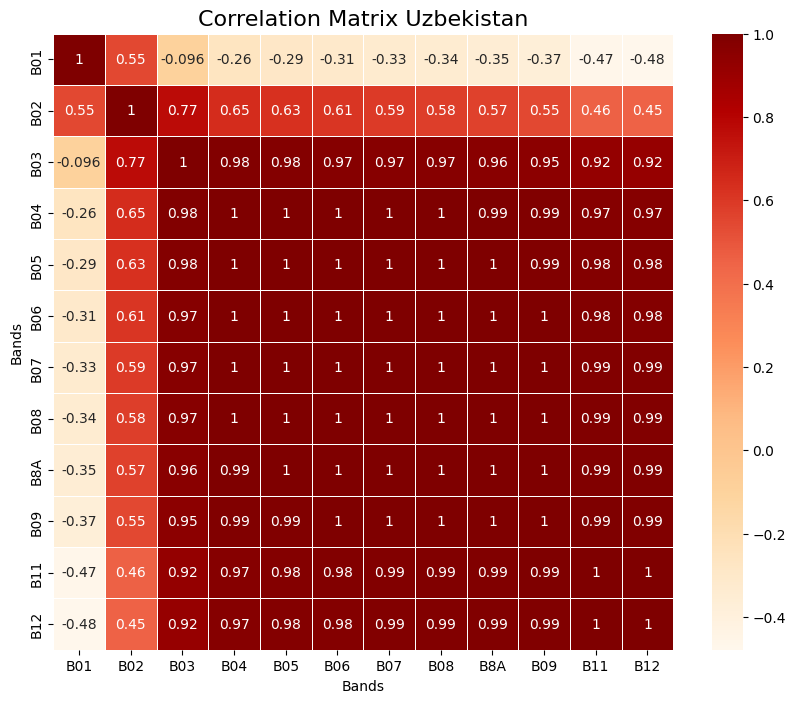
Covariance and Correlation Matrixes
Conclusion: The Power of PCA in Geospatial Analysis
PCA is a technique that offers a way to enhance satellite imagery and extract meaningful information from large datasets.
By using PCA in geospatial software, researchers and practitioners can gain insights into the spatial structures of the data, enabling more informed decision-making in various fields such as environmental monitoring, urban planning, and resource exploration.
As we face increasingly complex global challenges, techniques like Principal Component Analysis will be crucial in helping us understand and manage our world.
Did you like this post about Principal Component Analysis? Read more and subscribe to our monthly newsletter!

#Environment


Next article


This means establishing a reliable communication system, providing fast access to cloud applications, and establishing secure connections to data, even when teams are thousands of miles apart. For many businesses, expanding into new markets and territories is an exciting proposition. You get to access a new market of customers, an unexplored talent pool, and you get to make a bigger footprint on the world stage. All that sounds great on paper, but the realities of global expansion are far too often underestimated.
Going global is as much an infrastructure problem as it is a marketing or sales one. When a company has offices in New York, London, Berlin, and Singapore, its challenge isn’t just finding ways to hire staff compliantly or finding new office space. They need to ensure that those teams can work together effectively, as if they were all in the same building.
Why Expansion Creates Infrastructure Headaches
With every new office, warehouse, or field site a business adds, the level of complexity increases. A local setup that works well in one country likely doesn’t scale across borders.
All of a sudden, you will be juggling things like dramatic variations in internet speed and quality across regions, different compliance rules, teams that need to access the same apps and data simultaneously, and a massively increased risk of downtime that only becomes more costly as you grow.
The larger the footprint, the more challenging it is to keep everything connected. While global supply chains or talent pools often get the spotlight, the truth is that network and digital infrastructure quietly make or break expansion.
Why Traditional Networks Fall Short
For decades, companies have relied on MPLS (Multiprotocol Label Switching) or some other version of a private line to connect their offices. This made sense at the time, since these networks are generally secure and predictable. However, as remote work has grown and companies have become more global, this tech has started to show its age. Some of the most significant issues include:
- High costs: Private lines are notoriously expensive, especially when multiple countries and regions are factored into the mix.
- Slow setup: Installing new circuits can take weeks or even months. This is far from ideal if you’re trying to rush into a new market.
- Rigid design: Once they’re built, these systems are complex to change. Adding new branches often means reconfiguring the entire system, and that is not what you want when you’re an ambitious company looking to scale.
- Weak cloud integration: MPLS was designed in a pre-cloud era, and traffic usually has to backhaul through a central hub before reaching SaaS apps or cloud services. This slows down performance.
Now imagine you’re opening a new office in Europe, or setting up a field site in a new country. If you’re sitting around waiting weeks for a private line to be installed, you may have already missed the business opportunity or fallen behind to competitors. Even if you do get it live in time, performance is far from guaranteed, and your team may face long delays when using cloud apps.
The New Infrastructure Toolkit
The companies that find success when going global aren’t just the ones with the most substantial resources or the ability to source the best talent. They’re the ones who take infrastructure seriously from the beginning. Here’s a look at the modern toolkit that can make global expansion much more seamless:
Smarter Network Connections
The most significant shift in recent years has been moving away from those expensive, inflexible private lines toward more intelligent networking approaches. Instead of being locked into a single connection type, modern businesses are exploring software-defined networking that can utilize any available local internet connections and integrate them intelligently.
This approach is known as SD-WAN, and it puts innovative software in control of routing your data. Think of it like having an automated traffic controller who knows exactly where everything needs to go and the fastest way to get it there.
Cloud-Native Security That Travels With You
Security used to mean building a fortress around your office network, but that doesn’t work when your “office” spans multiple continents. The new approach treats every user and device as potentially untrustworthy until proven otherwise, regardless of their location.
Cloud-based security platforms can enforce the same policies whether someone is logging in from your headquarters in Chicago or a co-working space in Bangkok. They also adapt to local requirements automatically, which is a big help when it comes to meeting compliance frameworks.
Edge and IoT for Real-Time Operations
Another significant piece of the global infrastructure puzzle is determining how to handle real-time data, which is absolutely vital for modern teams to operate at their full potential.
This is where edge computing and IoT devices play a role. These technologies process your information closer to the source where the data is generated. This means companies can avoid the lag involved when sending everything back to a single data center. The main benefit here is that decisions can be made much faster, which is crucial when you’re operating across different time zones and geographies.
Cloud Platforms That Scale With You
For many global businesses, the cloud has become their main lifeline. But it’s a mistake to think that the cloud will automatically solve all of your geographic challenges. The truth is that not all cloud providers are the same, and every region has a different level of infrastructure support.
When going global, it’s important to remember that geography still matters, even when using the cloud. You want to find providers that have data centers distributed globally, but located near your operations. This reduces latency by keeping data closer to the users who need it. It also helps with regulatory requirements since some countries mandate that sensitive information be stored locally.
Final Word
It’s tempting to think that technology has erased borders, especially with everything now living “in the cloud.” But that’s simply not the case. At least not yet. The reality is that geography still matters more than most people realize.
The companies that thrive globally don’t just throw money at the problem or hope their current setup will work everywhere magically. They plan their infrastructure as carefully as they plan their market entry strategy. With the right combination of intelligent networking, cloud-native security, and distributed platforms, going global doesn’t have to mean going broke or going slow.
The decisions you make early on will either fuel your expansion or become expensive roadblocks down the line. Get it right from the start, and the world really can become your office.

