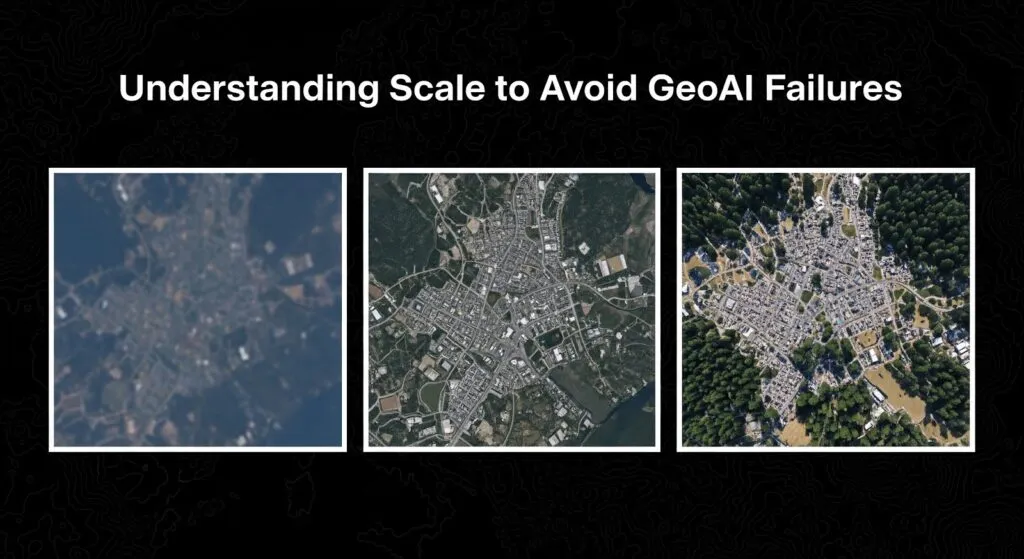

Imagine a model trained using ultra-high-resolution drone imagery over a small farming village. At this scale, objects like cars or tractors occupy thousands of pixels. The model learns fine details, wheels, edges, textures, and performs flawlessly. When the same model is later applied to satellite imagery covering an entire state, those same objects collapse into a few blurry pixels. The data is still correct, but the visual patterns the model learned no longer exist. This is a well-known failure mode when training on drone data and inferring on satellite imagery.
This happens because models do not learn objects in the abstract. They learn what objects look like at a specific resolution, extent, and aggregation level. Changing the scale changes the patterns, a challenge that shows up repeatedly when building and deploying geospatial AI datasets and large-area spatial mapping systems.
Scale errors are not limited to imagery. During the 2003 SARS outbreak, case data concentrated in Toronto and Vancouver were reported at the national scale. When aggregated to the country level, Canada appeared uniformly affected, triggering a nationwide travel advisory. The data itself was accurate, but the scale was wrong, as documented in SARS case reporting in Canada and later summarized in policy briefings on SARS and COVID-19. The economic cost exceeded one billion dollars.
Scale acts like a filter. Zoom out too far, and the dangerous local variation disappears. Zoom in too far, and the broader structure is lost. In geospatial AI, this is not a visualization issue. Scale directly determines what a model can and cannot learn, a point emphasized throughout AI for spatial mapping and analysis.
This article explains why scale is a decisive factor in geospatial AI. It shows how the same data can lead to different conclusions at different scales, why machine-learning models amplify scale errors, and how scale mismatches turn technical choices into real-world decision failures. It is written for geospatial practitioners, data scientists, and planners who want to understand how scale shapes model behavior, interpretation, and impact.
What “Scale” Really Means in Geospatial Analysis?
In geospatial analysis, scale is the lens through which both humans and models see the world. It defines the relationship between what is represented on a map and what exists on the ground. In GeoAI, it determines what information is visible, what gets averaged away, and what a model is physically capable of learning.
One component of scale is spatial resolution, the size of a single pixel on the ground. A 30-centimeter image can capture cars and trees, while a 30-meter image can only represent entire blocks or forests. Anything smaller than a pixel is invisible to the model, which is why understanding imagery resolution matters for how data behaves when zooming and resampling.
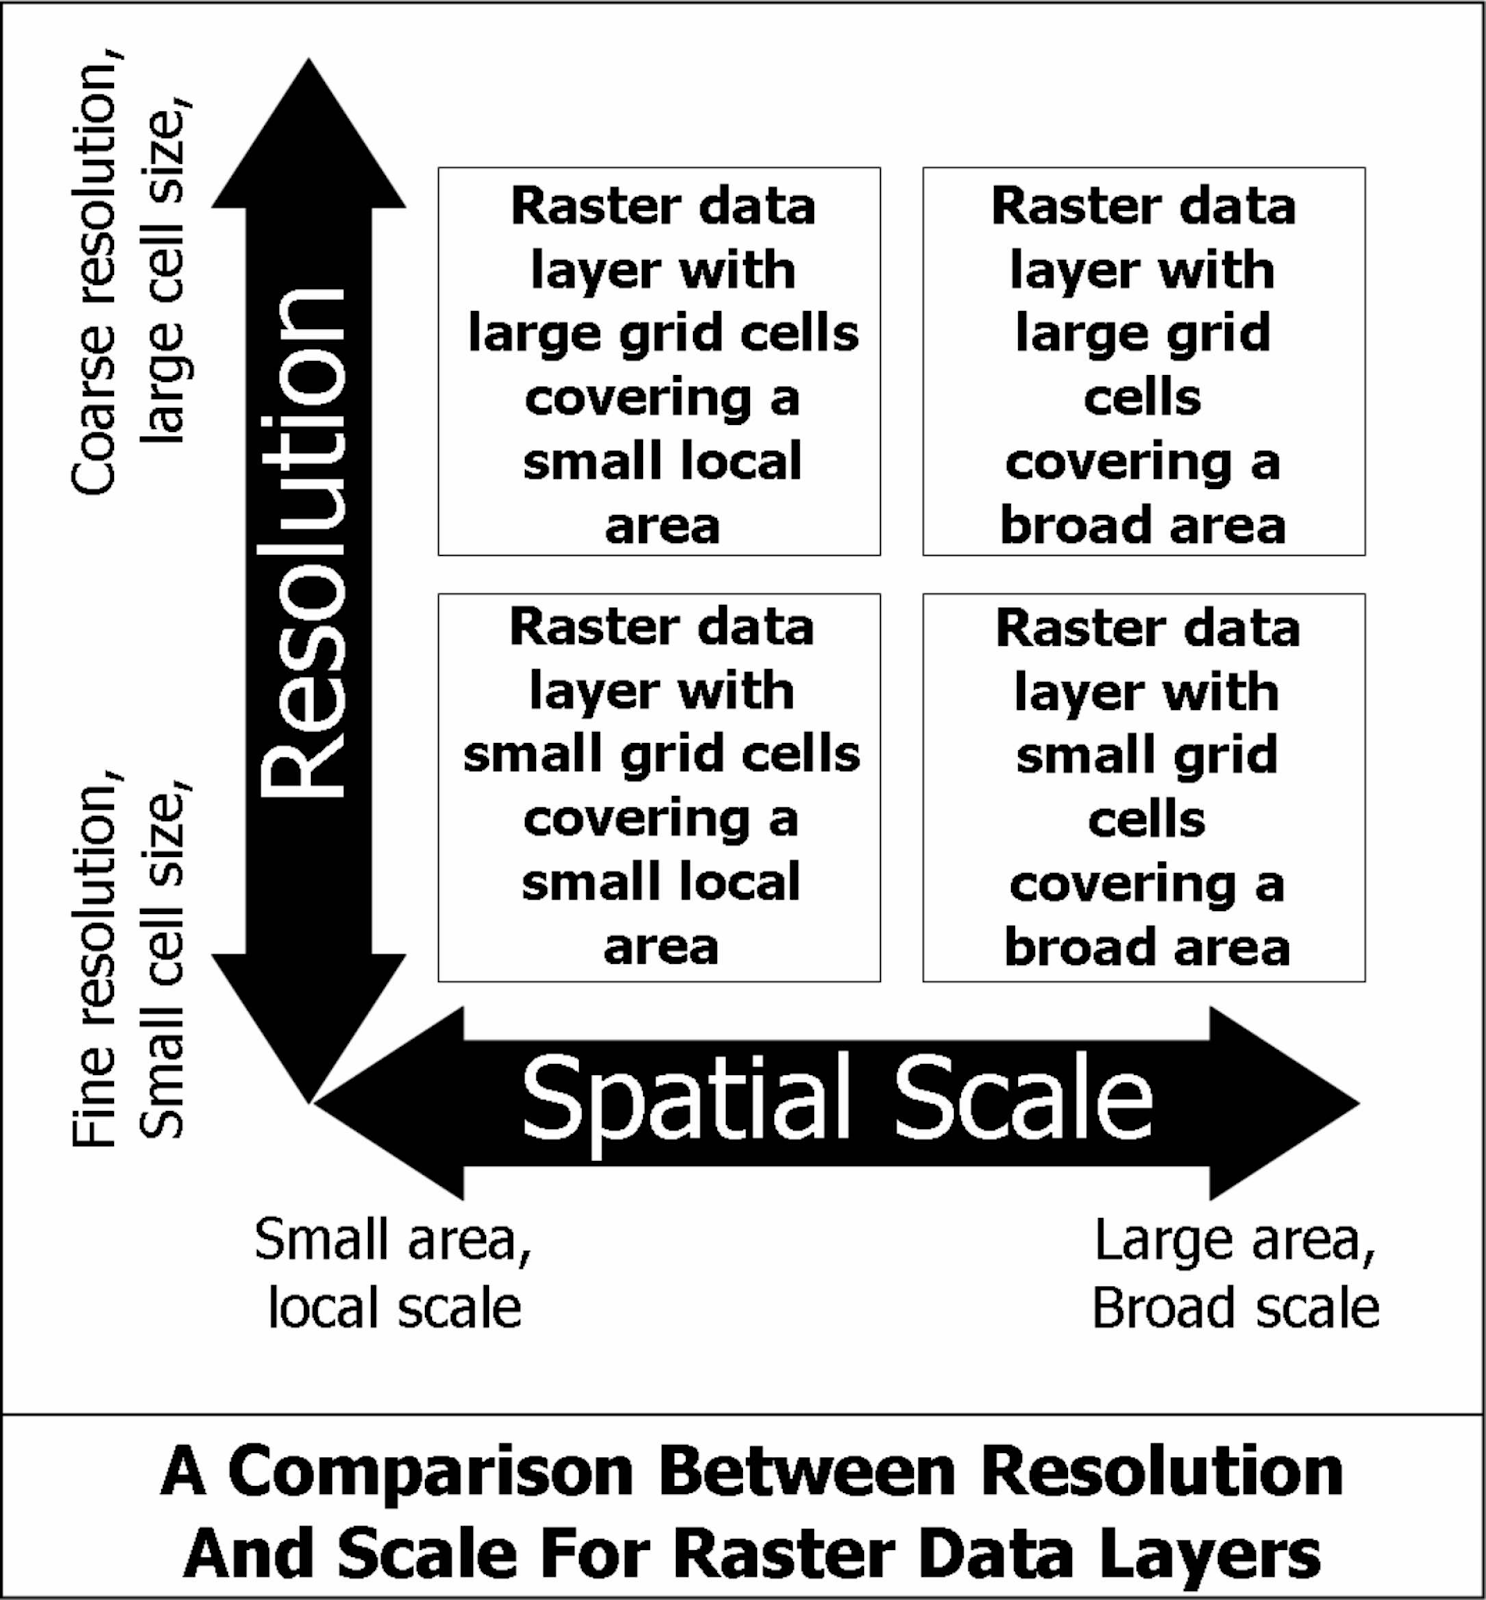
Source: GIS in Ecology
Another component is aggregation, the act of grouping fine-grained data into larger units. House-level data may be aggregated into blocks, neighborhoods, or cities. Each choice changes the result by smoothing local extremes and emphasizing broader patterns; scale and resolution in GIS fundamentally shape analytical outcomes.
Scale also includes extent, the total area being analyzed. A single building dominates the view at the street scale but becomes insignificant at the continental scale. Models trained on small extents often fail when applied to larger ones because the spatial context changes.
Finally, there is decision scale, the level at which a human needs an answer. A mayor decides at the neighborhood scale, an insurer at the parcel scale, and a climate scientist at the regional or global scale. GeoAI systems fail when the model operates at one scale while decisions must be made at another.
A common mistake is to treat scale as a visualization choice. In reality, scale is a modeling decision. Choosing a scale means deciding what counts as signal and what is discarded as noise. While maps allow endless zooming, the data itself always has a fixed resolution, and no amount of zoom can recover detail that was never captured.
Example: Same Data, Different Answers
A clear way to see how scale alters conclusions is through the Modifiable Areal Unit Problem (MAUP). The idea is simple: the outcome of a spatial analysis can change purely because of how the same data is grouped.
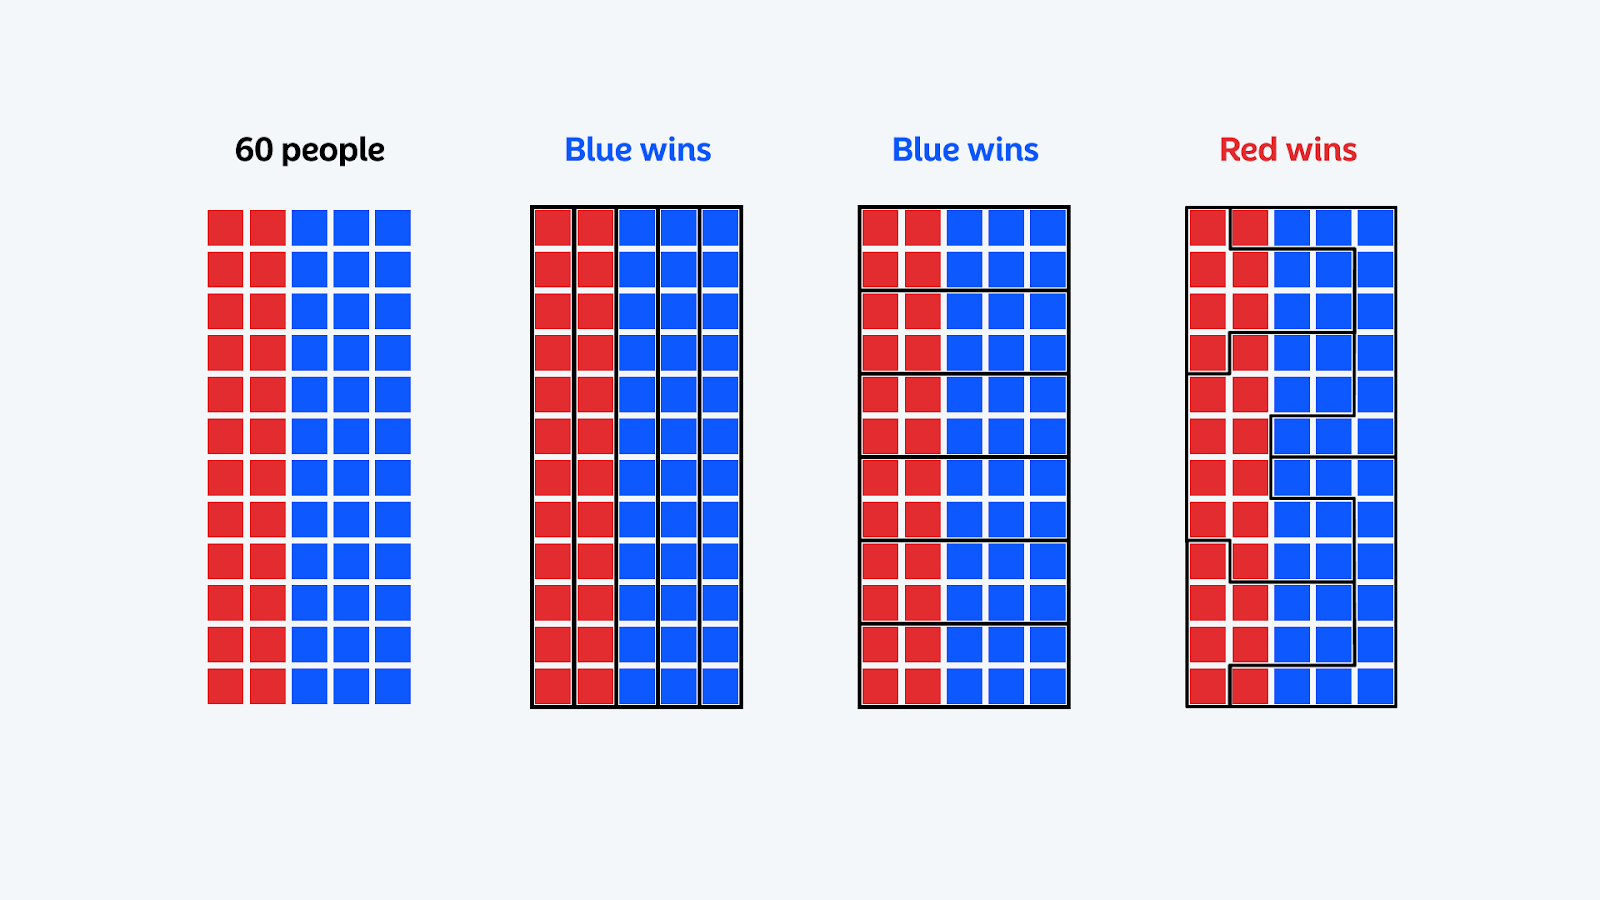
Source: Atlas
Imagine a city where you want to understand whether the education level is related to income. You have data for 1,000 people, each with years of schooling, income, and a location. At the individual level, people vary widely, and noise dominates, so any direct relationship is weak.
Now introduce a hidden spatial structure. Some neighborhoods are simply more prosperous than others. Income is influenced mostly by this neighborhood context, and only weakly by individual education. This reflects how many real cities work.
The code below demonstrates this effect. It generates synthetic people distributed across space, adds a smooth neighborhood-level prosperity gradient, and then measures the same relationship at three different spatial scales.
Output:
Individual level: 0.020
Neighborhood scale: 0.128
District scale: -0.266
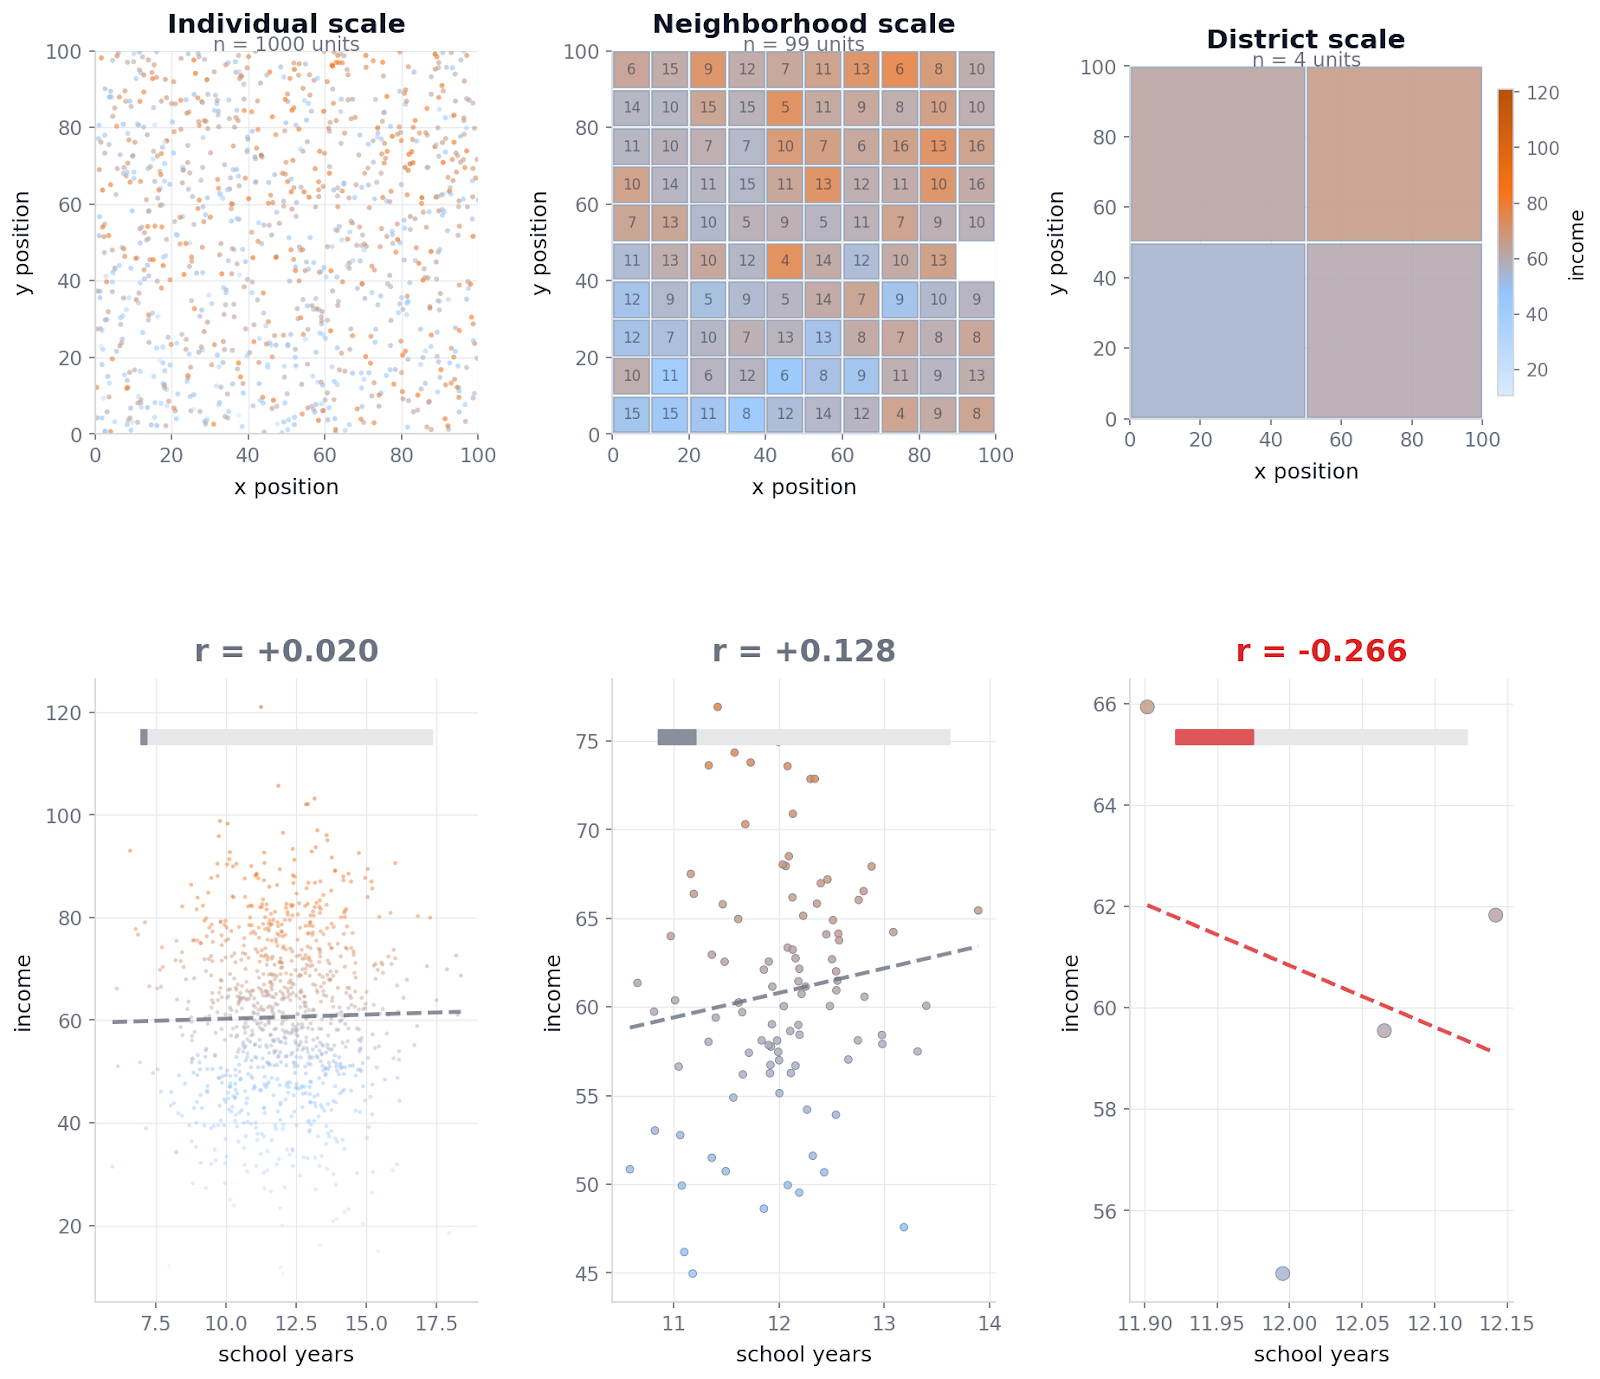
At the individual level, the relationship between education and income is essentially zero. After aggregation, the same data produces different answers. At the neighborhood scale, a weak positive relationship appears. At the district scale, so much noise has been cancelled by averaging that the remaining signal overwhelms everything, and the correlation flips sign entirely.
None of these values represent a stable truth. They are artifacts of how the data is grouped. This is the MAUP in practice. Aggregation reshapes variance, suppresses local differences, and can both exaggerate and invert statistical relationships. The input data does not change. Only the scale does.
If a decision-maker relies on a single aggregation level, they risk acting on a pattern that disappears or reverses when viewed differently. This is why scale must be tested, not assumed. Scale does not add information. It redistributes it.
Why AI Models Amplify Scale Problems?
AI models learn patterns exactly as they appear at the scale they are trained on. Unlike humans, they do not adapt intuitively when resolution, aggregation, or spatial context changes, which makes scale problems more severe in AI systems than in manual analysis.
Most models are highly sensitive to pixel size and texture. When scale changes, features blur, merge, or disappear, and the learned representation no longer matches reality. At the same time, aggregation smooths away local extremes, meaning rare but critical conditions vanish from the input entirely. This is why local variation is smoothed by aggregation, hiding the most important signals.
Another common failure occurs when training and deployment operate at different scales. Models built using expensive, high-resolution data frequently collapse when applied globally on coarser inputs, a pattern reported in geospatial dataset design.
Because AI systems produce confident outputs even when scale assumptions are violated, these errors are amplified rather than flagged. Scale mistakes become fast, precise, and expensive.
Scale in Real-World Decisions
Scale errors in geospatial AI are not abstract technical issues. They directly affect who gets protected, who pays more, and who is exposed to risk.
Flood risk is a clear example. Most official flood assessments operate at the basin or watershed scale, which works for rivers but often fails individual households. Tools like the USGS Integrated Flood Risk Management framework and recent flood exposure research show how strongly outcomes depend on local elevation and drainage, and how coarse-scale models can miss building-level risk.
Urban heat follows the same pattern. City-wide temperature averages hide extreme conditions at the block and household scales. Work on AI and GIS for urban forestry and heat mitigation and fine-grained heat vulnerability mapping shows how temperatures can vary within short distances. Programs like Sunny Lives use building-level characteristics (like roof material) to target the households most at risk.
Insurance decisions are even more sensitive to scale. Traditional underwriting relied on ZIP codes or parcel centroids, but high-precision location data for insurance shows large risk differences within a single parcel. Moving to parcel-level underwriting intelligence and location-based risk pricing supports fairer pricing and avoids excluding entire communities, a shift now central to data-driven underwriting strategies.
Across floods, heat, and insurance, the lesson is consistent: when scale is too coarse, decisions become wrong.
Making Scale Explicit, Not Invisible
Scale is one of the most powerful variables in geospatial AI, yet it is often treated as an afterthought. Model accuracy is only meaningful at the scale the model was designed for. When scale changes, performance does not slowly degrade. It often breaks.
Good practice starts with clarity. Always state the scale a model is valid at, and never apply it outside that range without testing. Just as important, the model’s scale must match the scale of the decision being made. City-level averages cannot safely guide building-level actions.
Scale should also be treated as a design choice from day one. It shapes what data is collected, what patterns a model can learn, and where it will fail. Testing across scales is not optional. It is the only way to know whether a model is robust or fragile.
As geospatial AI moves from maps to decisions, scale becomes the hidden structure behind every result. Ignoring it leads to confident but misleading outputs. Designing for it leads to systems that can be trusted.
How do you like this article? Read more and subscribe to our monthly newsletter!


#Contributing Writers


Next article


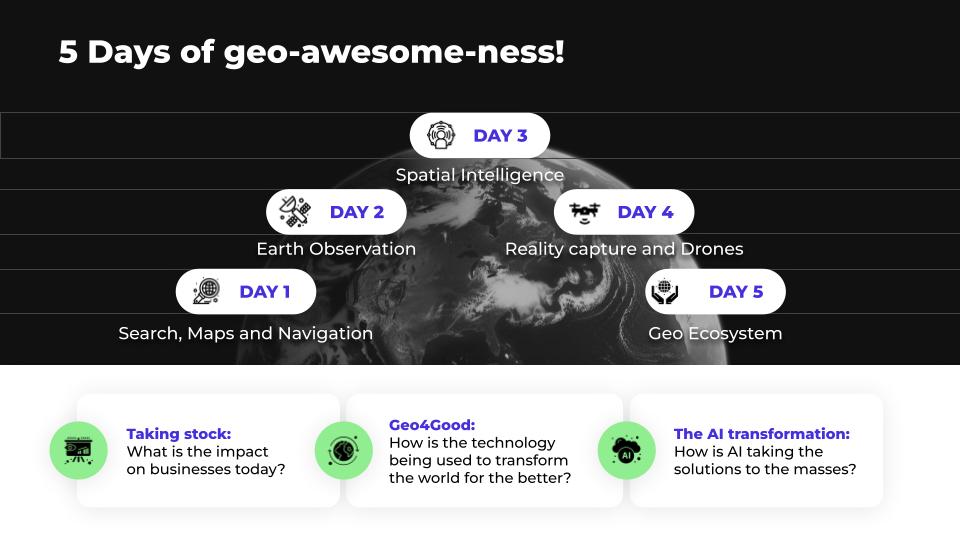
In exactly two months on April 20, 2026 we kick off The Next Geo by Geoawesome: a five-day virtual-first global summit (with local meetups worldwide) for people who want geo to close the opportunity gap and deliver measurable real-world impact.
20th April also marks 15 years of Geoawesome and instead of looking back, we’re using the moment to ask a forward-looking question: are we closing the gap between what the geo sector offers today and what the world needs?
What to expect
We’re keeping the live program focused: 2–4 hours of live sessions per day, plus a curated library of recorded talks you can watch on your schedule. Across the week, we’ll dive into five themes:
-
Maps, Navigation & Search
-
Earth Observation
-
Spatial Intelligence
-
Reality Capture & Drones
-
The Geo Ecosystem (startups, careers, community)
Digital-first, locally connected
The summit is fully virtual but we’re also planning local community meetups in cities worldwide during the same week, so online conversations turn into real connections. Munich, Berlin, Seefeld in Germany, Australia, US and hopefully a couple of other cities as well.
Not just talks: an outcome
We’ll capture the sharpest insights, tensions, and takeaways from the week and turn them into a shared Geo 2030 Vision Report a community snapshot of where geo is headed, and what needs to change to get there.
Join us
Want to speak, sponsor the event, host a local meetup, or help shape the agenda? Email us at muthu@geoawesome.com.
See you on April 20 🙂

