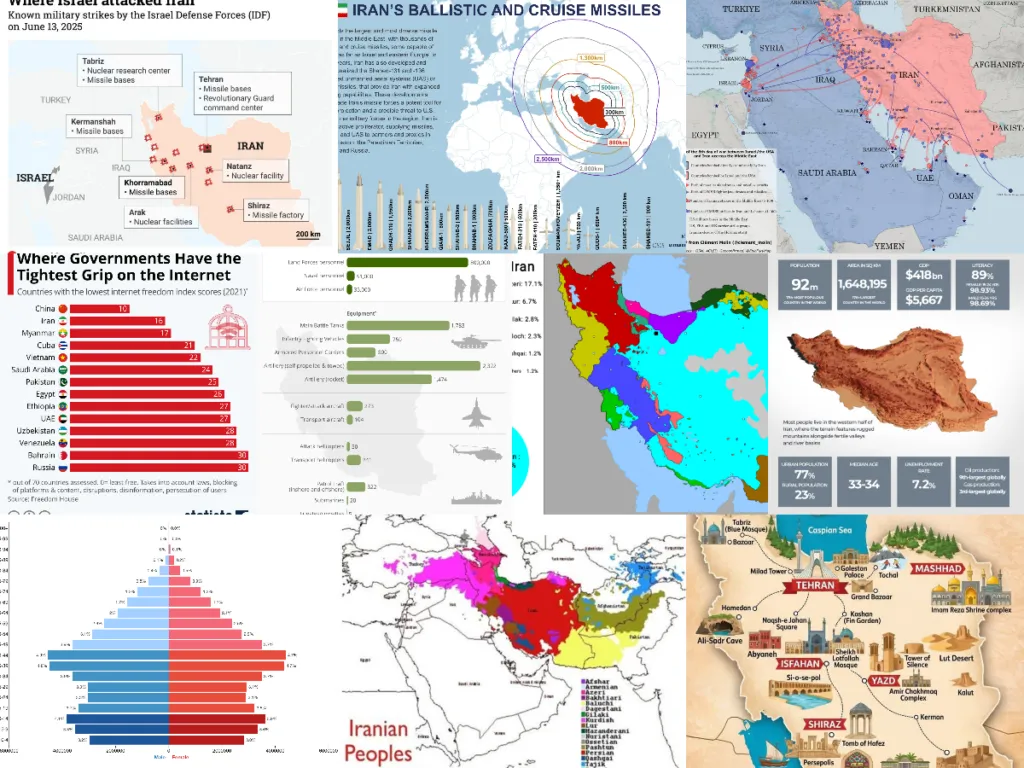

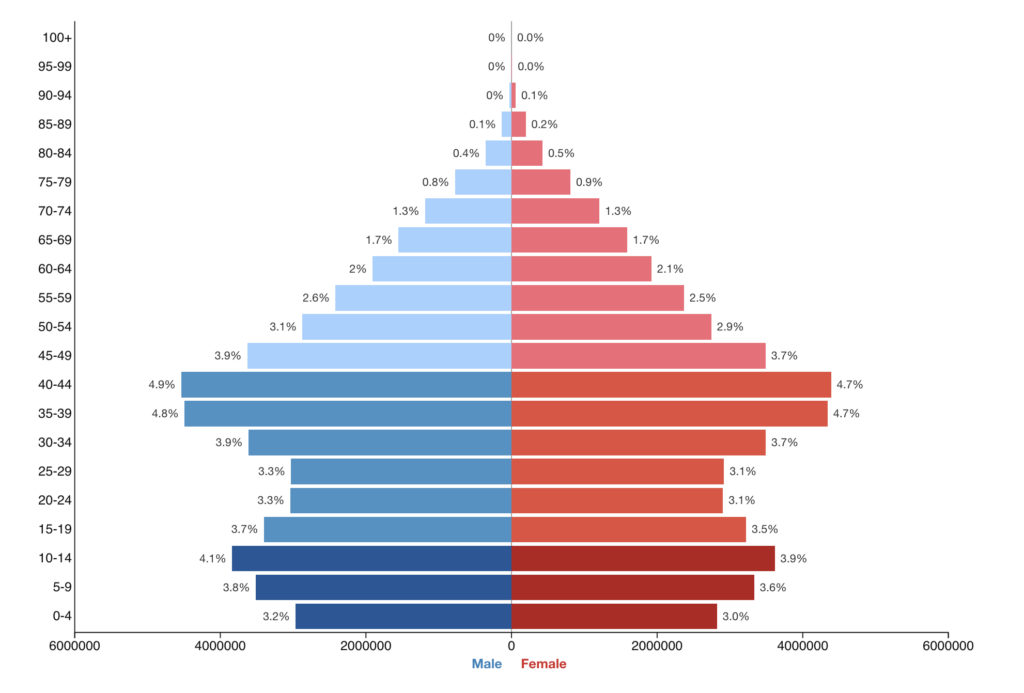
1. Iran at a glance
With a population of roughly 92 million people, Iran is one of the largest countries in the Middle East and ranks among the top twenty countries globally by both population and land area. Iran’s nominal GDP is approximately $418 billion, placing it around 36th in the world by economic size. Despite economic pressure from sanctions, the country maintains a relatively moderate unemployment rate of about 7.2 percent.
Iran also has a high literacy rate, with around 89 percent of adults able to read and write, while youth literacy approaches 99 percent. However, educational outcomes still vary between urban centers and rural regions. The country possesses vast hydrocarbon resources. Iran is among the world’s largest energy producers, ranking ninth globally in oil production and third in natural gas production, making energy exports a central pillar of its economy.
source: Al Jazzera
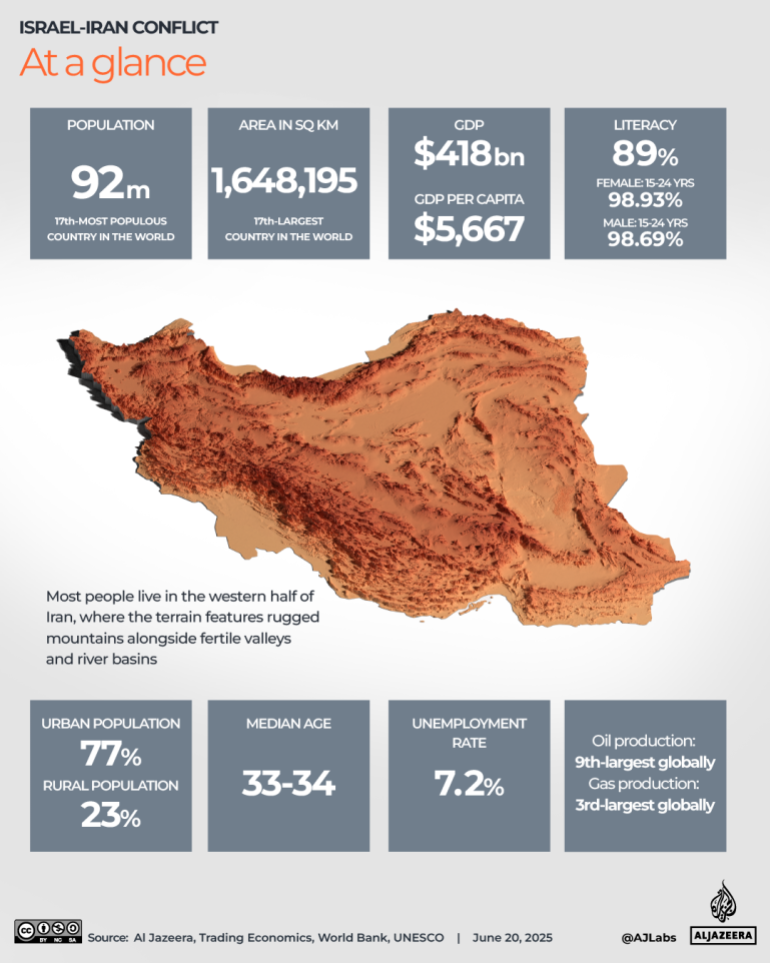
2. How big is Iran?
Located in Western Asia, Iran is the second-largest country in the Middle East after Saudi Arabia and the 17th-largest country in the world, covering approximately 1.65 million square kilometres (636,000 square miles). Iran shares land borders with seven countries. Its longest border is with Iraq, followed by Turkmenistan, Afghanistan, Pakistan, Azerbaijan, Türkiye, and Armenia, reflecting its strategic position at the crossroads of the Middle East, Central Asia, and the Caucasus.
To put its size into perspective, Iran’s territory is about one-sixth the land area of the United States and is roughly comparable in size to the U.S. state of Alaska. Globally, Iran is about one-sixth the size of Europe, around one-fifth the size of Australia, roughly half the size of India, and about 80 times larger than Israel, illustrating the scale of the country within the Middle Eastern region.
source: Al Jazzera
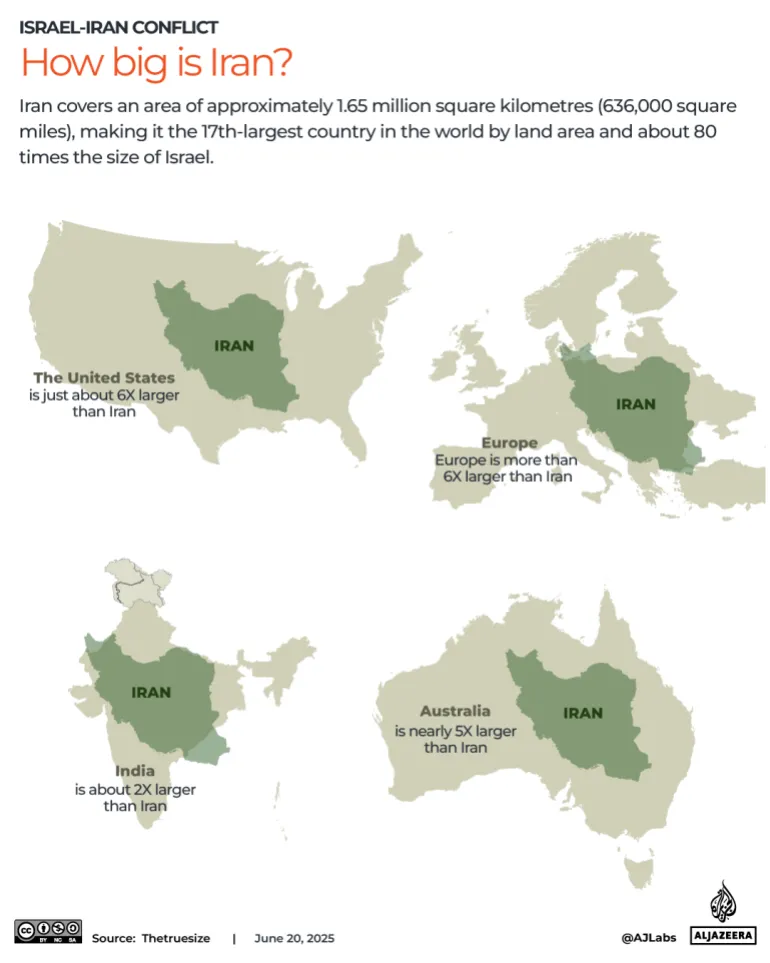
3. Demographics of Iran
Iran has a relatively young population. Nearly 60 percent of Iranians are under the age of 39, according to data from the United Nations Statistics Division. The country’s median age is around 33–34 years, reflecting a society shaped largely by the post-revolutionary era. At the same time, about 77 percent of the population lives in urban areas, highlighting the strong shift toward city-based economies and lifestyles.
The largest age cohorts are those aged 30–34 and 35–39, meaning a significant share of the population was born after the 1979 Islamic Revolution, which overthrew the Pahlavi monarchy and reshaped Iran’s political and social system.
In recent years, however, Iran has experienced notable emigration of educated professionals, driven largely by economic pressures, limited career opportunities, and political uncertainty. This “brain drain” has become an important demographic and economic challenge for the country.
source: Wikipedia
4. What are Iran’s ethnicities?
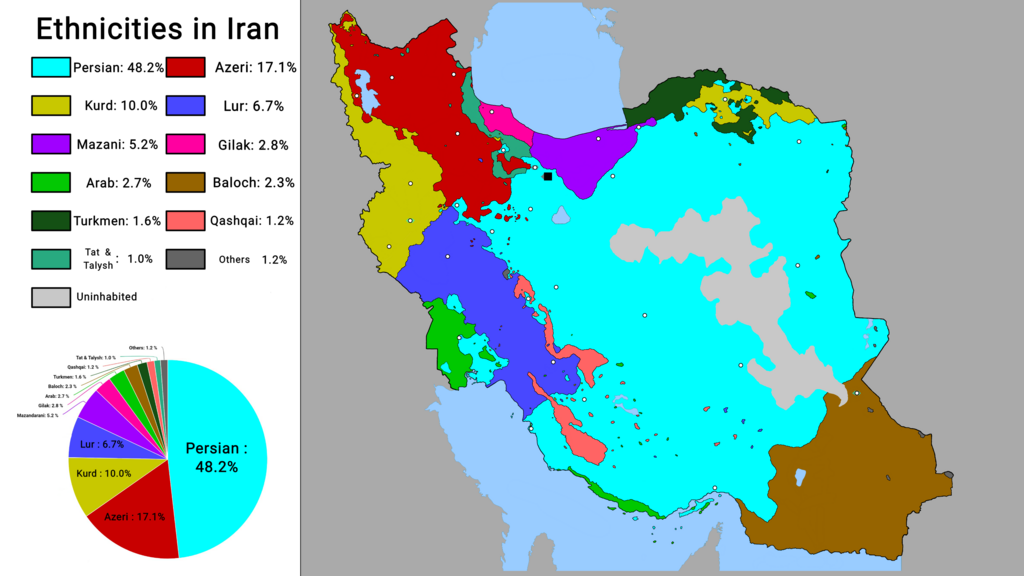
Iran is an ethnically and culturally diverse country. Persians make up about 61 percent of the population, while several large minority groups contribute to the country’s social fabric. These include Azerbaijanis (around 16 percent) and Kurds (about 10 percent), along with Lurs (6 percent), Arabs (2 percent), Baloch (2 percent), and other Turkic groups (around 2 percent).
Religiously, Iran is predominantly Shia Muslim, with about 90 percent of the population following Shia Islam, which is also the official state religion. Sunni Muslims and other Muslim sects account for roughly 9 percent of the population.
The remaining about 1 percent belongs to recognized religious minorities, including approximately 300,000 Baha’i, 300,000 Christians, 35,000 Zoroastrians, 20,000 Jews, and around 10,000 Sabean Mandeans, according to data from the Minority Rights Group. These communities represent some of the oldest religious traditions in the region.
source: Wikipedia
5. Top tourist attractions in Iran
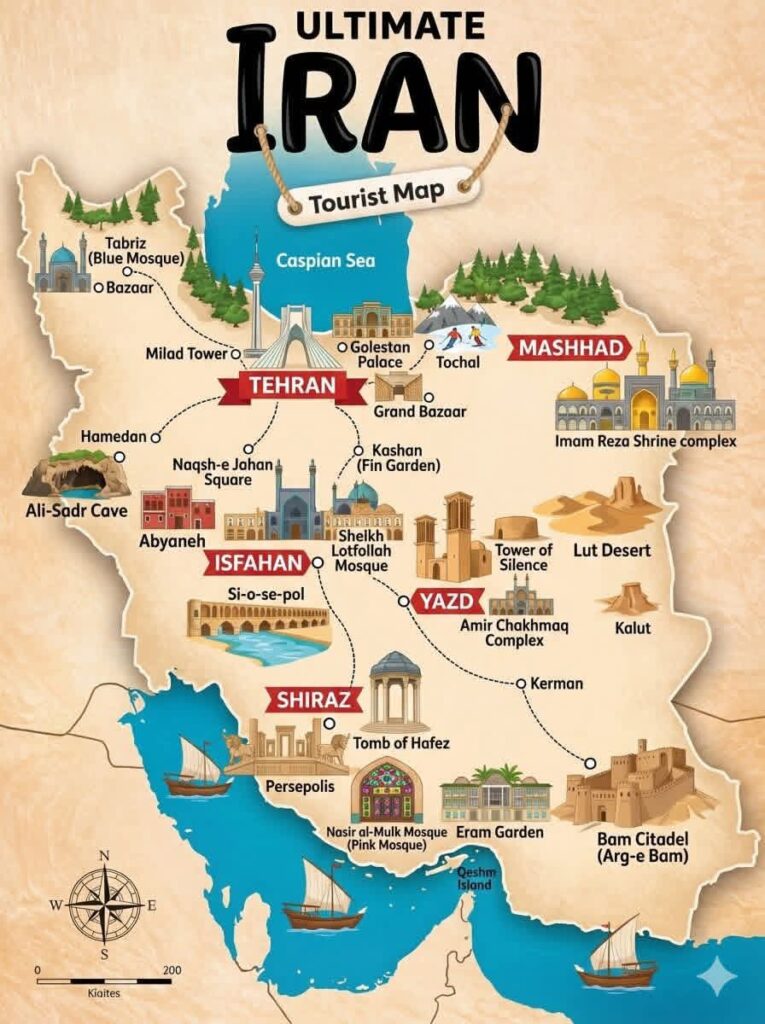
Iran offers a rich mix of historical cities, ancient ruins, religious sites, and natural landscapes that reflect more than 2,500 years of Persian civilization. Some of the country’s most famous destinations include Tehran, the modern capital and political center; Isfahan, known for its Safavid-era architecture and the monumental Naqsh-e Jahan Square; Shiraz, famous for Persian poetry, gardens, and nearby ruins of Persepolis, the ceremonial capital of the ancient Persian Empire.
Other important cultural destinations include Yazd, a desert city known for its windcatchers and Zoroastrian heritage, and Mashhad, home to the Imam Reza Shrine, one of the holiest pilgrimage sites in Shia Islam. Historic towns such as Kashan preserve classic Persian garden architecture, while sites like the Bam Citadel illustrate Iran’s long history along the Silk Road.
Iran’s natural landmarks are equally diverse. The Lut Desert, one of the hottest places on Earth, features dramatic rock formations and vast sand dunes, while mountainous areas such as Tochal near Tehran attract visitors for skiing and hiking. Along the Persian Gulf coast, islands such as Qeshm offer unique geological landscapes and marine ecosystems.
Together, these destinations highlight Iran’s cultural depth, blending ancient Persian heritage, Islamic architecture, and diverse natural environments.
source: FB
6. Internet freedom in Iran
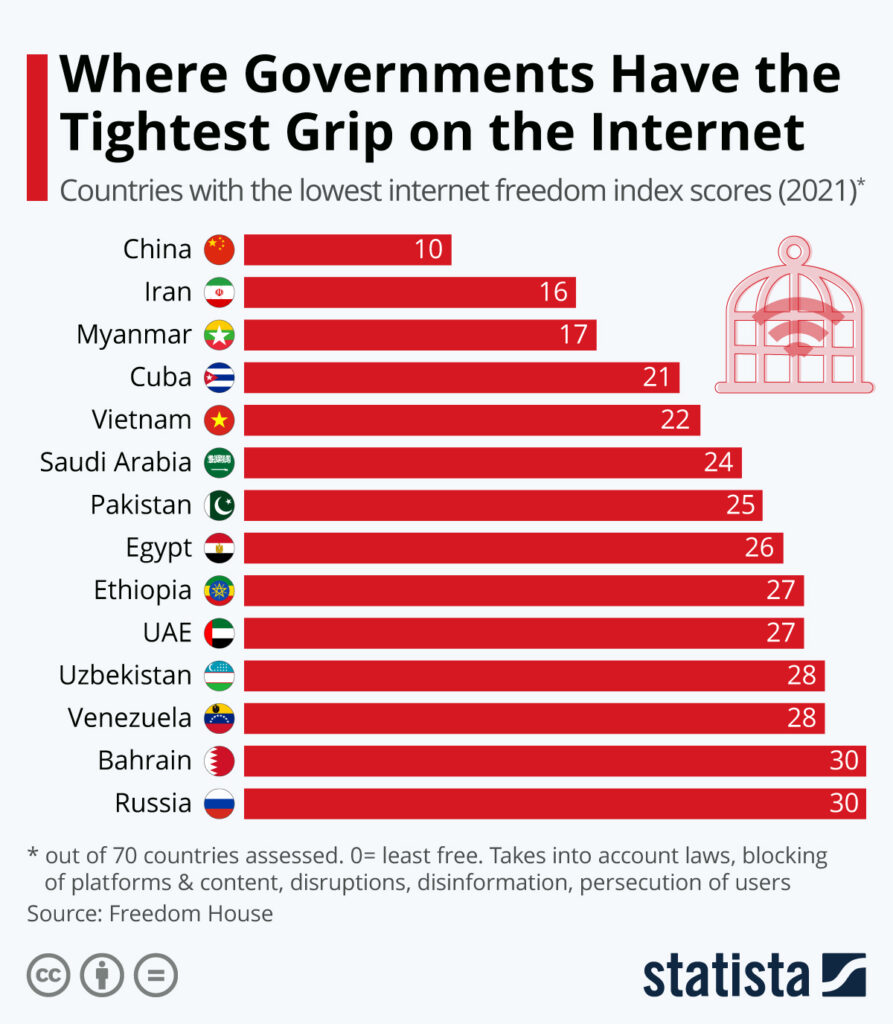
According to the Freedom House Freedom on the Net index, Iran is among the countries with the lowest levels of internet freedom in the world. In the 2025 report, Iran scored 13 out of 100, placing it firmly in the “Not Free” category and ranking near the bottom globally. Authorities heavily restrict access to the internet by blocking major platforms such as Facebook, YouTube, and X, filtering thousands of websites, and monitoring online activity. The government also promotes a domestic “National Information Network”, which allows tighter control over content and surveillance of users. Compared with most countries, Iran’s online environment is therefore highly restricted—only China scores lower in some global comparisons, highlighting the extent of state control over digital information and communication.
source: Freedom house
7. Iranian Diaspora Around the World
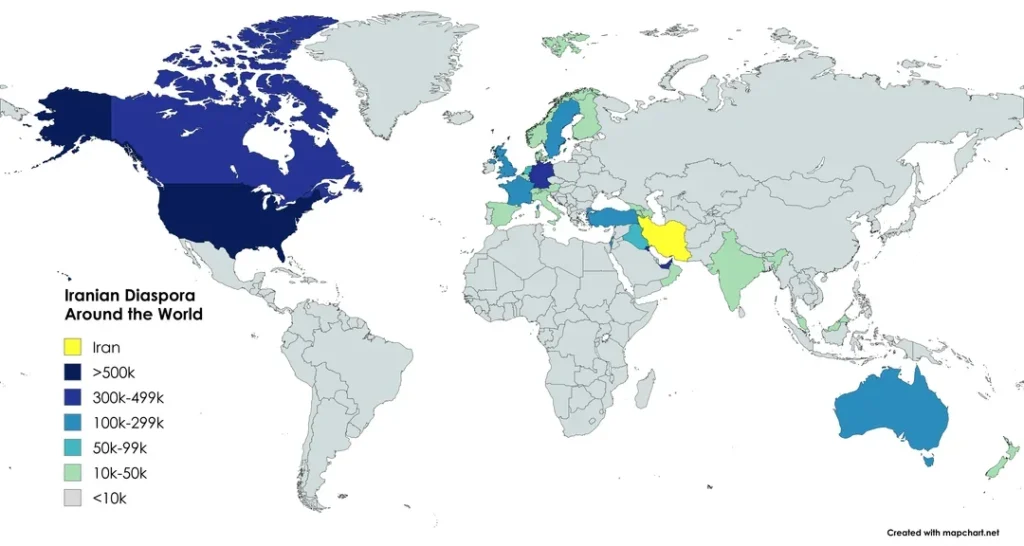
The map highlights the global distribution of the Iranian diaspora, which has grown significantly over the past decades due to political upheavals, economic challenges, and migration following the 1979 Islamic Revolution. The largest Iranian communities live in the United States and Canada, each hosting well over 500,000 people of Iranian origin. Significant populations are also found across Europe—particularly in Germany, the United Kingdom, and Sweden—as well as in Australia and the Gulf region. Many members of the Iranian diaspora are highly educated professionals working in fields such as technology, medicine, academia, and business. Today, the global Iranian community plays an important role in shaping international perceptions of Iran and maintaining cultural and economic ties between the country and the wider world.
source: Reddit
8. The Iranian Revolution: A timeline
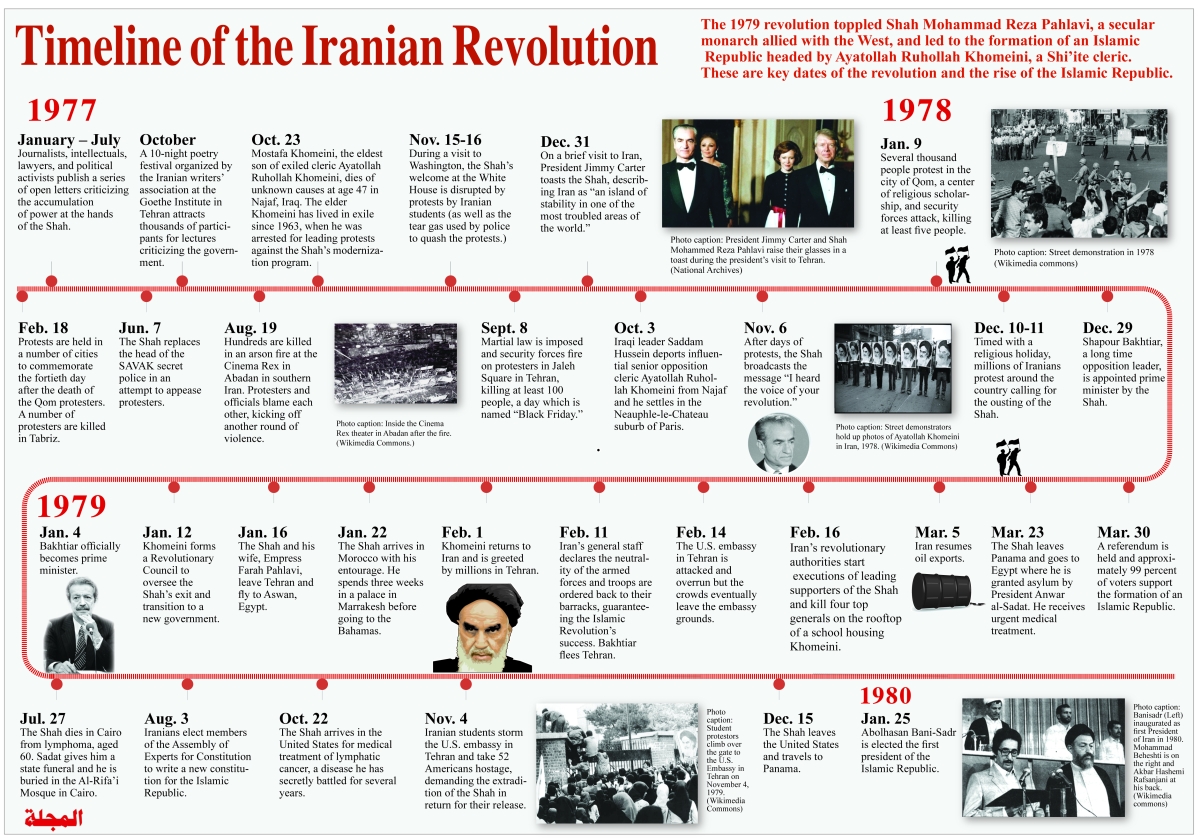
Key data/figures: 1979 revolution; 40+ years of post‑revolution state evolution.
Why it matters (context): Use this as the narrative “starting pistol”: the revolution remade Iran’s state ideology, foreign policy posture, and security institutions—setting the baseline for recurring confrontations with the US and key regional rivals. It frames later charts (sanctions, nuclear programme, proxy network) as downstream consequences of the post‑1979 system.
source: Al Majalla
9. Iran 1979–2025: A Timeline of Crises and Turning Points
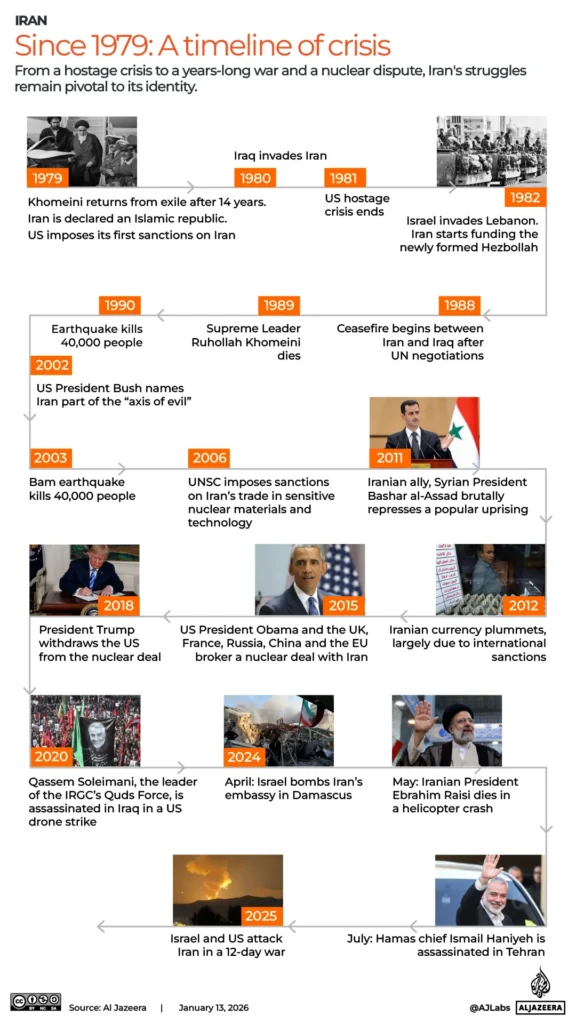
The Iran has faced recurring political, military, and economic crises since the Iranian Revolution established an Islamic republic. Soon after the revolution, tensions with the United States erupted during the 1979–1981 hostage crisis, followed by the devastating Iran–Iraq War that killed hundreds of thousands and militarized the country. In the decades that followed, Iran experienced repeated challenges including leadership transitions after the death of Ayatollah Khomeini, destructive earthquakes, waves of domestic protests, and escalating confrontation with Western powers over its nuclear program. From the 2000s onward, international sanctions and cyberattacks intensified pressure on Iran’s economy, while regional conflicts—especially its involvement in Syria and tensions with Israel and Gulf states—deepened geopolitical isolation. Periodic nationwide protests driven by economic hardship and political repression have further shaken the country, illustrating how internal unrest, sanctions, and regional rivalries have continuously shaped Iran’s political trajectory.
source: Al Jazzera
10. What is the status of Iran’s nuclear programme?
![]()
Over the past two decades, a series of milestones has brought Iran’s nuclear program to a critical moment. International concern intensified in the early 2000s as Iran expanded uranium enrichment, leading to sanctions and years of negotiations. In 2015, a landmark agreement between Iran and world powers temporarily restricted enrichment activities and introduced international inspections in exchange for sanctions relief. However, the framework gradually eroded after the United States withdrew from the deal in 2018 and Iran began expanding enrichment and stockpiling uranium beyond the agreement’s limits. By the mid-2020s, Iran had accumulated the technical capacity to approach nuclear-weapon “breakout” within a short timeframe. The timeline reaches a decisive point in 2025, when key mechanisms linked to the 2015 agreement—including the ability to automatically reimpose UN sanctions—approach expiration, forcing governments to decide whether to revive diplomacy, increase pressure, or risk further escalation around Iran’s nuclear ambitions.
source: LFI
11. GDP of Iran
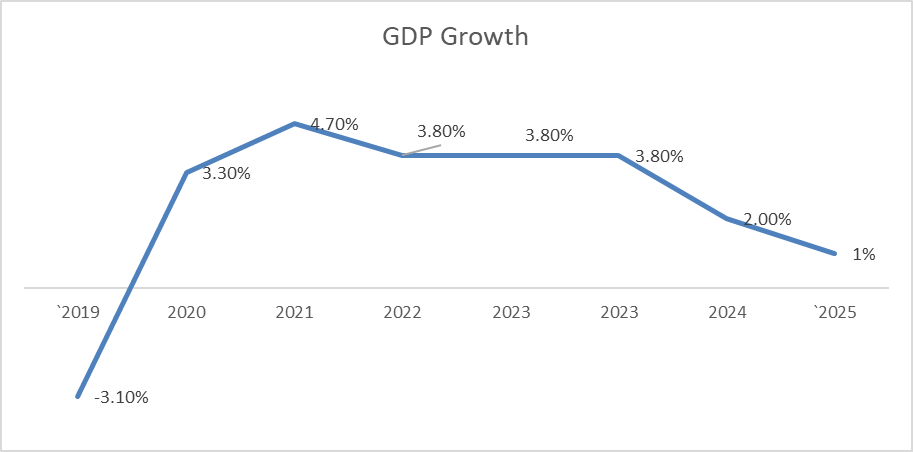
Iran’s economy has struggled in recent years under the combined pressure of international sanctions, high inflation, and structural economic weaknesses. According to analysis by the Clingendael Institute, Iran’s nominal GDP is expected to fall below $400 billion, reflecting weak economic performance and currency depreciation. While the economy recorded around 4 percent growth in local currency terms in the year ending March 2024, the value of the economy in U.S. dollars has largely stagnated due to the sharp decline of the Iranian rial. Structural problems such as large budget deficits, energy shortages, corruption, and lack of investment continue to constrain growth, while sanctions remain the most important external factor limiting trade, financial access, and foreign investment. Despite these challenges, the economy shows some resilience thanks to its diversified structure: the service sector contributes more than half of GDP, while petroleum accounts for about 16 percent, highlighting Iran’s continued reliance on energy exports.
source: Clingendael
12. Iran’s crude oil production
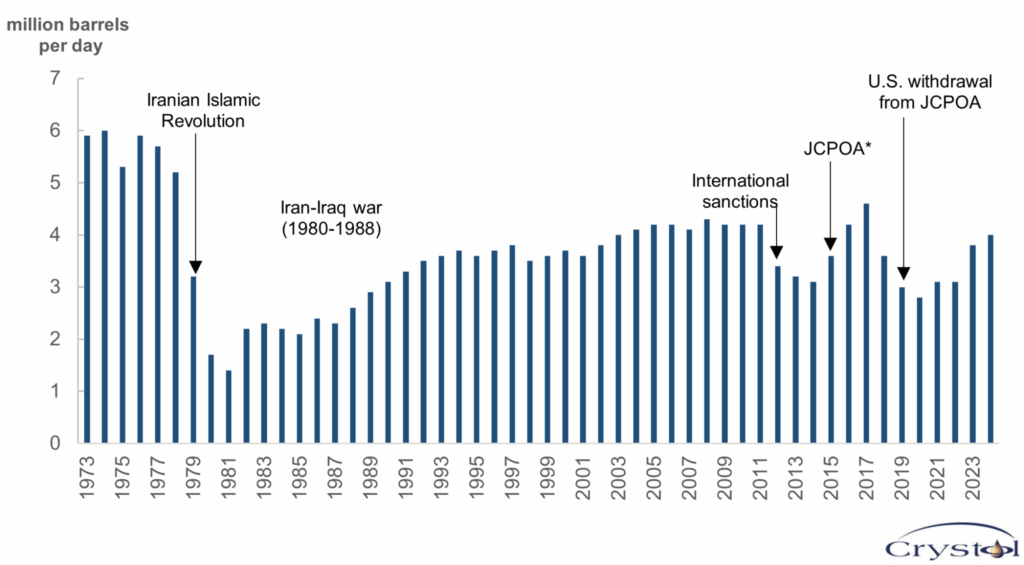

Iran remains one of the world’s major oil producers despite decades of international sanctions. The country currently produces around 3.2–3.3 million barrels of crude oil per day, according to OPEC and CEIC data, placing it among the largest producers in the Middle East and one of the top producers within OPEC. Production has fluctuated significantly over the past two decades: it reached nearly 4 million barrels per day in 2005, fell sharply during periods of sanctions—dropping to around 1.9 million barrels per day in 2020—and has gradually recovered in recent years. Iran holds some of the largest oil reserves in the world, and the oil sector remains a strategic pillar of its economy and geopolitical influence, even though sanctions have limited foreign investment and reduced its share of global oil markets.
source: CEIC , Crystol Energy
13. Iran’s Economy Under Sanctions: The High Cost of Isolation
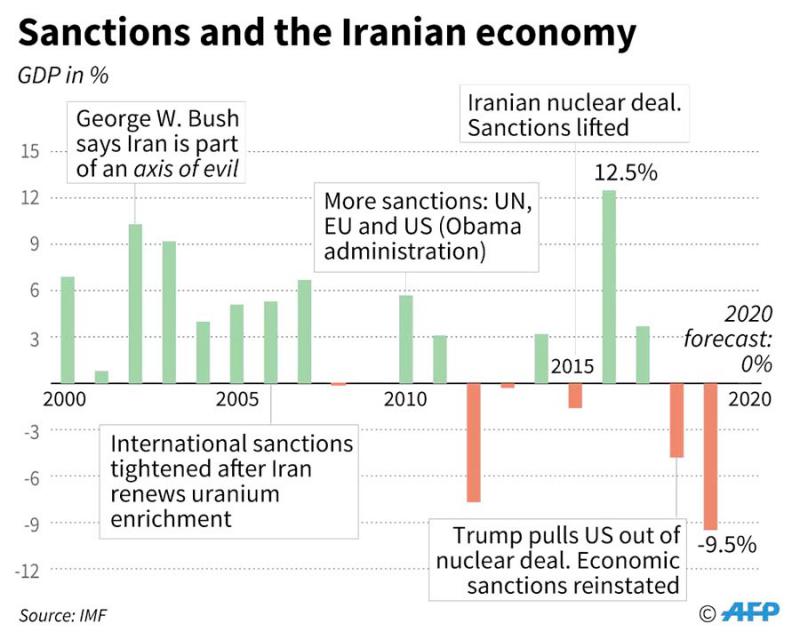
U.S. economic sanctions have imposed heavy costs on Iran’s economy by sharply reducing oil exports, limiting access to global finance, and discouraging foreign investment. Since the re-imposition of sanctions, Iran’s crude exports reportedly dropped from about 2.5–2.7 million barrels per day to roughly 250,000–400,000 barrels per day, cutting deeply into government revenues. Iranian officials estimate that sanctions have cost the country around $100 billion in lost oil income and another $100 billion in foreign investment and credit, weakening the national currency and contributing to inflation and economic hardship. The restrictions are designed to pressure Tehran over its nuclear and regional policies, but they have also strained everyday economic activity inside the country while forcing Iran to seek alternative trade channels and adapt its economy to prolonged isolation.
source: The Arab Weekly
14. Strait of Hormuz: volumes and alternatives


The Strait of Hormuz is one of the most critical chokepoints in the global energy system. Located between Iran and Oman, the narrow waterway connects the Persian Gulf with the Gulf of Oman and the Arabian Sea, serving as the main export route for oil produced in Gulf countries. According to the U.S. Energy Information Administration, roughly 20 million barrels of oil per day—about one-fifth of global petroleum consumption—passes through the strait, making it the world’s most important oil transit chokepoint. In addition to crude oil, significant volumes of liquefied natural gas (LNG) also move through the passage, particularly from Qatar. Because such a large share of global energy supply depends on this narrow route, any disruption—whether from conflict, military tensions, or blockades—could have immediate consequences for global oil prices and international energy security.
source: EIA
15. Iran and the Middle East: Competing Alliances and Regional Battle Lines
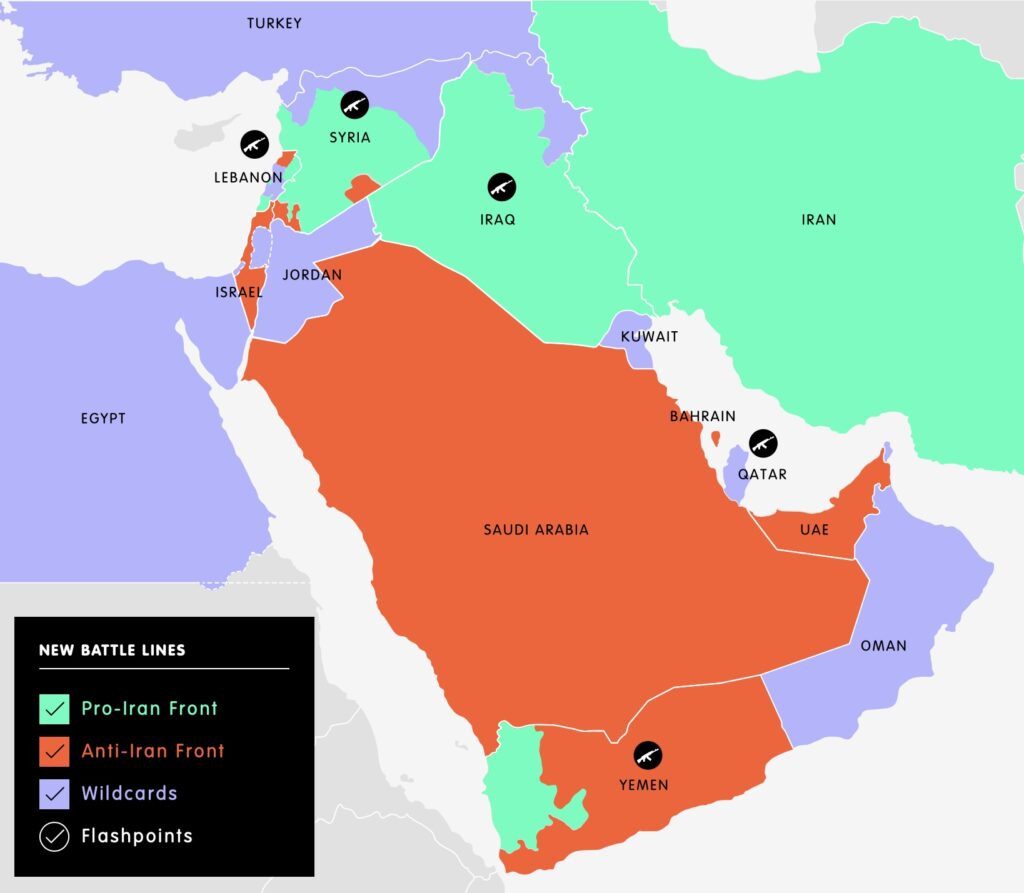
The map illustrates the regional geopolitical alignment around Iran in the Middle East, showing how the region is broadly divided into competing blocs. Countries such as Syria, Iraq, and groups in Lebanon and Yemen are often aligned with Iran through political or military cooperation, forming what is sometimes called the “Axis of Resistance.” This network includes state partners and non-state actors such as Hezbollah and other militias that support Iran’s regional influence. In contrast, a counter-bloc led by Saudi Arabia, the UAE, and often supported by Israel and Western allies seeks to limit Iran’s power and expansion in the region. Between these camps are “wildcard” states like Turkey, Qatar, and Oman, which maintain more flexible or pragmatic relationships with both sides. Together, these rival alliances create a complex strategic landscape where competition for influence frequently plays out through diplomacy, proxy conflicts, and shifting regional partnerships.
source: ECFR
16. How Strong Is Iran’s Military?
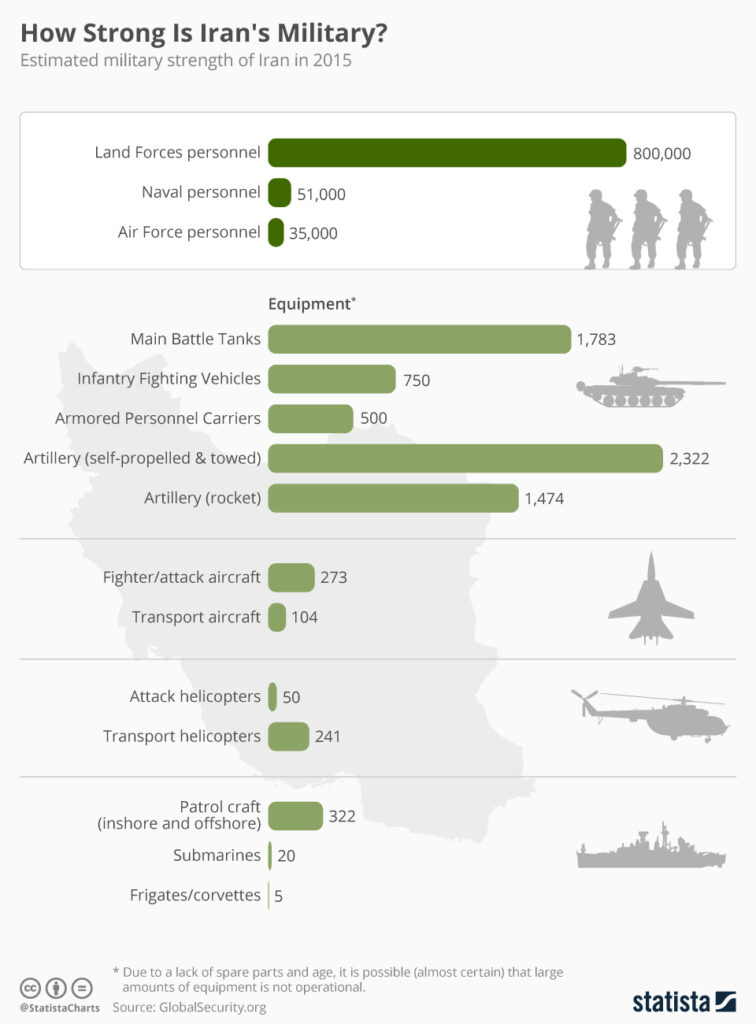
Iran possesses one of the largest military forces in the Middle East, with an estimated nearly 900,000 active personnel, according to data compiled by GlobalSecurity and visualized by Statista. The armed forces are divided between the regular army (Artesh) and the Islamic Revolutionary Guard Corps (IRGC), which plays a major role in national defense and regional operations. While much of Iran’s conventional equipment—such as aircraft and armored vehicles—dates back to the era before the 1979 revolution and includes aging U.S.-made systems like F-14 and F-4 fighter jets, the country compensates through a strategy focused on missiles, drones, naval forces in the Persian Gulf, and asymmetric warfare capabilities. Despite technological limitations and sanctions that restrict access to spare parts and modern weapons, the large manpower base and focus on deterrence make Iran a significant regional military power.
source: Statista
17. Missiles of Iran
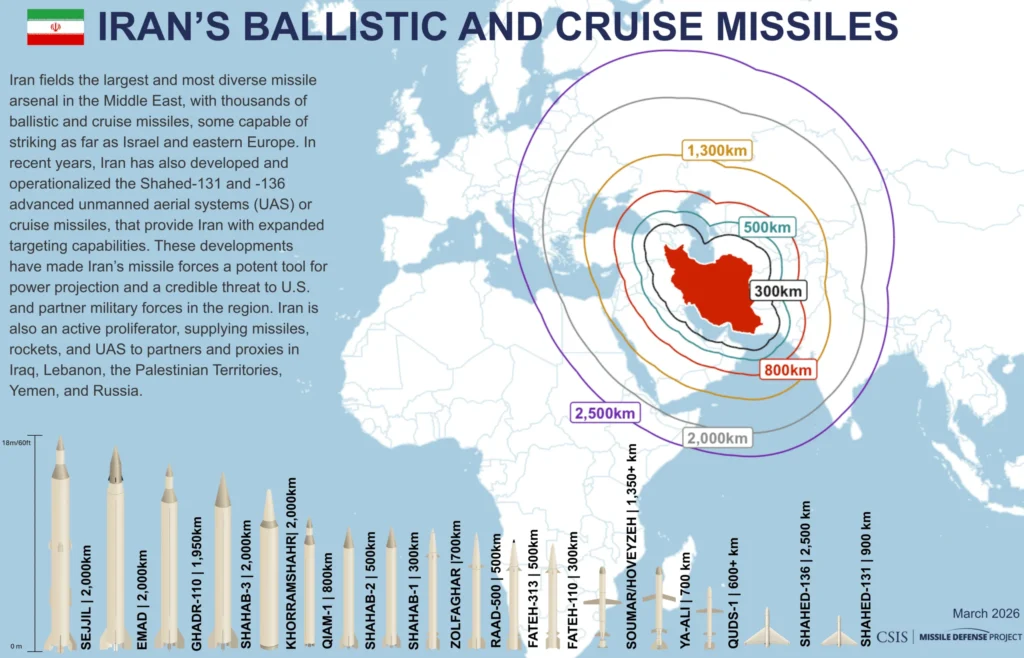
Iran possesses the largest and most diverse ballistic missile arsenal in the Middle East, which has become a central pillar of its military strategy and deterrence. According to the CSIS Missile Threat project, Iran fields a wide range of missiles—from short-range systems like the Fateh-110 and Fateh-313 (200–500 km range) to medium-range missiles such as the Shahab-3 and Khorramshahr, capable of reaching 1,300–2,000 km or more. These longer-range systems allow Iran to threaten targets across the Middle East, including Israel and U.S. military bases in the region. Many of Iran’s missiles are road-mobile and solid-fuel, which increases survivability and allows them to be launched quickly. While the accuracy of some systems remains limited compared with Western missiles, Iran has steadily improved guidance systems and payload capabilities over the past two decades, making its missile force one of the country’s most important tools for regional influence and deterrence.
source: Missiles Treat
18. Where Israel attacked Iran in June 2025
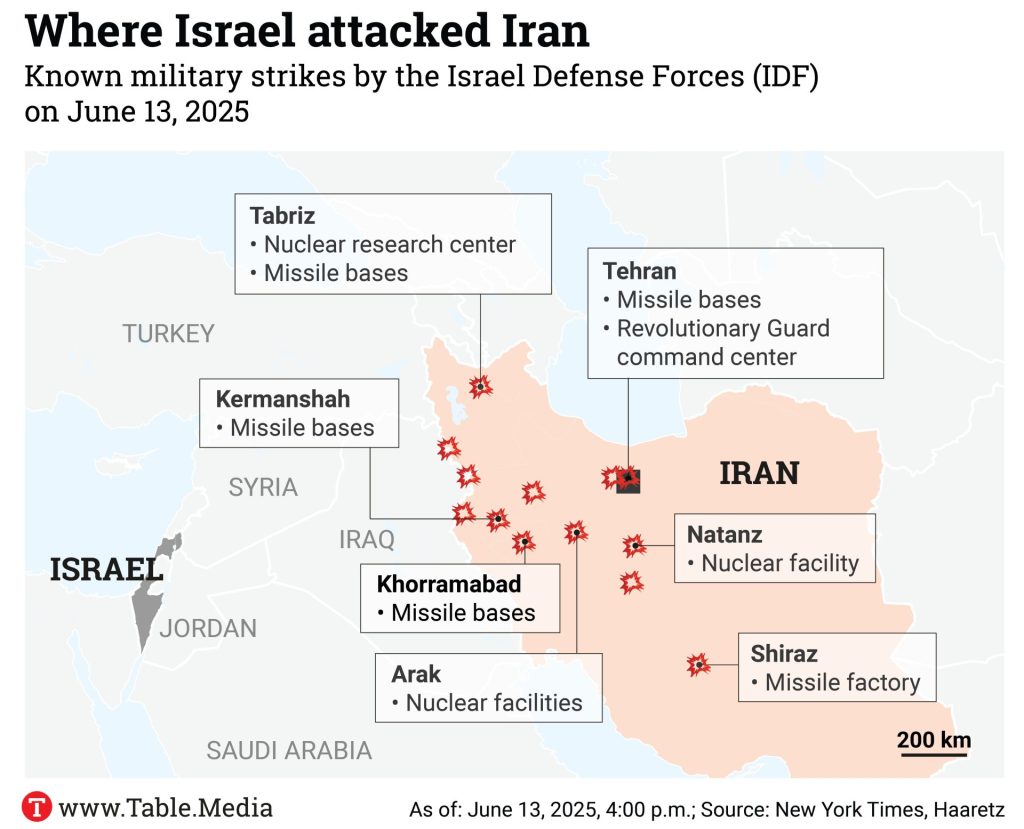
The map shows the main locations targeted during Israeli strikes on Iran on June 13, 2025, focusing primarily on nuclear facilities, missile bases, and military command centers. Key sites include the Natanz nuclear enrichment facility, one of the core elements of Iran’s nuclear program, as well as installations in Arak associated with nuclear infrastructure. Several strikes also targeted missile bases and factories in cities such as Kermanshah, Khorramabad, Shiraz, and Tabriz, reflecting efforts to weaken Iran’s missile capabilities. In Tehran, attacks reportedly focused on Revolutionary Guard command structures and missile-related infrastructure. The distribution of the targets across western and central Iran highlights the strategic aim of disrupting both Iran’s nuclear program and its missile production and deployment network.
source: Table Media
19. Map of Iran War attacks, March 8th, 2026
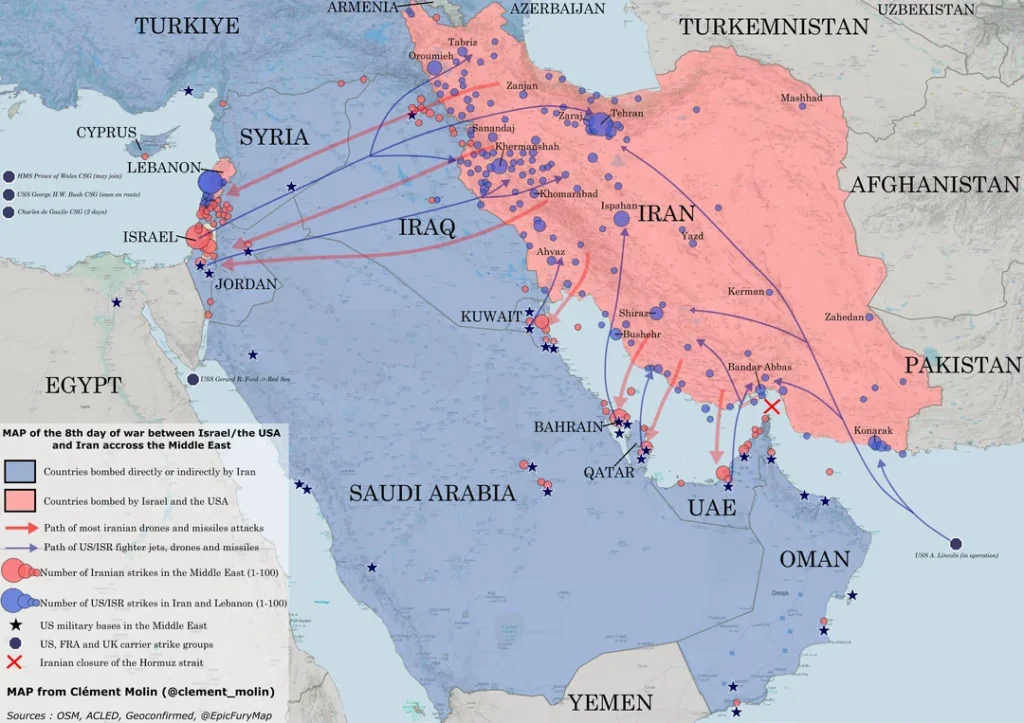
The map illustrates how the current conflict has expanded beyond Iran’s borders into a region-wide confrontation involving Israel, the United States, and multiple Middle Eastern countries. According to available data, U.S. and Israeli forces conducted roughly 4,500 strikes across Iran, targeting air defenses, missile launchers, military bases, and command centers. In response, Iran launched about 3,500 attack vectors—including around 905 missiles as well as large numbers of drones—against Israel and U.S. positions in the region. These strikes have reached targets across the Middle East, including Israel, Iraq, Kuwait, the UAE, Bahrain, and other Gulf states hosting U.S. military bases. The map also highlights the strategic geography of the conflict: Iran’s missile and drone launches project power across the region, while U.S. naval forces, air bases, and carrier strike groups form a network supporting the counter-offensive. The pattern of attacks shows how quickly the war has transformed from a bilateral confrontation into a multi-country regional conflict centered on Iran’s missile capabilities and the U.S. military presence in the Middle East.
source: X
20. Geography of Iran explained


#Featured


Next article
Making AI Work with Discrete Global Grid Systems
- Geospatial data has grown in volume and complexity, but most AI systems still struggle to use it in a meaningful way. A recent line of work connects Earth observation data with machine learning models through Discrete Global Grid Systems (DGGS). The approach is known as AI-DGGS.
The Open Geospatial Consortium (OGC) recently completed a pilot project, “AI-DGGS for Disaster Management.” The project tested whether AI systems can work with standardized spatial data in a way that supports real decision-making during events such as floods. Instead of treating maps as images or loose coordinate pairs, the system used grid cells as the basic unit of reasoning. This allowed the models to query and combine spatial data in a consistent way.
This article explains what DGGS is, why it matters for AI, and what the OGC pilot showed in practice.
What is DGGS?
DGGS stands for Discrete Global Grid Systems. In basic terms, a DGGS is a system that turns the Earth into a digital “mosaic” or “spreadsheet.” Instead of looking at the world as a flat map with complex coordinates (like Latitude 49.8951, Longitude -97.1384), a DGGS divides the entire planet into a grid of fixed cells. Think of it like pixels on a computer screen or tiles on a floor, but wrapped perfectly around the globe.
Why DGGS Exists
Most GIS workflows grew out of paper maps and projected coordinate systems. These projections distort distances or areas, and combining datasets often means handling mismatched rasters, vectors, and reference systems. Anyone who has tried to align satellite imagery with road networks knows how much manual work this can involve.
A DGGS takes a different approach. The Earth is divided into a hierarchy of uniform cells, commonly hexagons, triangles, or squares. Each cell has a stable identifier and a well-defined spatial extent. Data from different sources can be stored and queried using these shared cells rather than raw coordinates.
Key Properties of DGGS
In practice, DGGS brings three useful properties:
| Concept | Description |
|---|---|
| Common Spatial Frame of Reference | DGGS models the Earth as a sphere covered in discrete cells, forming a unified digital grid. Each cell acts like a row in a global spreadsheet, allowing diverse datasets – such as weather, population, infrastructure, temperature, flood depth, or roads – to align seamlessly without reprojection. |
| Stable Cell Identifiers (Spatial Tokenization) | Each cell has a unique identifier or “ID,” serving as a spatial token. These IDs replace floating-point coordinates, simplifying indexing, joins, and data integration. This approach allows computers and AI systems to process spatial data as easily as text tokens. |
| Equal-Area Cells | DGGS maintains consistent cell areas across the globe, eliminating distortions found in traditional map projections. Equal-area cells ensure that statistical and scientific analyses remain accurate, as a cell in one region represents the same surface area as a cell elsewhere. |
| Hierarchical Grid Structure | DGGS grids are hierarchical, with parent and child cells. Larger cells represent broader regions, while smaller cells provide finer detail. This structure supports multi-scale analysis, enabling queries from continental to street-level resolution without altering the core framework. |
This interactive demo illustrates the concept of DGGS. DGGS divides the Earth into a structured grid of cells, allowing AI models to reason consistently about location, elevation, land use, and hazards like floods. Each cell has a unique identifier and can carry multiple attributes, making it easier to analyze and visualize spatial information in a standard way.
Why DGGS Helps AI
Large language models are built for text. When given latitude and longitude, they have no built-in notion of distance, adjacency, or spatial containment. This leads to errors when models are asked to reason about geography.
DGGS provides a way to represent space in discrete units that are easier for machine learning systems to handle. Each grid cell becomes a token-like element that can be associated with attributes such as water depth, building density, or road accessibility. Instead of reasoning over continuous coordinates, models work with indexed regions that already encode spatial structure.
By using DGGS, we give AI a “geospatial brain.” The AI doesn’t have to calculate where the water is; it just looks up the Cell IDs labeled “flooded” and matches them with Cell IDs labeled “populated.” This allows non-experts to ask plain questions like “Which roads in Winnipeg are flooded?” and get instant, accurate answers. This approach does not solve spatial reasoning on its own, but it removes a major source of friction between geospatial data formats and AI pipelines.
The OGC AI-DGGS Pilot
The pilot focused on flooding in the Red River basin in Manitoba, Canada. The goal was to support questions that emergency managers might ask during an event, such as identifying high-risk areas or assessing which roads are likely to be impassable.
The setup had two main parts:
- DGGS servers that stored flood models, satellite products, and infrastructure data using grid cells.
- AI-based clients that translated user queries into data requests and combined the results.
The important point is not that a chatbot was added on top, but that the spatial data itself was structured in a way that allowed consistent retrieval and combination across sources.
Several practical points came out of the work:
- Interoperability between grid systems was feasible. Data stored in H3, ISEA, and other DGGS implementations could be accessed by the same client, even though the underlying geometries differ.
- Performance varied by library. H3 was widely supported but not always the fastest option. Alternatives such as S2 or specialized DGGS libraries performed better in some benchmarks. All were fast enough for interactive use.
- Geometric consistency remains a problem. Some grids are defined on a sphere, while most GIS workflows rely on an ellipsoidal Earth model (WGS84). This mismatch matters for high-precision tasks and still needs careful handling.
- DGGS worked well as a basis for a shared operational view during an emergency. Different teams could run the same service chains on the same grid and obtain comparable results, rather than passing around static map images.
Where This is Heading
The combination of AI and DGGS shifts part of the work from manual data handling toward automated question answering over spatial datasets. Likely next steps include:
- Smaller, task-focused language models trained on geospatial workflows rather than general web text.
- Using vision-style models over grid cells to detect spatial patterns and changes.
- Further standardization, including a DGGS registry maintained by OGC, to make grid choices explicit and interoperable.
Conclusion
AI-DGGS does not replace GIS. It changes how spatial data is packaged for machine use. By structuring the planet into stable grid cells, it becomes easier to link datasets, retrieve relevant regions, and automate parts of spatial analysis. The Red River pilot showed that this approach can support real disaster-response questions without relying on ad hoc data preparation. The remaining work is less about flashy AI features and more about careful standards, geometry, and reliable data pipelines.
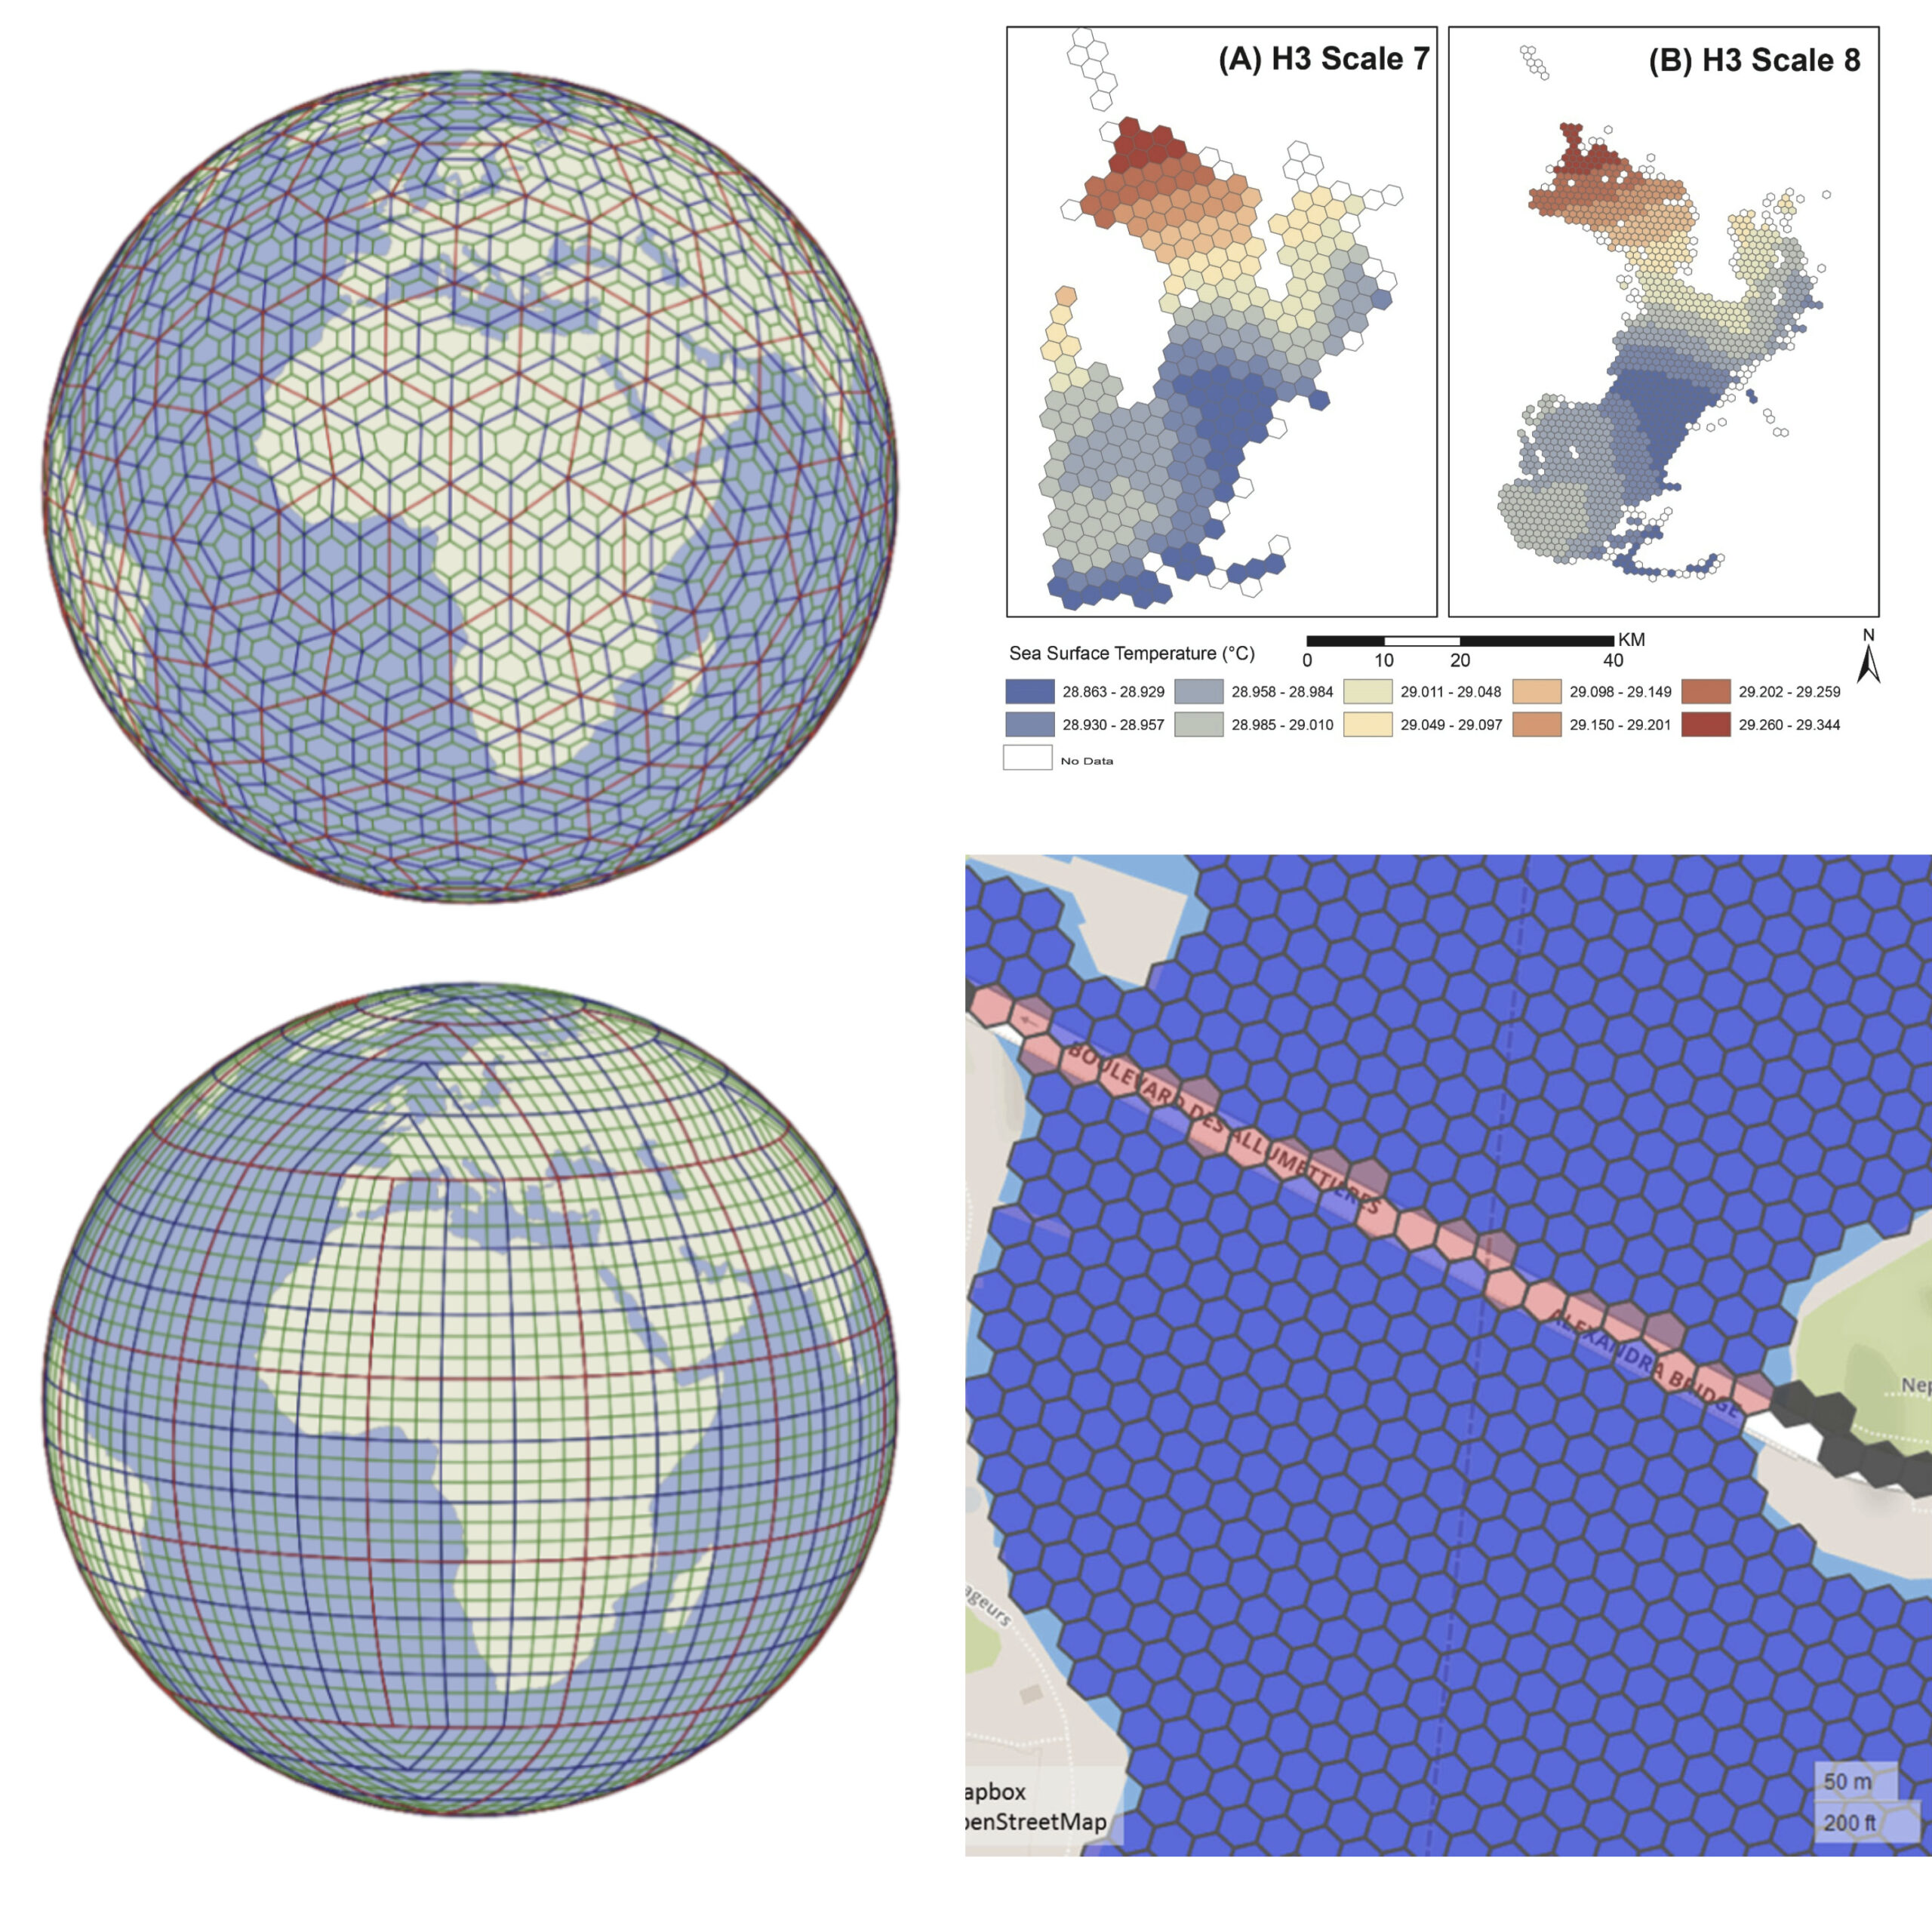
Example of DGGSs and its applications. Source: see related resources
Related resources:
- Kmoch, A., Matsibora, O., Vasilyev, I., and Uuemaa, E.: Applied open-source Discrete Global Grid Systems, AGILE GIScience Ser., 3, 41, https://doi.org/10.5194/agile-giss-3-41-2022, 2022.
- Ben Bondaruk, Steven A. Roberts, Colin Robertson, Assessing the state of the art in Discrete Global Grid Systems: OGC criteria and present functionality, Geomatica, 74(1), 2020, 9–30, https://doi.org/10.1139/geomat-2019-0015.
- Bousquin J. Discrete Global Grid Systems as scalable geospatial frameworks for characterizing coastal environments. Environ Model Softw. 2021 Dec 1;146:1-14. doi: 10.1016/j.envsoft.2021.105210. PMID: 35355513; PMCID: PMC8958999.
- Mason, K., Schröder-Fürstenberg, J. (2024). Exploring the possibility of adding DGGS support to the S-100 Universal Hydrographic Data Model. The International Hydrographic Review, 30(1), pp. 112-123. https://doi.org/10.58440/ihr-30-1-a01.
Did you like this post? Follow us on our social media channels!
Read more and subscribe to our monthly newsletter!

