#Business #Ideas

This startup is capturing full-color videos of Earth in extraordinary detail

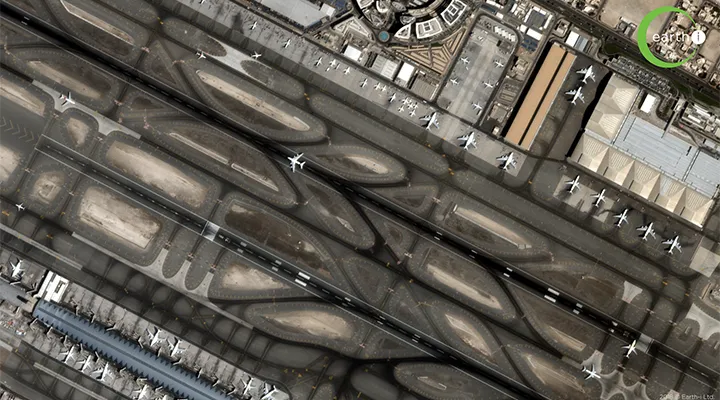
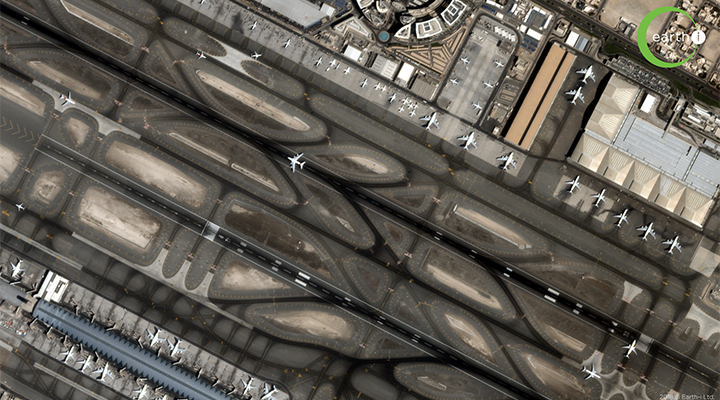
It may look like SimCity, but it is real-life. You can just picture intelligence agencies rubbing their hands with glee thinking of the sheer possibilities it could enable. UK-based geospatial startup Earth-i’s VividX2 satellite is revolutionizing earth observation, and there’s no two ways about it.

Launched in January 2018, VividX2 is world’s first commercial satellite to capture a 2-minute-long, 50fps video of any given location on the planet from 300 miles up in the space at a resolution of 60cm. The still imagery that this satellite takes is also captured from multiple angles to enable the construction of a 3D model of the area.

If you think this sounds similar to another geospatial startup we love, Urthecast, let us remind you that the videos captured by its Iris satellite have a resolution of 1 meter. For applications like defence, security, disaster response or maritime monitoring, this difference is like chalk and cheese.

See the video below to fully appreciate the incredible level of detail Earth-i has managed to conquer:

Each element on the ground is vividly distinguishable. The depth and quality of the data is so rich that Earth-i is able to discern everything from the speed of the slowest vehicle on a highway to the acceleration of a motorboat speeding in the ocean. And with the data being downloaded within minutes of acquisition, the startup is now leveraging computer vision and machine learning techniques to develop advanced analytics and insights from the big data trove it is amassing by revisiting a location up to 4 times a day.

Earth-i is positive that it has the power to provide governments and businesses with a unique ability to improve decision-making, monitor assets more cost-effectively, track changes in critical locations in a timely manner, and predict future events with more certainty. What are your thoughts?

Say thanks for this article (0)
The community is supported by:
Become a sponsor
#Business
#Business #GeoDev
3 Pathways For Integrating Planet Data Into Your GIS Workflow
Avatar for Sponsored Article
Sponsored Article 08.12.2024
AWESOME 1
#Business #Fun #Ideas #Science
Next Generation Map Navigation: Is It Based on AR Smart Glasses?
Nianhua Liu 07.19.2024
AWESOME 2
#Business #Featured
How 15 Centimeter Satellite Imagery is Changing the Mapping Game
Aleks Buczkowski 12.2.2024
AWESOME 8
Next article
#Environment

The human fingerprint in dramatic freshwater depletion around the world

“Holy cow, this is garbage!” That’s the reaction scientists gave back in 2002, when they first saw the data being sent by NASA’s just-launched Gravity Recovery and Climate Experiment (GRACE) mission – which was tasked to track freshwater in 34 regions around the world.

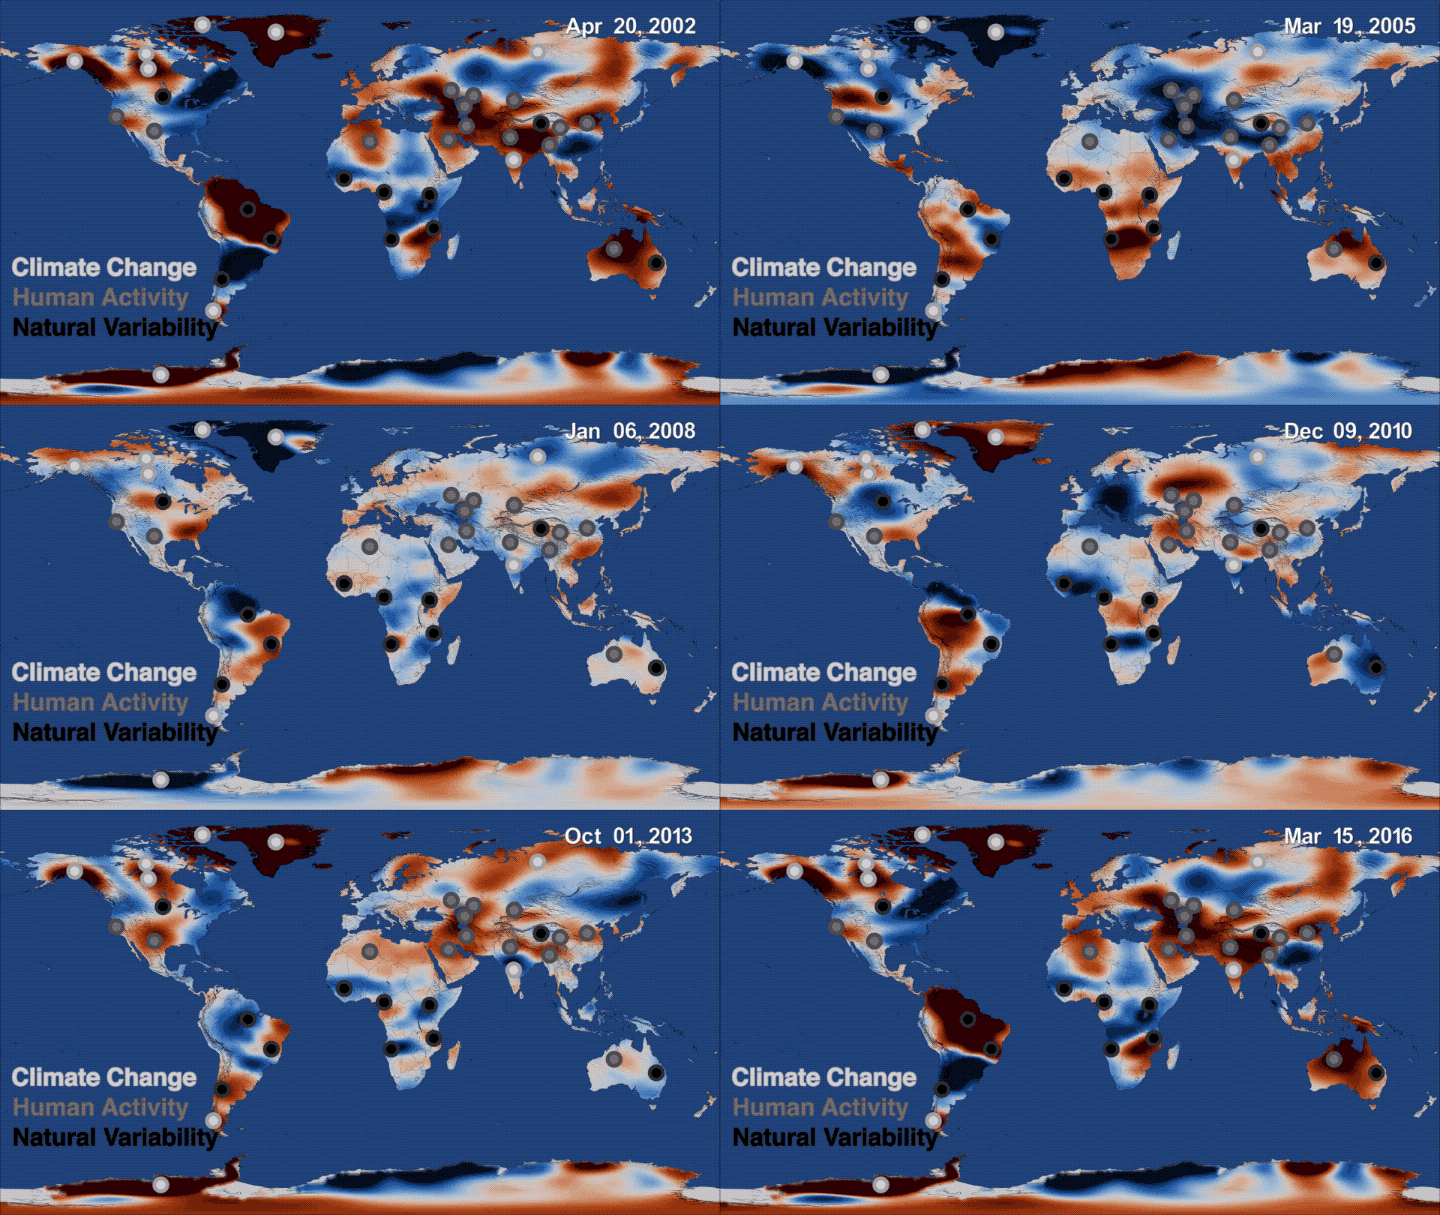
However, after a couple of years of solid data cleanup and processing, global trends started to reveal themselves: Ice sheet depletion of Greenland and Antarctica, frightening dip in the groundwater table in North India, the effect of El Niño and La Niña on sea levels… GRACE faithfully watched the Earth for 14 years, till its mission ended in October 2017, and armed the researchers with a trove of valuable data.

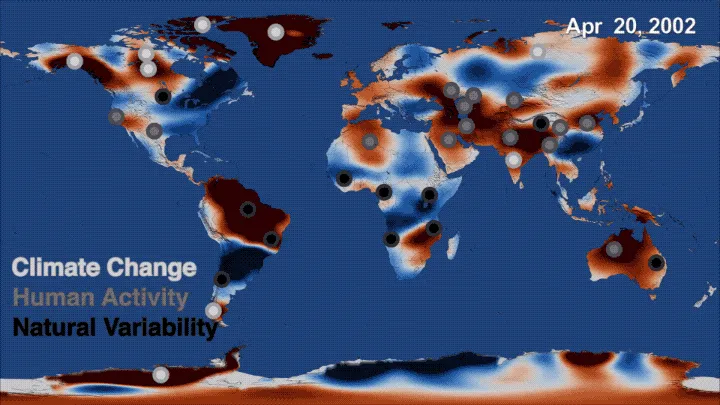
This map depicts a time series of data collected by NASA’s Gravity Recovery and Climate Experiment (GRACE) mission from 2002 to 2016, showing where freshwater storage was higher (blue) or lower (red) than the average for the 14-year study period. Courtesy: NASA

But, the question remained: What was causing these apparent trends?

This made NASA undertake a first-of-its-kind study that would combine GRACE’s data with global precipitation, satellite imagery, irrigation maps, and published reports of human activities related to agriculture, mining and reservoir operations.

Shocking redistribution of water

The results of this study, published earlier this month, concluded that Earth’s wetland areas are getting wetter and dry areas are getting drier because of overuse of water resources by humans, climate change, and natural cycles.

According to Jay Famiglietti, co-author of the research and senior water scientist at NASA’s Jet Propulsion Laboratory, “The human fingerprint is all over changing freshwater availability. We see it in large-scale overuse of groundwater. We see it as a driver of climate change. The study shows that humans have really drastically altered the global water landscape in a very profound way.”

For example, the depletion of freshwater in Saudi Arabia can be attributed to agricultural pressures. The region lost 6.1 gigatons per year of stored groundwater between 2002 and 2016 – a period of explosive growth of irrigated land confirmed by Landsat images.

Similarly, the likely cause of California’s groundwater depletion from 2007 to 2015 is the decreased groundwater replenishment from rain and snowfall combined with increased pumping for agriculture.

Why is this important?

Alarming groundwater decline in farming regions of the world is especially disturbing because it can lead to global food shortages. The study brings to the fore the daunting water-management decisions many nations will need to take in the near future, coupled with a comprehensive water conservation strategy.

NASA hopes that the GRACE data will provide “motivation for multilateral cooperation among nations, states and stakeholders, including the development of transboundary water-sharing agreements, to balance competing demands and defuse potential conflict.”

The mission continues

Now, that the GRACE mission has completed its lifecycle, it will be replaced by a Follow-On (GRACE-FO) mission so that NASA can continue to monitor changes in the world’s water cycle and surface mass. GRACE-FO was launched in May 22 from Vandenberg Air Force Base in Central California as payload on a SpaceX’s Falcon 9 rocket. When the mission begins after an 85-day, in-orbit checkout phase, it will provide data that will allow scientists to better distinguish short-term variability from longer-term climate change trends.

Read on
Search