

For most of our history, maps have been flat. They worked well enough when all we needed was a top-down view of roads, rivers, and land cover. But the world we measure today is not flat at all. Drones, satellites, and ground sensors now capture the shapes of buildings, the layers of soil, and even the movement of air around our cities. These things do not exist in two dimensions, so a 2D map cannot accurately represent them.
Imagine trying to squeeze an entire building into a single floor plan, or trying to show the layers of the ground on a single flat sheet, or trying to map smoke moving through the air using only a top view. It feels wrong because it is wrong.
As a result, we are hitting a wall. Our tools still think in flat surfaces, while our data now describes a full 3D space. The gap keeps growing. Anyone working with modern sensors can feel it. The world we measure has depth, layers, and hidden structures. A traditional map simply cannot show all of that, no matter how hard we try.
This article is here to help you make sense of that shift. By the end, you will understand what a voxel is, why everyone in geospatial talks about it, where it is already changing real projects, and how you can explore voxel tools yourself.
This is the moment where mapping starts to move from surfaces to space. And it begins with one simple idea: the voxel.
What Exactly Is a Voxel?
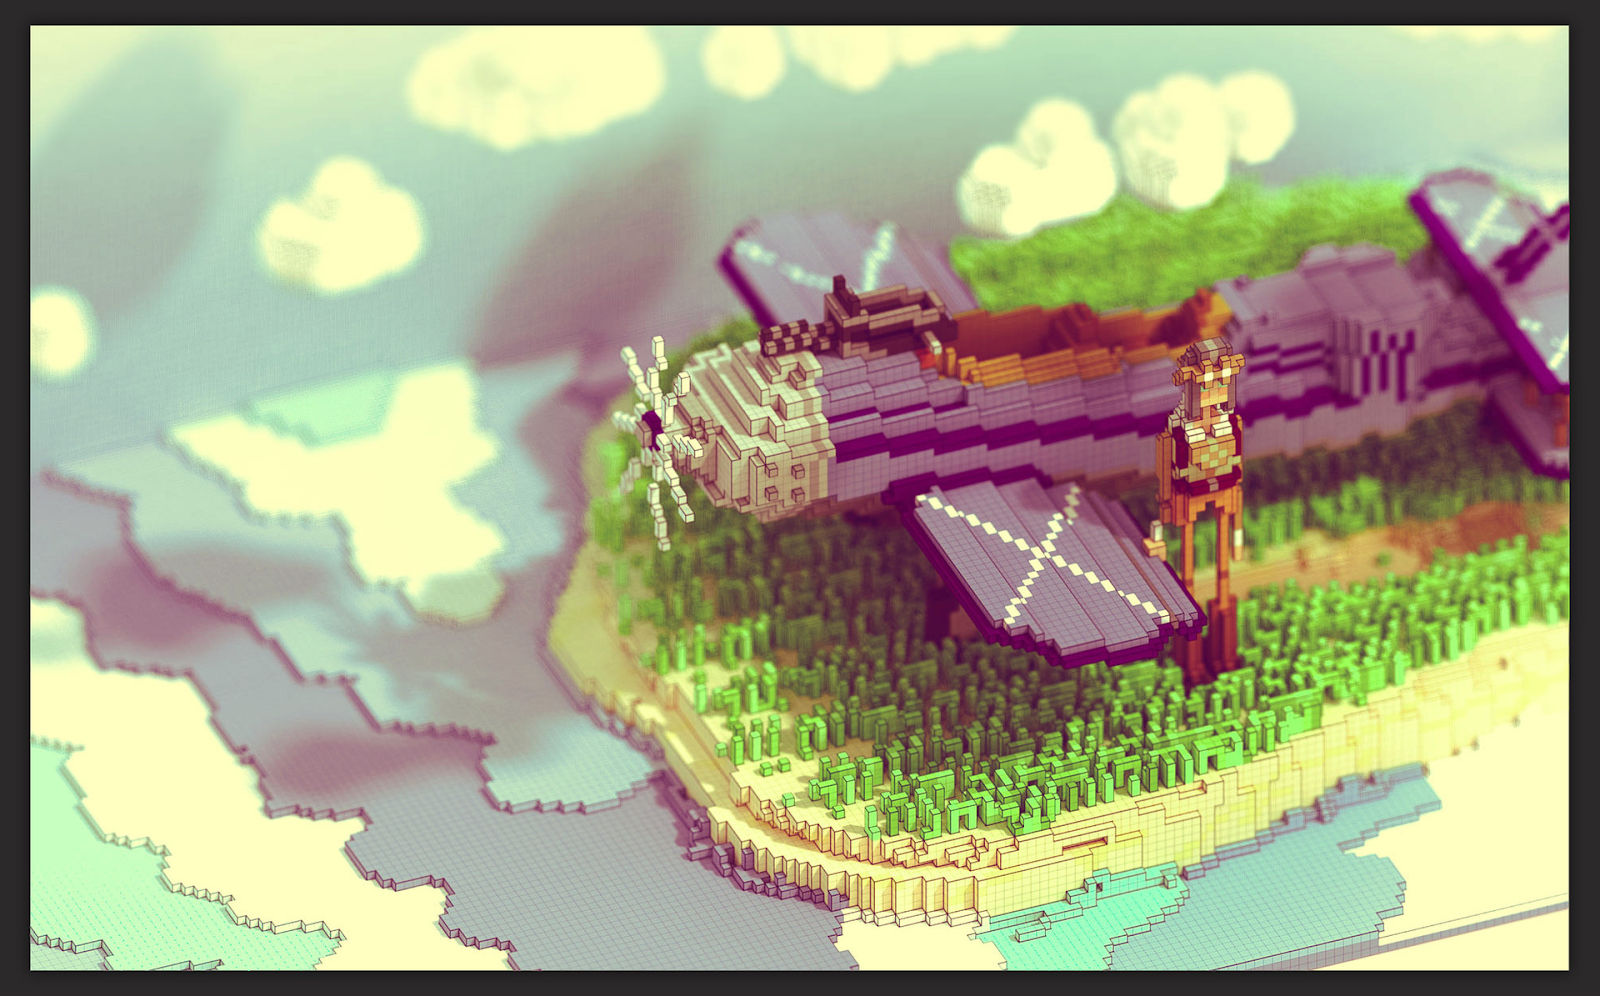
Before we go deeper, we need to meet the small cube that makes 3D mapping possible. This cube is called a voxel. It is a discrete, cube-shaped unit in a three-dimensional grid that represents a specific, bounded volume of space and stores physical or semantic attributes associated with that volume. It is the volumetric counterpart of a pixel, extending spatial information from a flat area into real 3D space
You can think of it as a pixel with depth. A pixel shows what happens on a surface. A voxel shows what happens inside space.
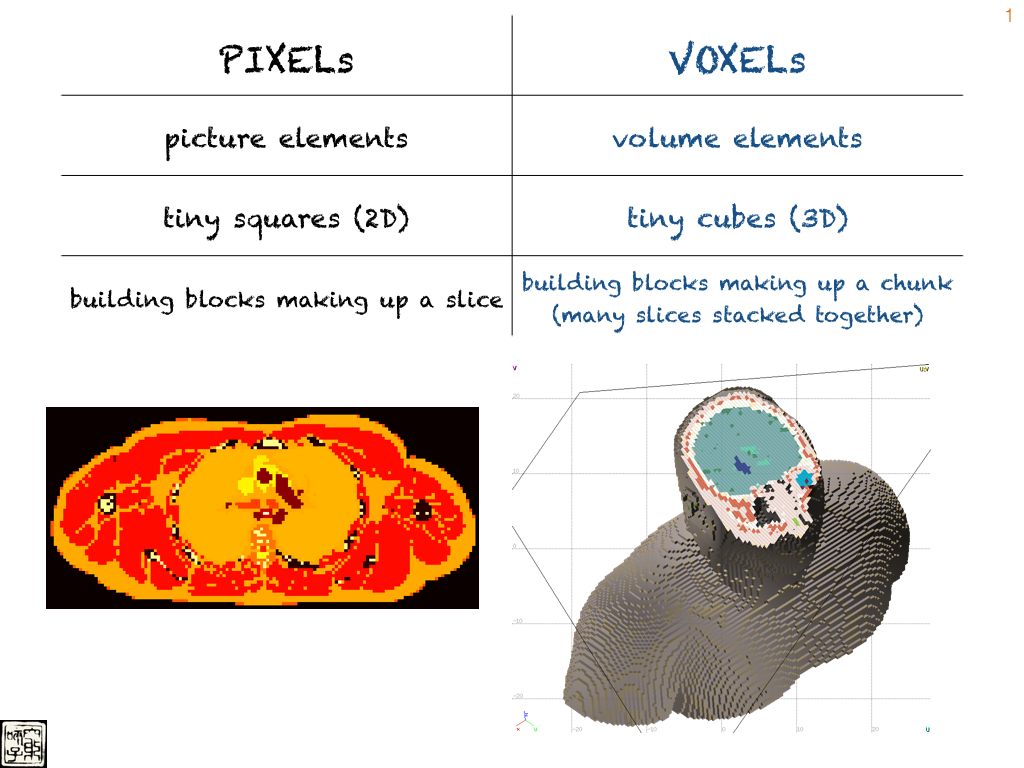
Source: Marychin
Once you imagine the environment as a big stack of tiny cubes, it becomes clear why voxels matter. They give our digital maps a way to store information above the ground, below the ground, and all the way in between.
Next, let’s look at why our current 3D data is so messy and why these cubes help clean things up.
The Problem with Raw Data: Why LiDAR Is Chaotic
Now that we know what a voxel is, it is easy to see why our current 3D data feels messy. Most of the data we collect today comes from LiDAR scanners, drones, and photogrammetry. These tools capture millions of tiny points floating in space. This huge collection of points is called a point cloud, and while it looks impressive, it is also very chaotic.
Each point stands on its own. It has a location and maybe a color, but no structure. Nothing tells the computer which points belong together. There is no grid. There is no order. A study that looks at point cloud structure explains that this lack of organization makes it hard to run analysis or spot patterns.
This becomes a real problem when we want to use AI. Many AI models need data to be arranged in a regular structure, not scattered like confetti. Another analysis shows how raw point clouds slow down learning because the system must constantly guess where things belong. A deeper look at 3D learning points out that AI performs much better when the data is grouped into small cubes first.
This is why many researchers now say that voxels are not just a data format but the foundation of smart 3D analysis. They turn scattered points into something a computer can read. They give the data a shape. They bring order to the chaos.
Next, we will look at how voxelization actually does this and how we manage the huge amount of data that comes with it.
How Voxels Bring Order to Messy 3D Data
Once we have a messy point cloud, the first thing we want is some order. That is where voxelization comes in. Voxelization is simply the step where we take all those floating points and sort them into tiny cubes. Each cube now has a place in a 3D grid, which makes the data much easier to work with.
But there is a catch. When we turn 3D space into cubes, the amount of data grows very fast. If you double the resolution of a 2D map, the size grows by the square. If you double the resolution of a 3D model, it grows by the cube. A high-resolution voxel grid can become enormous. An analysis of voxel data structures points out that even a small increase in detail can explode the memory needed. Without any tricks, the grid becomes too big to store or process.
The good news is that most of the world is empty. The air above a city. The space between trees. The gaps inside a building. We do not need to store every possible cube. We only need the ones that contain something. This idea is called sparsity.
To make this work, many systems use a smart structure known as a Sparse Voxel Octree. It breaks space into cubes, but only where there is data. A detailed study of octrees shows how they divide space into smaller and smaller blocks only when needed. This saves a huge amount of memory and still keeps all the important details. Dense areas like building walls or underground layers can stay sharp, while empty regions take almost no storage.
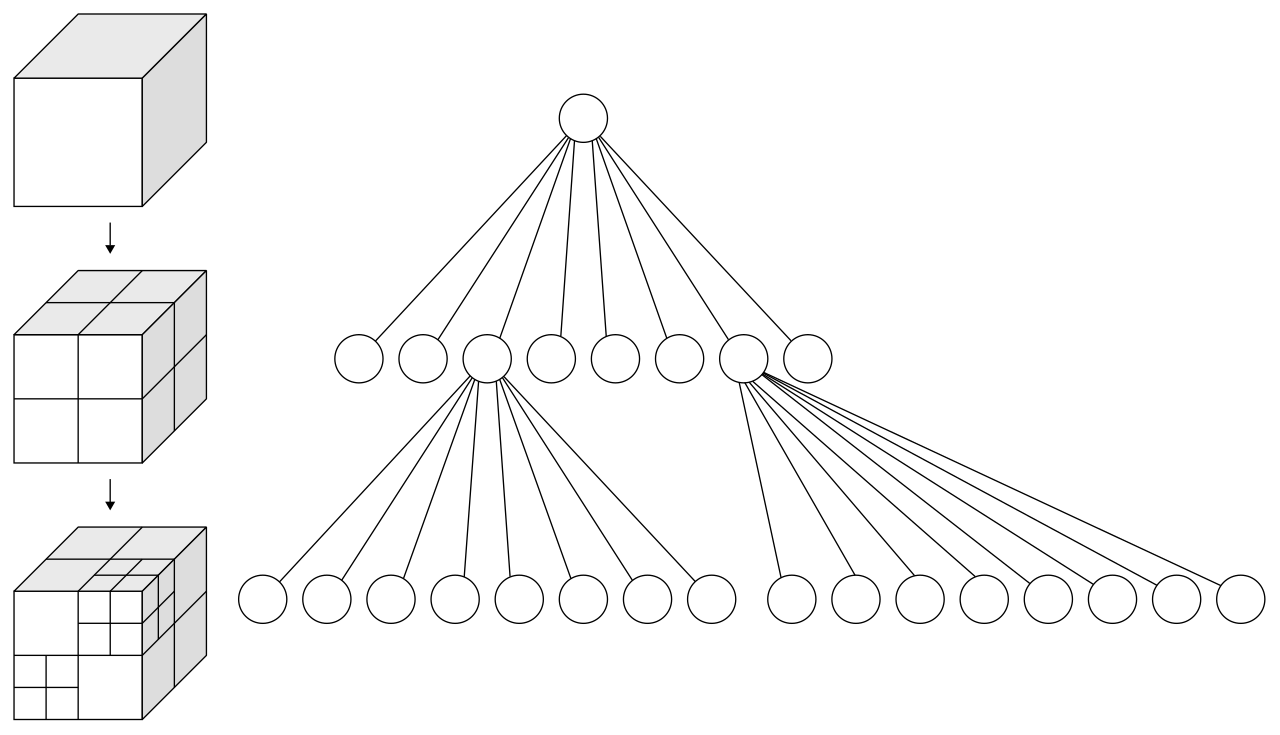
Source: Voxel Compression
This simple idea makes voxel models practical. It gives us the structure we need without drowning us in data. With this in place, we can finally start using 3D information the way it was meant to be used.
Real-World Impact: Where Voxels Change Everything
This is the part where voxels stop being an abstract idea and start becoming something you can see and feel. Once you move from flat maps to tiny cubes of space, a lot of things suddenly become possible.
The Living City
One of the most impressive examples comes from Stuttgart. In this study, researchers combined everything above the ground and everything below it into one voxel model. That meant the soil layers, the underground tunnels, the buildings, the heat flow, and even the geological structure were all stored in the same cube-based world. When you view a city like this, you see relationships that never show up on a flat map. You see how heat moves from underground into buildings. You see how foundations interact with soil. It feels less like a map and more like a living system.
The 4D Map
Voxels become even more powerful when you add time. Because each cube sits in a fixed position, you can track what happens inside it as days, seasons, or years pass. ESRI’s explanation of voxel layers shows how this works. It allows you to watch groundwater levels change, pollution spread through the air or temperature shift over time. This turns a static map into something you can actually observe and understand as it evolves.
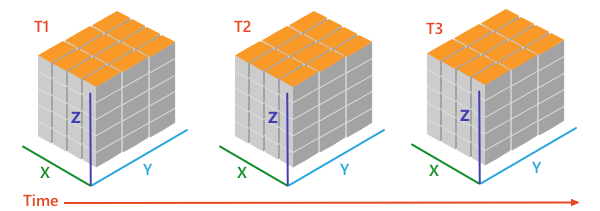
Source: ESRI
Helping Autonomous Vehicles Understand the World
Self-driving cars and robots make constant decisions about where to go and how to avoid obstacles. A voxel map gives them a clean and structured view of the 3D world. Research on 3D occupancy prediction for autonomous driving shows how vehicles use voxels to detect road edges, buildings and moving objects. With cubes, the car sees space in a way that is simple and reliable.
Environmental and Disaster Simulation
Voxels also help model how natural processes move. For example, a study on environmental simulation uses voxels to examine how wind carries noise and pollution through urban spaces. When the world is divided into cubes, you can see how smoke or gas spreads between buildings or how water flows during floods. It makes complex processes feel easy to follow.
Designing Better Cities
Urban designers use voxel models to study how comfortable a neighborhood feels. With cubes, you can see where sunlight reaches, how wind moves through streets or where heat gets trapped between buildings. These details help shape cities that are not just beautiful but pleasant to live in.
Across these examples, the idea is always the same. Once you stop flattening the world and start modeling it as space, you discover patterns that were hidden before. Voxels make the invisible visible.
See It In Action: Tools and Visuals You Can Explore
This is the part where you can actually try voxels yourself. You do not need special software or technical skills. Just open a link, upload something, or click around. These small experiments make the idea of “tiny cubes in space” feel real.
1. Turn Any 3D Model Into Voxels
There is a simple online voxelizer that lets you upload a 3D model or even an image and turn it into cubes in seconds. You can then rotate it, zoom in, and see how your object becomes a blocky 3D version of itself. It is surprisingly fun to play with, and it teaches you more about voxels than a whole page of text.
Online voxelizer: https://drububu.com/miscellaneous/voxelizer/?out=obj
If you upload a small object like a chair, a toy, or even your own drawing, you will immediately see how voxels build up volume.
2. Explore ESRI’s Voxel Layers
If you want to see how voxels look in real GIS software, ESRI has a clear example page that shows voxel layers for geology, temperature, and underground volumes. The visuals are simple to understand and make it clear how voxel grids store information above and below the surface.
ESRI’s voxel example:
https://pro.arcgis.com/en/pro-app/3.4/help/mapping/layer-properties/what-is-a-voxel-layer-.htm
You can scroll through the page and look at how each cube holds a slice of the environment.
3. Look at Some Voxel Illustrations
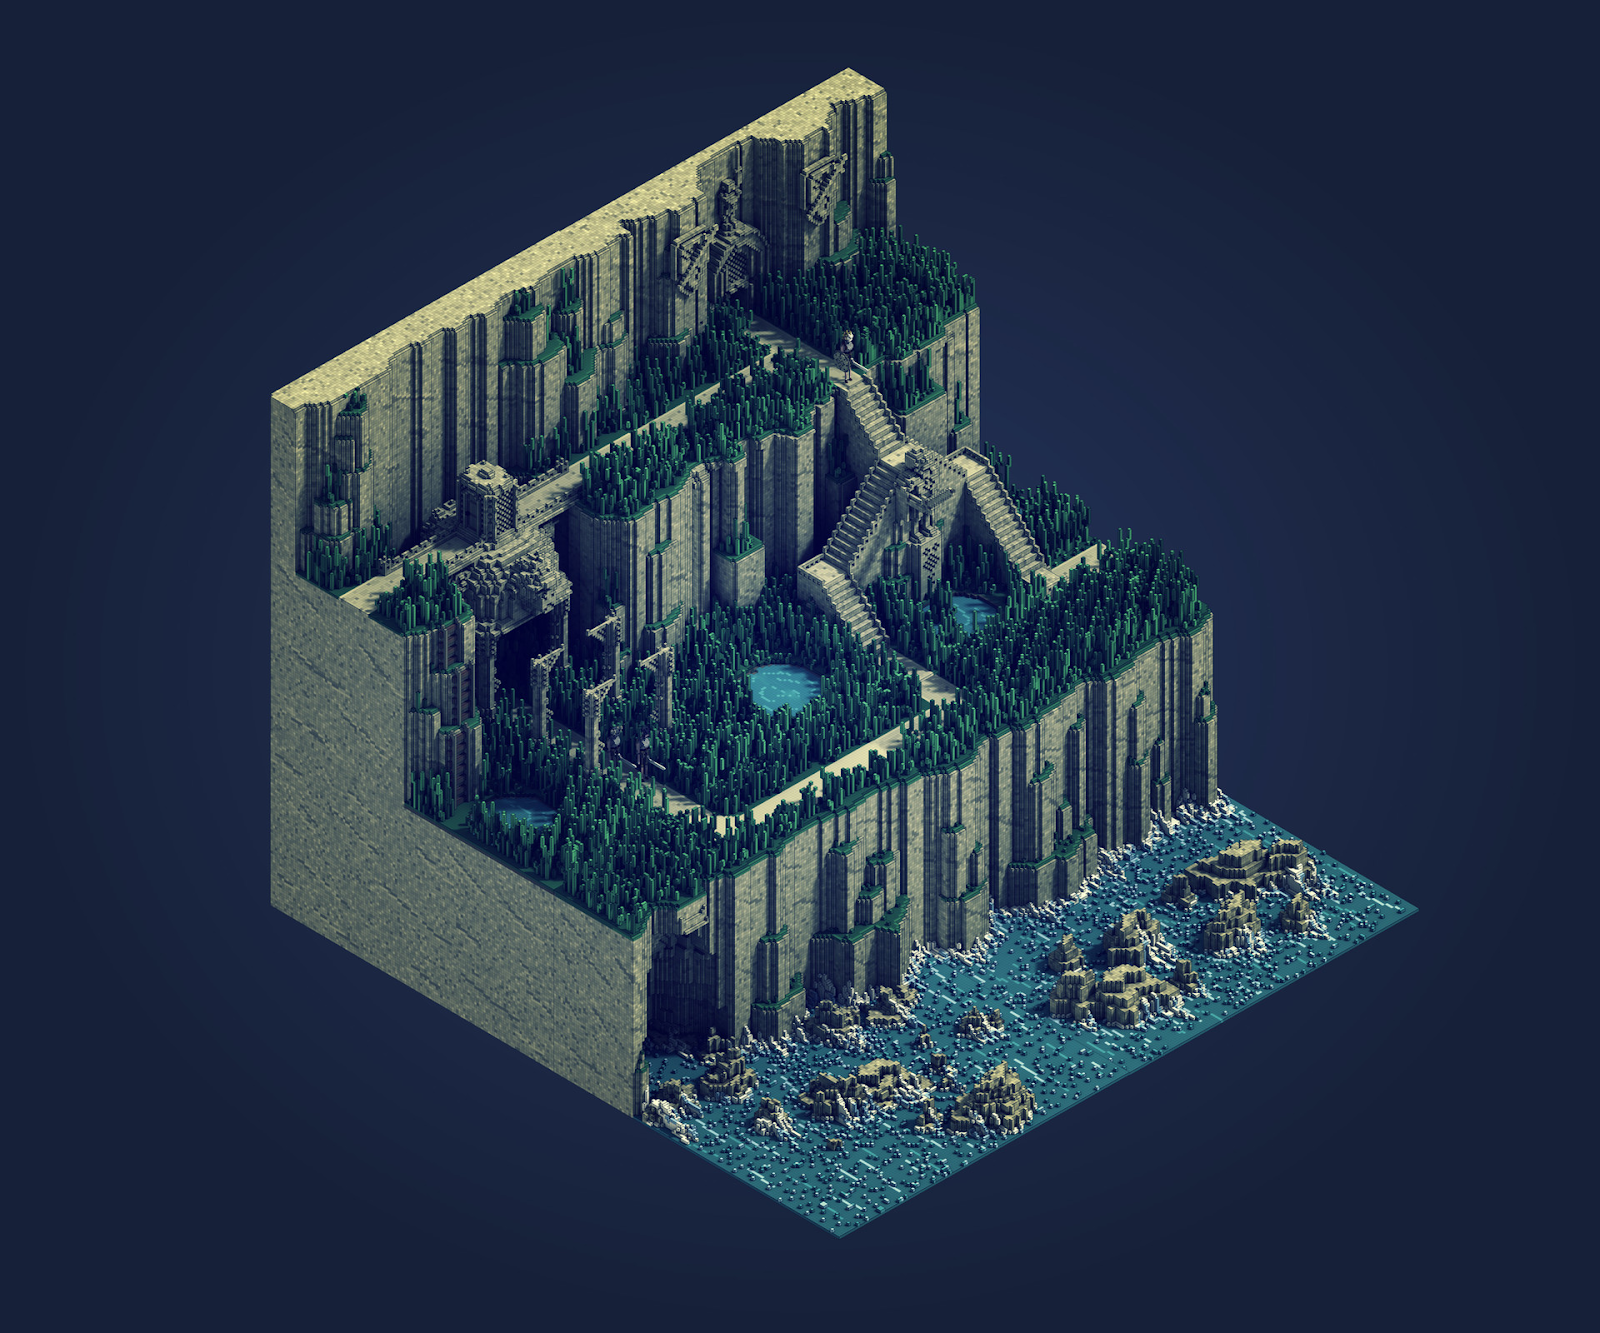
Source: Sir Carma
Source: Sir Carma
The Road Ahead: Challenges and the Cloud Fix
Even though voxels open up a whole new way of seeing the world, they still come with challenges. The biggest one is choosing the right size for each cube. If the cubes are too big, you lose detail. If they are too small, the data becomes huge and slow to work with. It is a balancing act that every project has to think about.
Another challenge is that there is still no universal format for sharing voxel data. Different tools use different ways of storing cubes, which can make it hard to move data from one system to another. This slows down collaboration and makes projects more complicated than they need to be.
But there is also good news. More and more of the heavy lifting is moving to the cloud. Instead of trying to store and process giant voxel models on your own computer, many platforms now let you upload your data and let the cloud handle the rest. This makes even very large 3D and 4D voxel models easier to use.
A clear example of this shift appears in the way companies use platforms like Cesium. Their cloud engine is able to stream large datasets, work with 3D Tiles and support new forms of voxel content, making it easier to build big models without worrying about hardware. You can read about the movement toward cloud-based voxel workflows in this overview.
This “voxel and cloud” partnership is becoming the default approach for many teams. The cloud handles the scale. The voxels handle the space. Together, they make it possible to work with complex 3D environments in a way that feels simple from the outside.
As voxel tools grow and the cloud catches up, it becomes clear where things are heading. For a long time, we described the world as a flat surface because that was all our tools could handle. Now we are finally able to describe the world as a space. Not just where things are, but what fills them, how they change, and how they connect. Voxels make this possible simply and intuitively. The question is not whether they will become part of everyday mapping, but when. With better tools, clearer standards, and the support of the cloud, that moment is much closer than most people think.
See more:
https://learn.arcgis.com/en/projects/visualize-social-distancing-across-california/
https://mhinfographics.com/2024/12/19/tutorial-how-to-create-this-voxel-styled-map/
https://www.voxelmaps.com/100-cities
Did you like this post? Read more and subscribe to our monthly newsletter!
#Contributing Writers
Next article
Geospatial Credit Scoring: Mapping Financial Trust through Location Intelligence
This article explores how geospatial technologies can reshape credit scoring by linking financial trust to location-based data. The goal is to show how satellite imagery, GIS, and artificial intelligence can make credit systems more inclusive, especially for people who are “credit invisible”. It also examines the ethical and regulatory challenges that come with using location data in finance.
1. The Geography of Credit
Creditworthiness has long been measured through a few financial numbers based on bank records, loans, and formal employment. Yet millions of people do not appear in these systems. About 1.4 billion adults still live without a bank account, and many others earn and spend only in cash.
These individuals are not necessarily risky borrowers. They are “credit invisible” because traditional data sources cannot capture their economic activity. The same problem affects small and medium enterprises that operate informally or lack updated documentation. This invisibility creates a financing gap that limits growth and inclusion.
Geospatial Credit Scoring (GCS) offers a new perspective. Using spatial data can reveal the environmental and social context behind financial behavior. It helps lenders see more than numbers and better understand the communities where borrowers live and work.
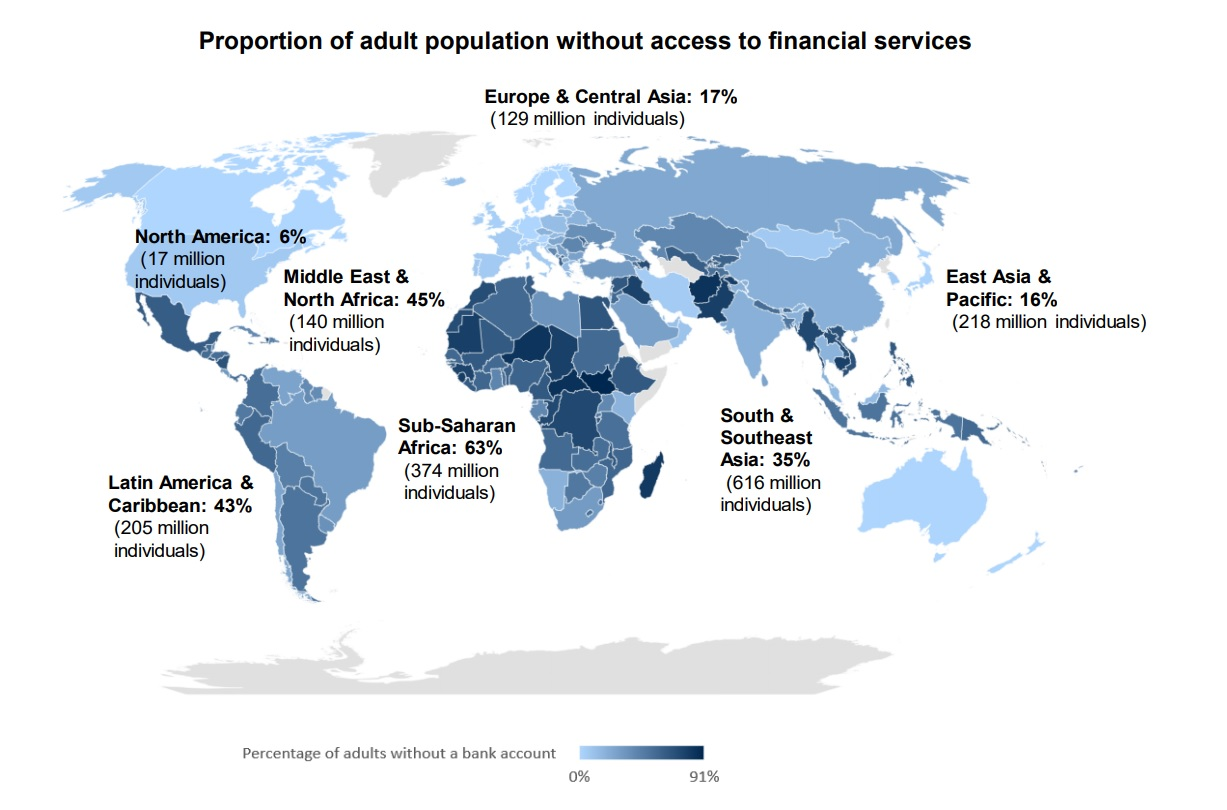
Proportion of adult population without access to financial services. Source: Payments Cards & Mobile
2. What Is Geospatial Credit Scoring?
GCS combines financial analytics with Geographic Information Systems (GIS), satellite imagery, and machine learning. Instead of relying only on bank records or repayment history, GCS uses data from the physical and socioeconomic environment to estimate financial stability.
Every economic activity takes place somewhere, and that location contains valuable information. Infrastructure quality, access to services, energy use, and night-time light intensity all reflect the economic condition of an area. When artificial intelligence analyzes these spatial patterns, it can help predict creditworthiness in regions where traditional financial data is limited or unreliable.
In short, GCS provides a contextual view of borrowers. It complements existing financial data by showing how local environments influence economic opportunity and resilience.
3. The Indicators That Matter
GCS relies on measurable spatial indicators that reflect local economic conditions. These signals come from open data sources and satellite imagery available for most of the world.
-
Night-Time Light Intensity
One of the most widely used proxies is night-time light intensity, captured by satellite instruments such as the Visible Infrared Imaging Radiometer Suite (VIIRS). Areas with stronger and more stable illumination generally correspond to higher levels of economic activity. In rural or data-scarce regions, this single variable can serve as a stand-in for GDP, employment, and infrastructure quality. Researchers have shown clear correlations between night-time lights and income distribution, though the data can be noisy over short periods or in small geographies.
-
Infrastructure and Accessibility
Access to infrastructure often tells a more direct story about opportunity and risk. The density of paved roads, proximity to markets or banks, and availability of public services like schools and hospitals all influence economic stability. Borrowers who live or operate in well-connected areas generally face lower operational costs and higher resilience, making them statistically less likely to default.
-
Land Use and Property Characteristics
High-resolution imagery from missions such as Harmonized Landsat and Sentinel-2 (HLS) provides data on land use, vegetation cover, and building materials. In agriculture, for instance, satellite data helps lenders assess crop health and yield patterns, allowing them to tailor loans or insurance for farmers who lack formal collateral. For urban borrowers, land-use data can indicate property value, construction activity, and the overall vitality of a neighborhood.
-
Mobility and Economic Flow
Mobile phone metadata, where permitted and anonymized, adds another layer by revealing mobility patterns. A borrower whose phone shows consistent movement between work, home, and commercial centers may indicate stable employment. Aggregated patterns of foot traffic or digital payments can highlight local business activity, which strengthens regional risk assessments.
-
Environmental and Climate Context
Finally, geospatial models include exposure to natural hazards such as floods, droughts, or landslides. This matters not only for insurance but also for predicting credit performance, since a climate shock can affect repayment capacity even for borrowers with strong personal histories.
4. How Geospatial Credit Scoring Works
Step 1: Data Collection
Most GCS systems use open and public data sources. Satellite programs such as NASA’s Landsat and the European Space Agency’s Sentinel missions provide free, high-resolution imagery. These are combined with geodemographic data on population, road networks, and land use. Where available, mobile phone or transaction data can add behavioral insights.
Step 2: Feature Engineering
Raw satellite pixels and coordinates must be transformed into structured features, which are numbers that describe a location. Examples include average night-time light brightness, distance to the nearest market or bank, and the density of paved roads. Analysts also study how these values change over time. For instance, increasing light intensity or new building activity may signal economic growth.
Step 3: Modeling
Machine learning algorithms such as gradient boosting or neural networks learn the relationships between spatial features and loan performance. More advanced models use Graph Neural Networks (GNNs) to capture spatial relationships between borrowers or assets. If defaults cluster in one neighborhood, the model can infer contagion risk and adjust future lending behavior accordingly. In some markets, GCS models are combined with mobile phone behavioral data, such as top-up frequency or digital wallet activity. Studies have shown that combining these sources can significantly improve prediction accuracy compared to using either alone.
Step 4: Validation and Explainability
To ensure reliability, models are tested using spatial cross-validation techniques that account for geographic diversity. Explainable AI frameworks are also used to make the results transparent. Platforms, such as MSCI’s GeoSpatial Asset Intelligence, are built with transparency at their core, utilizing extensive data provenance and rigorous validation. For instance, a model can show that “proximity to major roads” or “increase in night-time light intensity” contributed most to a borrower’s score. This transparency is vital for regulatory compliance and customer trust.

5. Real-World Applications and Innovation
Emerging Markets: Credit Where None Existed
In many parts of Africa, South Asia, and Latin America, formal financial records are scarce, yet mobile and location data are abundant. Companies such as Tala, JUMO, and Branch use geospatial and behavioral signals to assess borrowers who lack credit histories.
Tala, for example, analyzes GPS consistency, travel patterns, and proximity to business hubs alongside phone and transaction data. This approach has supported more than a billion dollars in microloans with repayment rates above 90 percent. JUMO and Branch use similar models to estimate borrower stability based on movement and spending patterns.
These systems show that economic behavior leaves a spatial footprint. A small shop owner in Nairobi or Dhaka may not appear in financial databases, but satellite and mobile data can reveal the health of their business environment and community.
Agriculture and Small Business Lending
Geospatial analytics also improve access to credit in agriculture and small enterprises. Remote sensing can monitor crop health, detect droughts, and estimate yields before loans are issued. For urban or peri-urban businesses, factors such as road density and nearby schools or markets help indicate customer demand and growth potential.
Public Sector and Development Finance
Institutions such as the World Bank and UN Development Programme (UNDP) use spatial data to identify underserved communities and design financial inclusion programs. Private platforms like Atlas AI and GeoAnalytics Africa integrate satellite data with socioeconomic modeling to produce neighborhood-level indicators of wealth, risk, and opportunity.
6. Regulation and the European Perspective
In Europe, the main challenge for geospatial credit scoring is not technical but legal. The European Union places strict limits on how automated systems can influence financial decisions.
The German Example
Germany’s credit system is led by SCHUFA, the country’s main credit bureau. In December 2023, the Court of Justice of the European Union ruled that SCHUFA’s automated decision-making falls under Article 22 of the General Data Protection Regulation (GDPR). The court decided that any automated decision that significantly affects a person’s access to credit must include human oversight or explicit consent. This ruling sets a strong precedent across Europe.
The EU Artificial Intelligence Act
The upcoming EU AI Act strengthens these protections. It classifies AI systems used in credit scoring as “high risk” and requires bias testing, transparency, and human accountability. Any system that resembles social scoring or results in discrimination is prohibited.
For lenders, this means geospatial features can be used to visualize and manage risk, but they cannot be the sole basis for automated lending decisions. Human review remains essential.
7. Ethical and Privacy Considerations
Geospatial data is incredibly powerful, but it can also be deeply personal. The places people visit, the neighborhoods they live in, and the routes they take reveal intimate details about their lives. Used irresponsibly, this data can enable surveillance or discrimination.
Data Sensitivity
Location data must always be anonymized, aggregated, and stored securely. Borrowers should know how their data is collected and used. They must also have the option to refuse automated profiling or request human review of credit decisions.
Bias and Fairness
Even when demographic factors such as race or gender are excluded, geography can act as a proxy for inequality. Poorer areas may have weaker infrastructure or lower night-time light intensity, which could bias a model against their residents. Developers should conduct fairness audits to check for uneven performance across regions and income levels.
Transparency and Explainability
Borrowers have the right to understand why they were approved or denied credit. Explainable AI frameworks make this possible by identifying the most influential spatial features, such as road access or infrastructure growth. Transparency builds trust between lenders, regulators, and customers.
8. The Road Ahead: Promise and Practical Reality
Geospatial Credit Scoring offers major potential but also significant challenges. Its success will depend on how well institutions balance innovation, regulation, and ethics.
Opportunities
GCS can expand financial inclusion by using open, verifiable data to assess borrowers who lack formal credit histories. It strengthens risk management by revealing spatial patterns of stability or stress and supports sustainable finance through a better understanding of climate and environmental risks.
Challenges
Building reliable GCS models requires technical skill, quality data, and strong governance. Satellite information can be inconsistent, and privacy concerns remain high. Regulatory frameworks such as the EU’s GDPR and AI Act add complexity, while many traditional institutions are slow to adopt data-driven systems.
The Way Forward
The most practical path is hybrid adoption, where GCS complements existing credit methods. Pilot projects in agriculture, small business, and development lending can demonstrate value while minimizing risk. Regulators can encourage experimentation through innovation sandboxes and clear guidelines.
As data quality improves and AI becomes more transparent, geospatial intelligence is likely to become a standard layer of credit analytics. It can help create fairer, more inclusive, and more sustainable financial systems.
The future of credit may well be written in coordinates. Geospatial credit scoring is still young, but its direction is clear. It reminds us that economic opportunity is not just about numbers; it is about context. If we use it responsibly, balancing precision with privacy and efficiency with empathy, it could transform how the world defines financial trust.
Did you like this post? Read more and subscribe to our monthly newsletter!

