#Business

The new version of Google Earth’s KML allows for Virtual Tours. Is it Google attempt at Apple’s Flyovers?

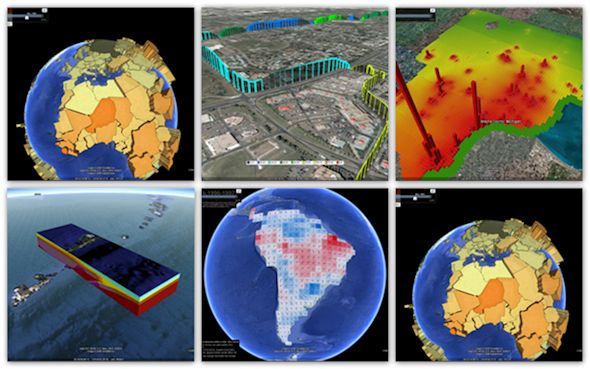
KML_examples

Google Earth is an awesome tool and an impressive achievement. It redefined how people all around the world think about location information. There are no doubts about that.

Not everyone knows that besides browsing satellite images, Google Earth allows you to add your own data layers directly to the app. It is possible via so-called KML files.

KML stands for Keyhole Markup Language and if you understand HTML/XML you will have little problem understanding its syntax. Essentially KML is Google Earth’s format for storing and visualizing external geospatial data: points, lines and polygons in 4D (3D location and time).

Last week Open Geospatial Consortium – the geospatial standardization forum announced approval of the new version of KML format 2.3 which allows for easy creation of virtual tours.

This new feature enables a user to specify aspects of a controlled virtual flight through a series of geographic locations, including speed, mode of flight (smooth or bounce), sound tracks and how KML features are updated throughout the tour.

Is it Google attempt to take over Apple’s Flyover feature? It seems so. It might allow for a similar effect but created by users rather than predefined by Apple or Google. Sounds cool.

source: OGC

Say thanks for this article (0)
The community is supported by:
Become a sponsor
#Business
#Business #Featured
The Earth Observation Hub Report: 2024 Industry Trends and Analysis
Avatar for Muthukumar Kumar
Muthukumar Kumar 03.13.2024
AWESOME 4
#Business #GeoDev
3 Pathways For Integrating Planet Data Into Your GIS Workflow
Avatar for Sponsored Article
Sponsored Article 08.12.2024
AWESOME 1
#Business #Featured #GeoDev
Geo Addressing Decoded, Part 3: Diving into the Key Features of Precisely’s Geo Addressing System
Aleks Buczkowski 06.29.2024
AWESOME 4
Next article
#Ideas

The most precise 3D map of Earth’s interior

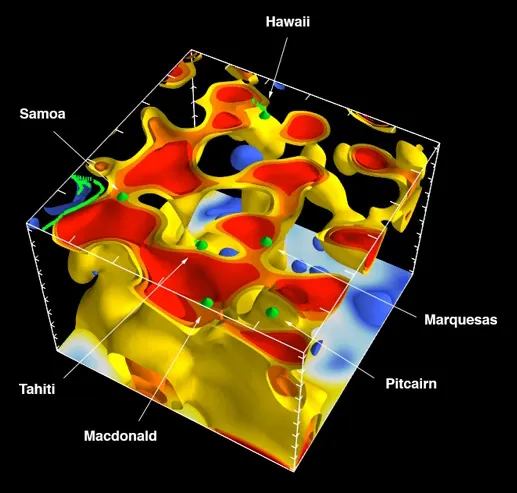
The 1,800-mile thick mantle under the Pacific Ocean contains rising plumes of hot rock that fan out at the surface to stationary hotspots, where they generate island chains as Earth’s crust moves due to plate tectonics. Scott French image.

The 1,800-mile thick mantle under the Pacific Ocean contains rising plumes of hot rock that fan out at the surface to stationary hotspots, where they generate island chains as Earth’s crust moves due to plate tectonics. Scott French image.

Seismologists from University of California, Berkeley, have come up with an interesting project. They’ve analyzed paths of seismic waves and based on that created the first-ever detailed 3D map of the Earth’s interior.

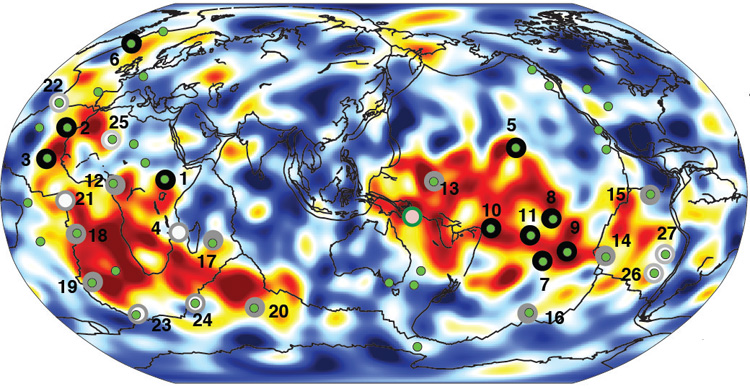
The model shows mantle plumes (where the hot rock flows) starting at the bottom of the core-to-mantle boundary and climbing to the top, where they connect to volcanic hotspots in the Earth’s crust. The model precisely connected volcanic island chains like Hawaii, Samoa and Iceland. Of course it isn’t perfect. It didn’t link plumes to some volcanoes, such as the one at Yellowstone National Park but still it is the most precise scan of the Earth’s interior ever made.

Most of the known volcanic hotspots are linked to plumes of hot rock (red) rising from two spots on the boundary between the metal core and rocky mantle 1,800 miles below Earth’s surface.

Most of the known volcanic hotspots are linked to plumes of hot rock (red) rising from two spots on the boundary between the metal core and rocky mantle 1,800 miles below Earth’s surface.

Previous attempts to map mantle plumes have detected pockets of hot rock rising in areas where plumes have been predicted, but it was unclear whether they were connected to volcanic hotspots at the surface or at the roots of the plumes, deep below the surface of the planet.

Creating this kind of high-resolution CT of Earth, requires significant computing resources. Scientists used very accurate numerical simulations of how seismic waves travel through the mantle, and compared their predictions to the ground motion actually measured by detectors around the globe. The analysis required 3 million CPU hours on supercomputers, and tool couple of weeks of computing.

It is interesting that we are thinking about exploring Mars but we still now so little about what’s beneath us.

source: Berkeley News

Read on
Search