The Art of Acquiring Vector Data: A Simple Way to Do Precision Mapping
Vector data reigns supreme in the GIS world. Among the two primary data types used in GIS (raster and vector), vector data is distinguished by its precision, adaptability, and clarity. It is a system of representing the world in points, lines, and polygons. Vector data forms a digital framework of our physical and conceptual spaces. From detailed road networks to land use maps, vector data is fundamental to numerous applications, making its acquisition a critical skill for GIS professionals and enthusiasts.
What is Vector Data?
At its core, vector data is a representation of the world using geometric shapes. Each shape carries specific information.
- Points: Represent discrete locations, such as landmarks or fire hydrants.
- Lines: Depict linear features such as roads, rivers, or pipelines.
- Polygons: Enclose areas to define land parcels, lakes, or urban boundaries.
Have you heard of the phrase”Raster is faster and vector is corrector”? Vector data is distinguished by its scalability and rich set of attributes. Unlike raster data, which is pixel-based, vector data retains its resolution regardless of zoom level.
That’s because each feature in vector data is associated with attributes stored in a table, allowing users to query and analyze data.
Why Use Vector Data?
It is a powerful tool and especially useful in:
- Urban Planning: Mapping zoning boundaries, utility networks, and transportation corridors.
- Environmental Monitoring: Tracking deforestation, land use changes, and protected areas.
- Disaster Management: Identifying flood zones, evacuation routes, and critical infrastructure.
- Navigation: Creating roadmaps, cycling trails, and maritime charts.
Its versatility makes vector data a cornerstone of modern GIS projects, helping professionals across disciplines to visualize and analyze spatial information.
Top 16 Free Sources of GIS Vector Data
Access to quality vector data has become easier than ever, thanks to a plenty of free online resources. Here are 16 outstanding sources to kickstart your GIS projects (by Mashford Mahute):
| Source | URL | Data | Format | Use Case |
| OpenStreetMap (OSM) | openstreetmap.org | Roads, buildings, land use | Shapefile, GeoJSON, OSM XML | Navigation systems, urban planning |
| Geofabrik | download.geofabrik.de | Region-specific extracts of OSM data | Shapefile, GeoJSON, PBF | Regional studies |
| Humanitarian Data Exchange (HDX) | data.humdata.org | Population, infrastructure | Shapefile, GeoJSON, CSV | Disaster response and relief planning |
| HYDROSHEDS | hydrosheds.org/products | Rivers, lakes, basins, waterfalls | Shapefile | Hydrological and environmental modeling |
| FAO GeoNetwork | fao.org/geonetwork | Agriculture, fisheries, environmental datasets | Shapefile, GeoJSON | Agricultural planning, resource management |
| USGS Earth Explorer | earthexplorer.usgs.gov | Hydrography, transportation, boundaries | Shapefile, KML | Geospatial research, mapping |
| Natural Earth | naturalearthdata.com | Political boundaries, cultural and physical features | Shapefile, GeoJSON | Cartographic projects |
| European Environment Agency (EEA) | eea.europa.eu | Air quality, biodiversity | Shapefile, GeoJSON | Environmental monitoring, policy development |
| GADM (Global Administrative Areas) | gadm.org | Administrative boundaries | Shapefile, GeoJSON, KML | Governance, policy-making analysis |
| DIVA-GIS | diva-gis.org | Country-level climate, population, administrative boundaries | – | Demographic and environmental studies |
| UNEP Environmental Data Explorer | uneplive.unep.org | Environmental indicators, spatial datasets | Shapefile, GeoJSON | Sustainability-focused projects |
| NASA Socioeconomic Data and Applications Center (SEDAC) | sedac.ciesin.columbia.edu | Population, infrastructure, environmental indicators | Shapefile, GeoJSON, KML | Socioeconomic, environmental analysis |
| World Resources Institute (WRI) Open Data Portal | wri.org/data | Environmental, natural resource datasets | Shapefile, GeoJSON, CSV | Resource management, conservation |
| Global Forest Watch | globalforestwatch.org | Forest cover, deforestation, land use | Shapefile, GeoJSON, KML | Forestry, land management initiatives |
| Africa GeoPortal | africageoportal.com | Administrative boundaries, infrastructure (Africa) | Shapefile, GeoJSON | African development projects |
| Koordinates | koordinates.com | Infrastructure, social data | Shapefile, GeoJSON, KML | Broad applications across multiple sectors |

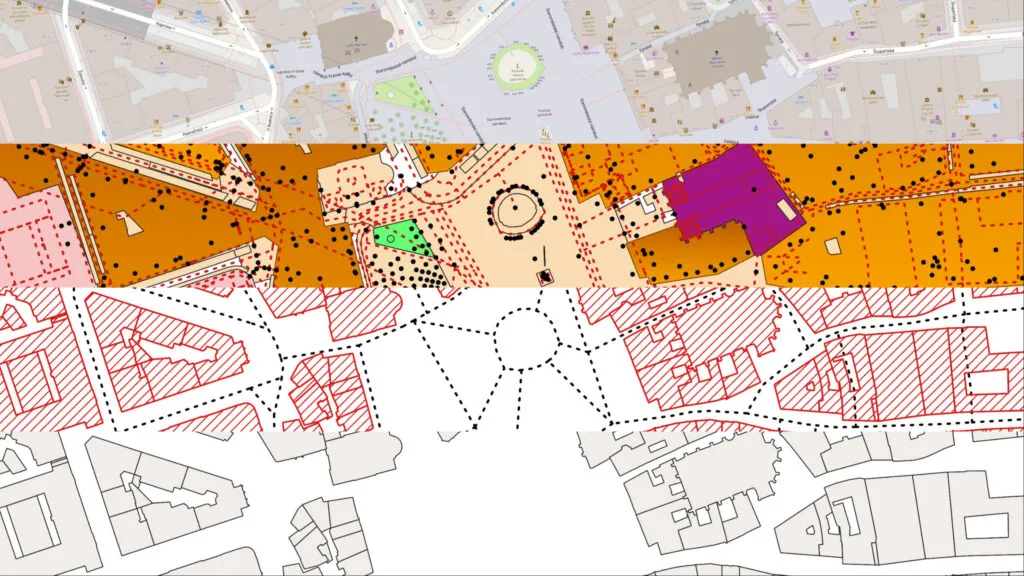
Vector laters for Prague Old Town. Source
How to Choose the Right Data Source?
The selection of a data source depends on the scope and requirements of your project. For global coverage, resources such as OpenStreetMap or Natural Earth are excellent. For regional studies, Geofabrik or Africa GeoPortal are valuable resources. When specificity is important, datasets from FAO GeoNetwork or HYDROSHEDS can provide the granular details needed.
The acquisition of vector data is both an art and a science, requiring a blend of technical know-how and creative vision. With free resources like those outlined above, GIS professionals can unlock a world of possibilities, transforming abstract data into actionable insights. Whether you are charting a city’s growth, mapping critical habitats, or visualizing disaster response scenarios, vector data serves as your canvas for innovation.
Explore vector data yourself and see its potential!
Did you like this article? Read more and subscribe to our monthly newsletter!


