
GIS applications now cover an increasingly broad range. Open-source forest reconstruction, planetary-scale AI, animated micro-scenes, and even star-based navigation all show how the geospatial community continues to redefine what a maps can do.
Planetary Intelligence Takes Shape and Leaves the Internet
A topic running through last month’s conversations is the idea that AI is finally moving beyond the internet. Planet Labs co-founders, writing for the World Economic Forum, articulate the shift clearly: for a decade, AI learned from what humans uploaded: text, images, video. The next leap is training systems on continuous, real-time sensor feeds from orbit, creating what they call planetary intelligence. It is a vision of machines that understand the Earth as a living system, not as a static document. This would allow the machines to inform decisions on climate adaptation, food security, and economic risk in near real-time.
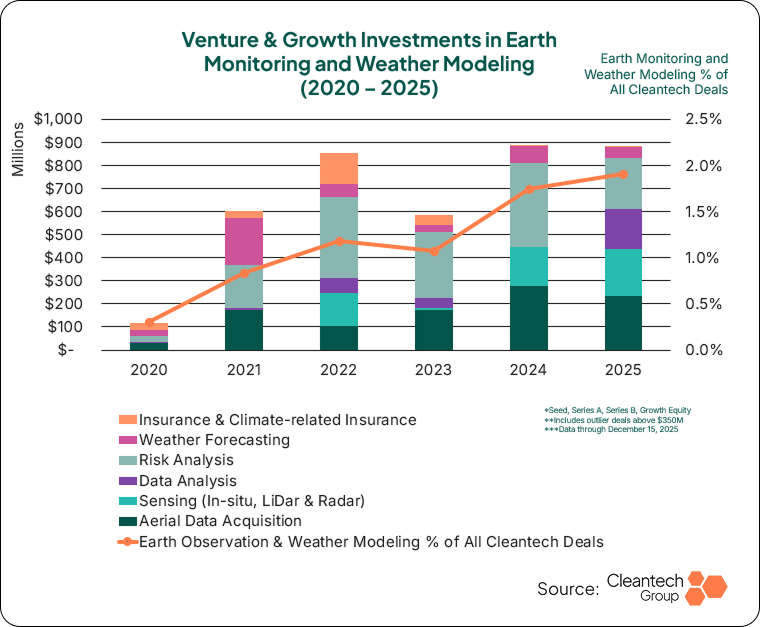
That ambition is no longer theoretical. NVIDIA’s Earth-2 family of open models, released at the American Meteorological Society’s Annual Meeting, delivers the world’s first fully open, accelerated weather AI software stack, covering everything from initial observation data processing to 15-day global forecasts and local storm nowcasting. With generative AI trained on satellite and radar observations, Earth-2 puts professional-grade weather modeling within reach of startups, government agencies, and researchers worldwide. Meanwhile, the Cleantech Group documents a broader “resilience revolution” in which AI, Earth observation, and weather technology are being woven together into climate risk infrastructure for insurers, utilities, and city planners.
Satellites as “Eyes” on Forest, Delta, and Ice
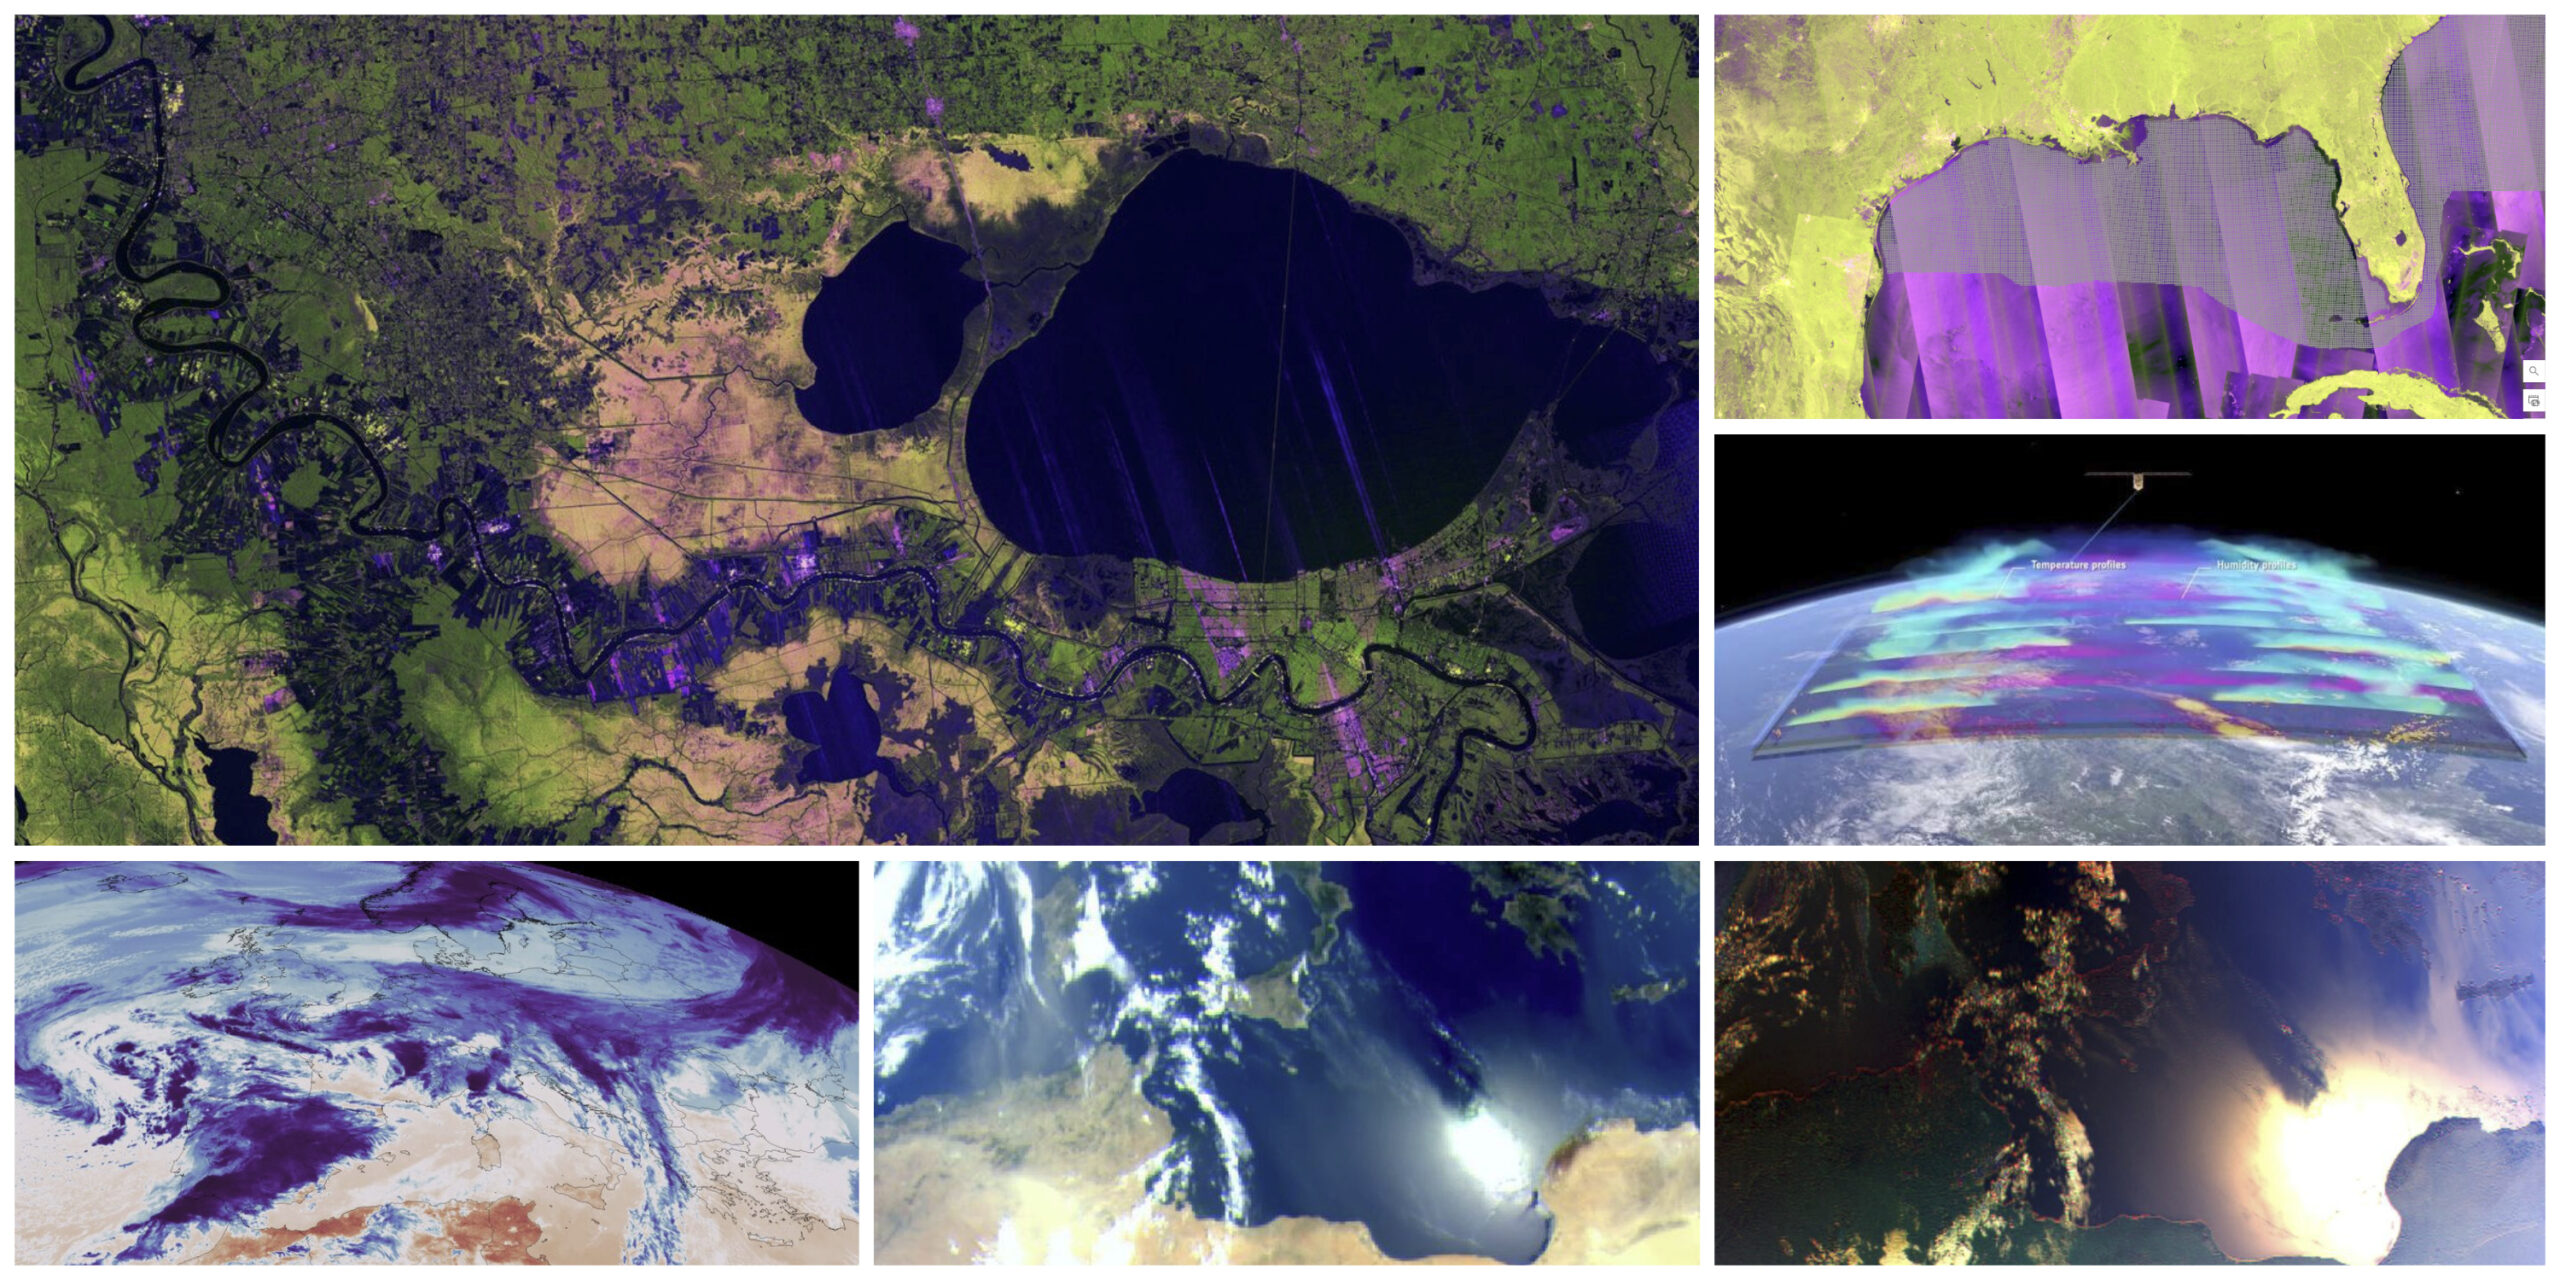
NASA-ISRO’s NISAR mission has demonstrated its cloud-piercing dual-band SAR capability with a vivid image of the Mississippi River Delta, distinguishing healthy forest canopy, thinning tree populations, and tall crops by color, all captured through cloud cover on a single pass. It is a preview of what continuous, all-weather land monitoring at this resolution will mean for wetland management, agricultural oversight, and flood preparedness worldwide.
Europe’s next-generation Meteosat Third Generation sounder satellite has returned its first images, opening a new chapter in European meteorology, while the Arctic Weather Satellite is launching a dedicated polar-orbit constellation that will boost forecast accuracy in high-latitude regions (These are regions where there has always been a significant lack of data). The EUMETSAT and Copernicus air-quality tracking programme adds another layer, with fresh maps of nitrogen dioxide and sulphur dioxide revealing pollution patterns that ground networks alone could never capture. And for those learning to work with SAR data practically, a new tutorial on mapping oil spills with Sentinel-1 from Esri’s Living Atlas team offers a hands-on entry point.
GeoAI Applications for: Forests, Landslides, and Hidden Development Gaps
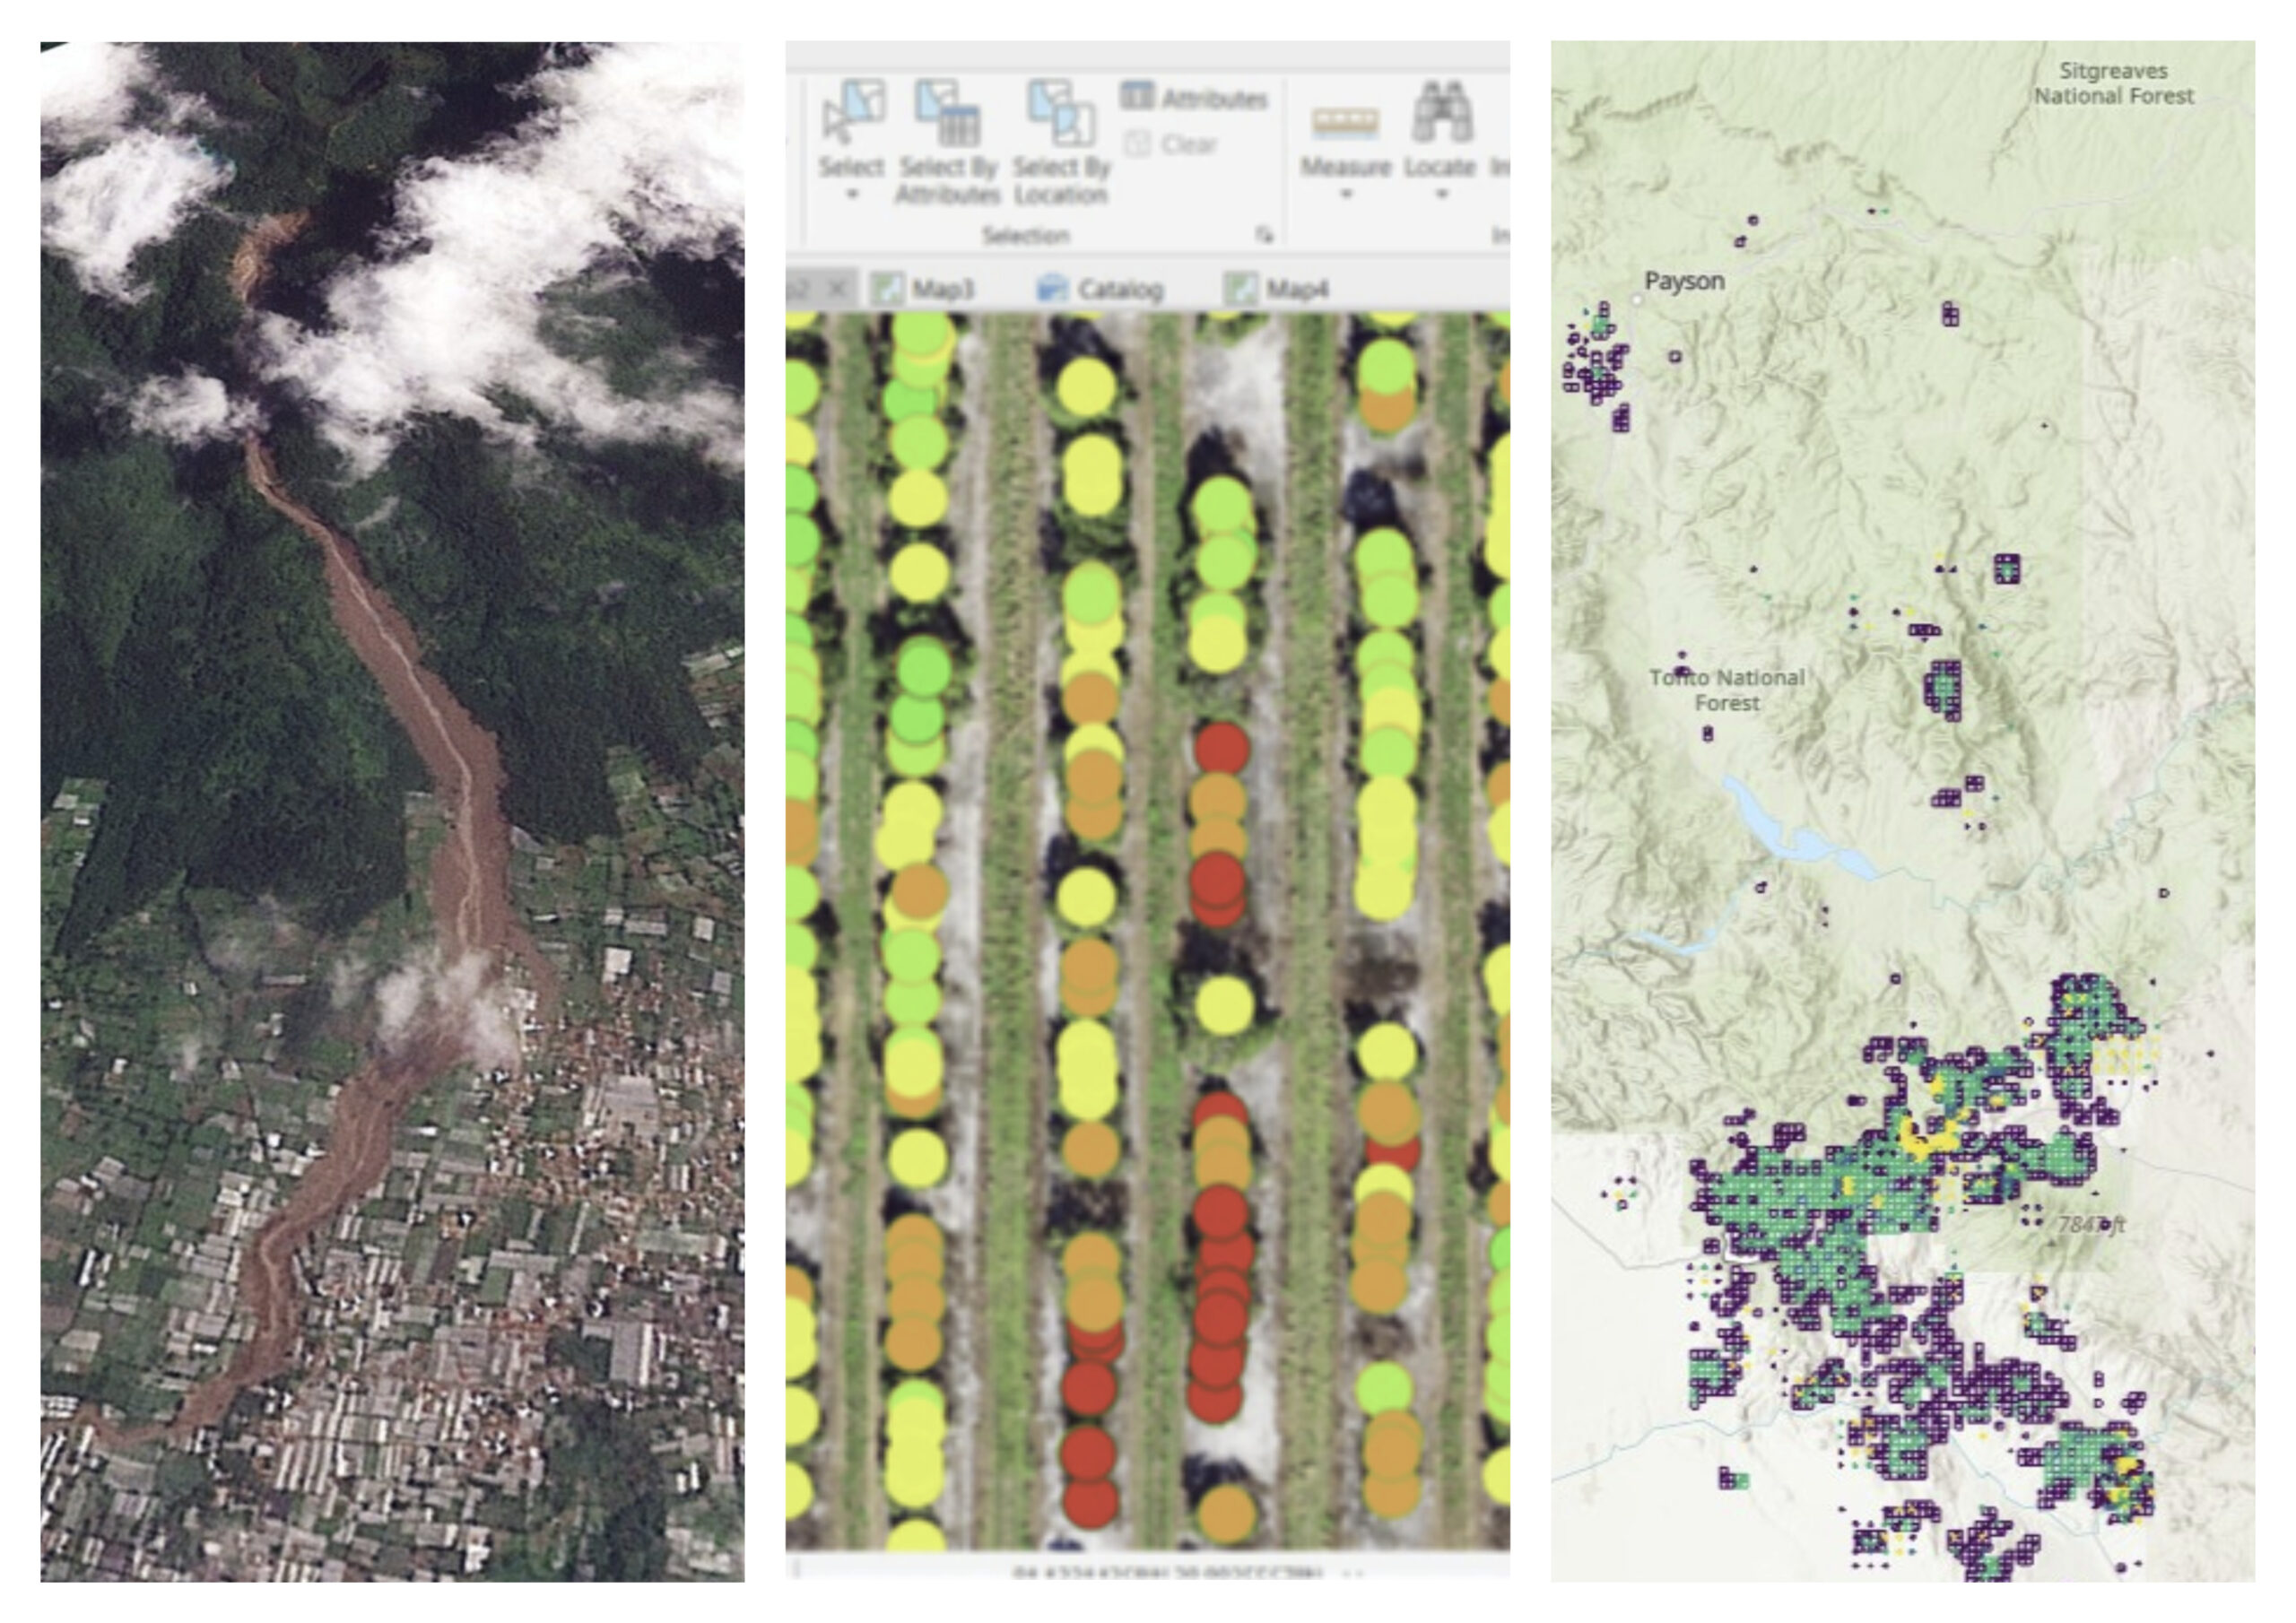
Research institutions are quickly turning orbital data into useful information for the ground. Researchers at Purdue University have achieved full 3D forest reconstruction from remote sensing data using AI, identifying individual trees and reconstructing canopy architecture from aerial point clouds in ways that traditional photogrammetry struggled to achieve. The implications for carbon accounting, biodiversity monitoring, and timber inventory are substantial.
On hazardous terrain, GeoAI is being applied to landslide mitigation. with predictive spatial models identifying vulnerable slopes before events like the Gunung Burangrang landslide can unfold. Using high-resolution elevation data, soil moisture readings from satellites, and AI classification is changing how we manage hazards. We’re moving from reacting to hazards to being able to anticipate them.
Equally striking is work from Stanford, where satellite imagery and AI are being used to reveal development needs that national-level statistics conceal. By disaggregating poverty indicators at sub-kilometre resolution, the research shows how top-down government data can mask sharp local inequalities, and how EO-derived intelligence can help direct resources more precisely. UN-Habitat has also released two new publications to help governments at all levels translate this kind of geospatial evidence into planning and policy action.
Maps in Practice: Utilities, Agriculture, and Real-Time Dashboards
Operational GIS continues to embed itself into critical infrastructure. Washington City Power is modernizing its grid with the ArcGIS Utility Network, achieving a level of asset traceability and outage modelling that older GIS architectures simply could not support. Complementing this, a case study in real-time GIS dashboards for outage response shows how situational awareness tools are reducing restoration times for utilities by giving field crews and operations centres a shared live picture of the network.
Agriculture is another sector where the payoff is becoming measurable. Esri has published a detailed guide on trusted GeoAI applications in agriculture, covering everything from crop stress detection to irrigation scheduling, while the NASA Earth Data training programme on satellite remote sensing for agricultural applications is helping practitioners build the technical skills to access and interpret these data streams independently.
The community around PRISM climate data and Global Surface Water mapping in Google Earth Engine is also growing, with open-source workflows being shared widely to lower the barrier for environmental analysts. For mining professionals, a comprehensive new GIS guide from Esri sets out how spatial analysis underpins everything from exploration targeting to tailings management — a sector where geospatial skills are becoming as foundational as geology itself.
Maps and Cartography Find Their Conscience
Perhaps the most unexpected signal in last month’s feed is that cartographic craft is being taken more seriously. GeoAI Meets Motion argues that animated micro-scenes — short looping geographic visualisations that blend cartography with motion design — are becoming a professional skill for GIS practitioners who want their work to communicate beyond technical audiences. John Nelson’s walkthrough of how to create an origin-destination flow map is another example of craft-level cartographic knowledge being shared openly in the community.
The 2025 ArcGIS StoryMaps Competition finalists are now known, celebrating the best of spatial storytelling across dozens of categories. This is a reminder of how far the medium has matured since its early days. Esri also published a guide on creating 3D printable STL files with ArcGIS Pro, a small but telling sign of how digital and physical fabrication workflows are converging around spatial data.
The ongoing conversation about women in cartography adds an important dimension: mapping has never been a neutral act, and the communities pushing to be seen in maps are often the same ones most affected by the environmental and social crises that geospatial tools are being used to address. In a related vein, students at one university used phones and drones to help a city count its cemetery headstones — the act of a community-scale geospatial service. At the Library of Congress, the Sanborn Map collection is getting a new digital life, keeping a century of urban cartographic memory accessible to researchers and the public.
And then there is astrocartography. National Geographic reports that the practice of overlaying planetary birth-chart positions onto the globe is moving from niche astrology circles into mainstream travel planning, with travelers choosing destinations based on the “energy” of different geographic lines. Whether one believes in it or not, its popularity is a reminder that people have always wanted maps to mean more than logistics, and that the desire to find oneself in a map is as old as cartography itself.
Community, Skills, and Open Science
The open-source dimension of this field remains one of its greatest strengths. The FOSS4G Asia 2026 session on workflow automation with QGIS is packed with practical tips for practitioners who want to move faster without paying for proprietary tools. Qiusheng Wu’s Spatial Signals podcast conversation with AmericaView explores how open geospatial tools are building a generation of analysts fluent in Python, Earth Engine, and satellite data from day one.
Ten simple rules for increasing the usability of Earth observation mission datasets is the kind of methodological contribution that rarely makes headlines but quietly raises the floor for the entire community. And Peter Rabley’s honest reflection on why updating maps is so hard captures something that every GIS professional knows but rarely says aloud: the challenge is less about collecting data and more about the institutional, financial, and human systems required to keep it current.
In the open-source navigation focus area: Google Maps is integrating Gemini for biking and walking navigation, CoMaps is emerging as a serious open-source alternative, and PCMag is putting Google Maps and Waze head-to-head. It is worth stepping back to appreciate how much of navigation apps’ infrastructure rests on the invisible labour of geospatial communities who have been building, correcting, and advocating for better maps for decades.
The planet keeps changing. The maps are trying to keep up.
Did you like the news roundup? Read more and subscribe to our monthly newsletter!


#GeoAI
Next article
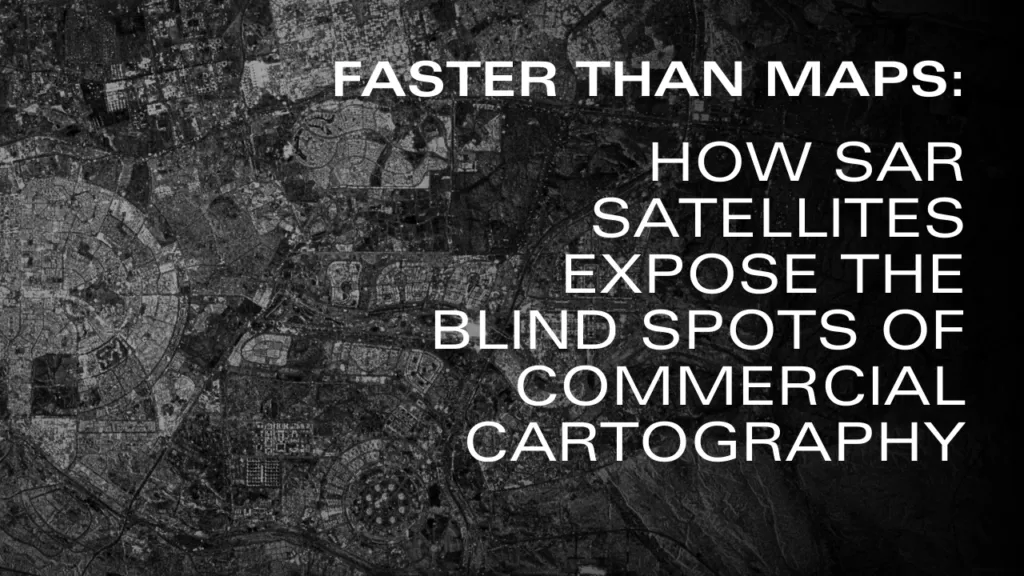
Faster than Maps: How SAR Satellites Expose the Blind Spots of Commercial Cartography

Why commercial maps are falling behind global urbanization, and how multi-modal AI pipelines are the real solution?
If you drop a pin at coordinates 29.96, 31.73 on a standard commercial web map in 2026, you will find a fragmented picture. You might see a skeletal network of roads and scattered clusters of building polygons, but they are surrounded by vast, unexplained gaps of empty beige space. However, switch your view to a recent satellite image, and the missing puzzle pieces immediately appear: a highly dense, fully constructed urban fabric—complete with paved streets and residential blocks—filling every one of those gaps.
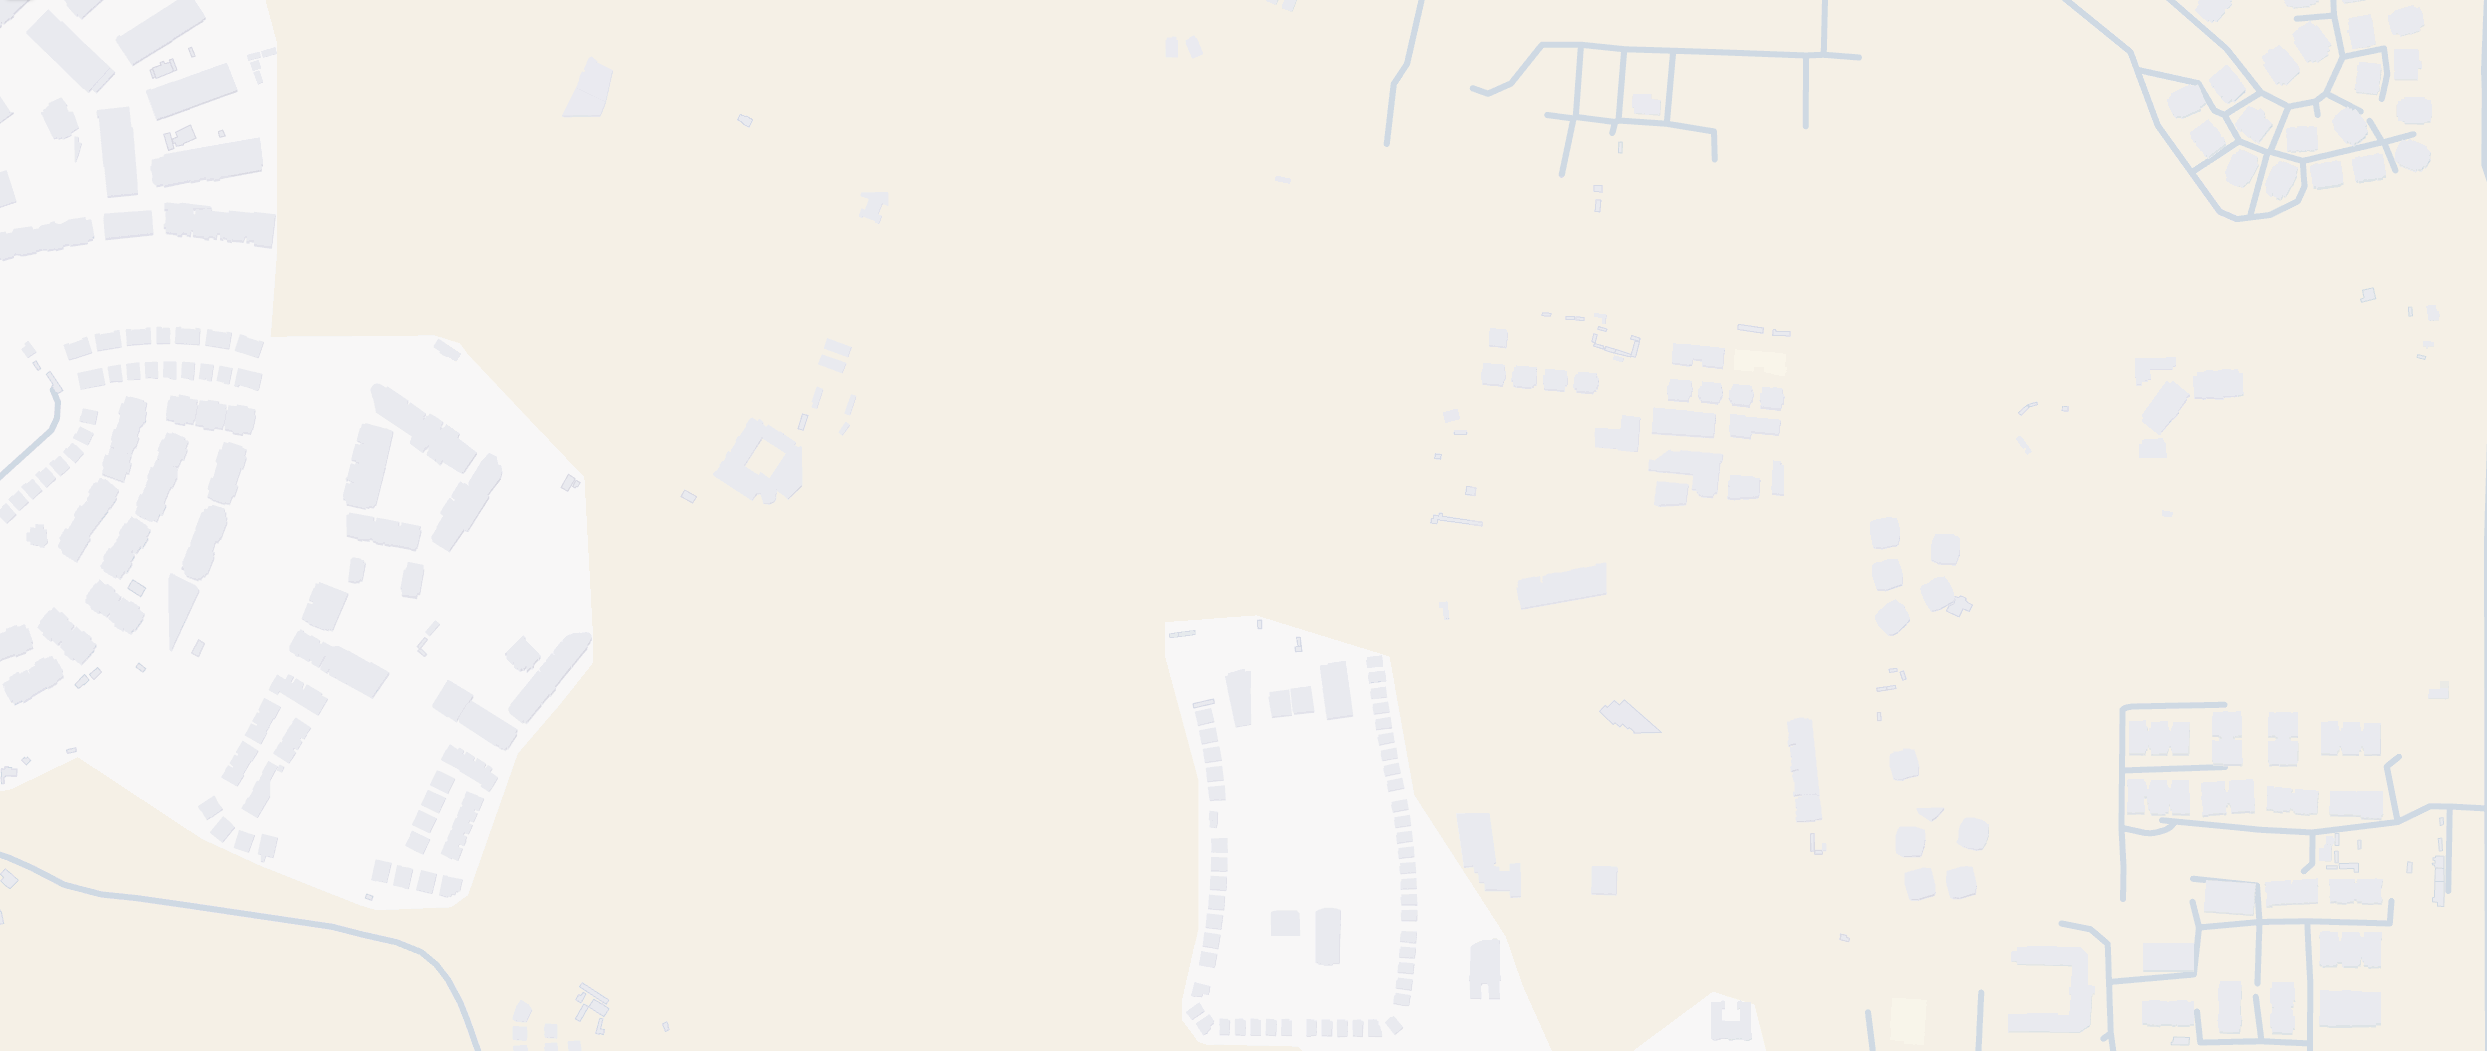
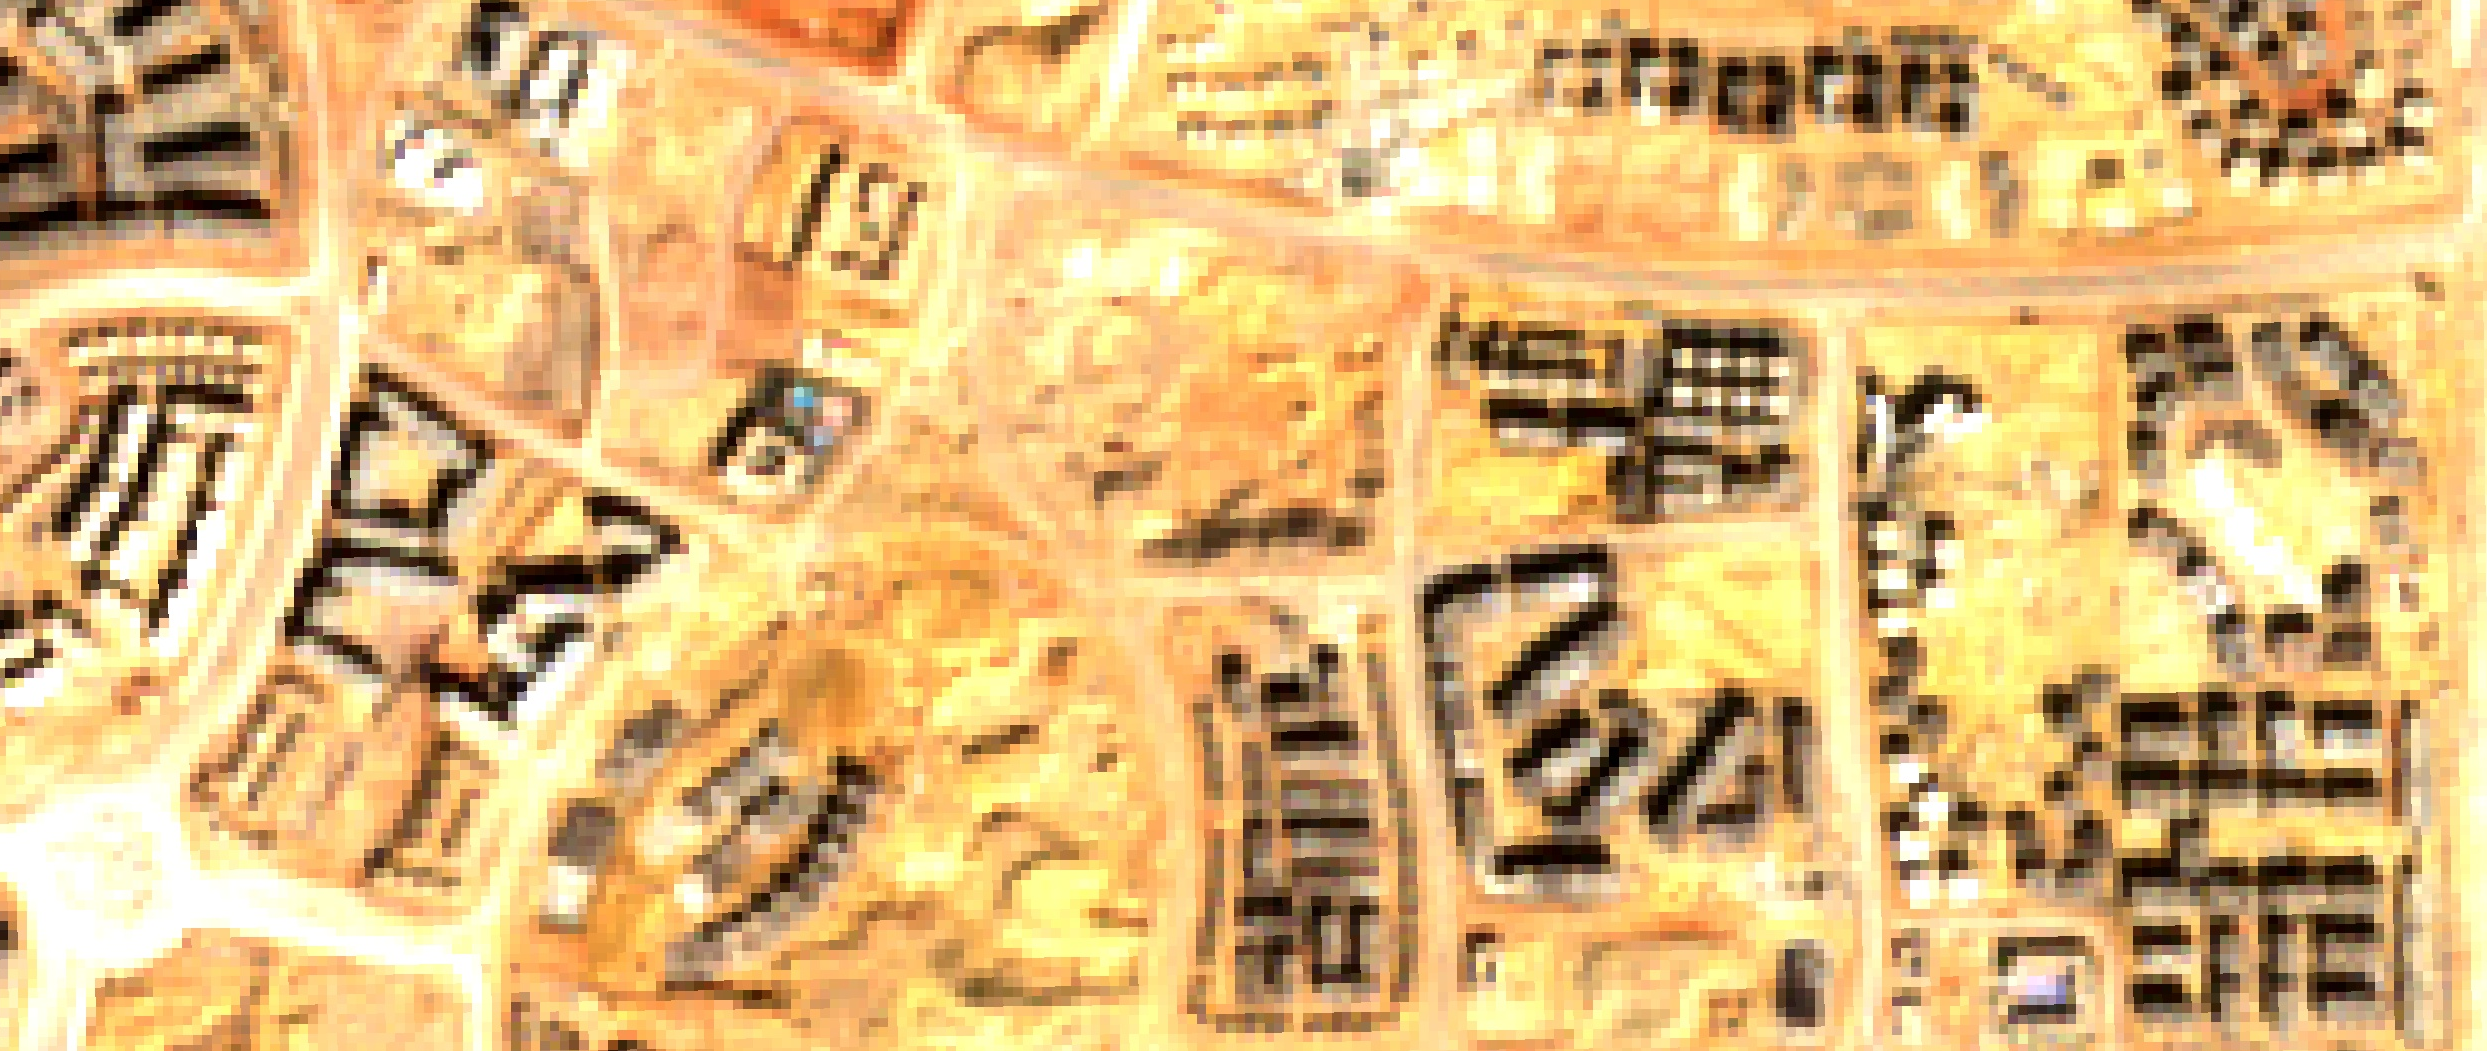
Figure 1: The Cartographic Lag in action (March 2026). Top: Commercial vector maps show an empty desert. Bottom: Sentinel-2 optical imagery reveals the true urban density in the exact same location
This is part of Egypt’s New Administrative Capital. Announced in 2015 with construction beginning in 2016, this megaproject has been growing in the desert for a decade. Yet, what we are witnessing on our screens is the ‘Cartographic Lag‘—a growing phenomenon where concrete is poured significantly faster than human mapmakers, traditional algorithms or new AI methods can update the vectors. When commercial cartography leaves entire neighborhoods invisible, how do we monitor the world’s rapid urban expansion? The answer doesn’t lie in drawing better maps, but in teaching machines to read the planet’s physical structure.
Why does this happen? Traditional map-making, even when assisted by modern Artificial Intelligence, relies heavily on optical satellite imagery. To update a vector map, an algorithm or a human contributor needs a perfectly clear, cloud-free photo to trace the outline of a new building and convert it into a neat polygon. However, commercial high-resolution satellites only revisit the same location occasionally, and the sheer scale of modern megaprojects quickly overwhelms this step-by-step approach. The result is a fragmented spatial database where the map becomes obsolete the moment the concrete dries—a problem that disproportionately affects the Global South—from the megaprojects of the Middle East to the rapidly expanding informal settlements of Latin America—, where rapid urbanization outpaces the commercial priorities of tech giants. Relying solely on optical extraction means we are always looking at the past.
To bypass this cartographic bottleneck, we must stop looking at colors and start measuring geometry. This is where Synthetic Aperture Radar (SAR) from satellites like Copernicus Sentinel-1 becomes a game-changer. Unlike optical cameras, radar sensors don’t care about clouds, weather, or daylight; they emit microwaves that bounce back strongly when hitting solid, human-made structures like steel and concrete.
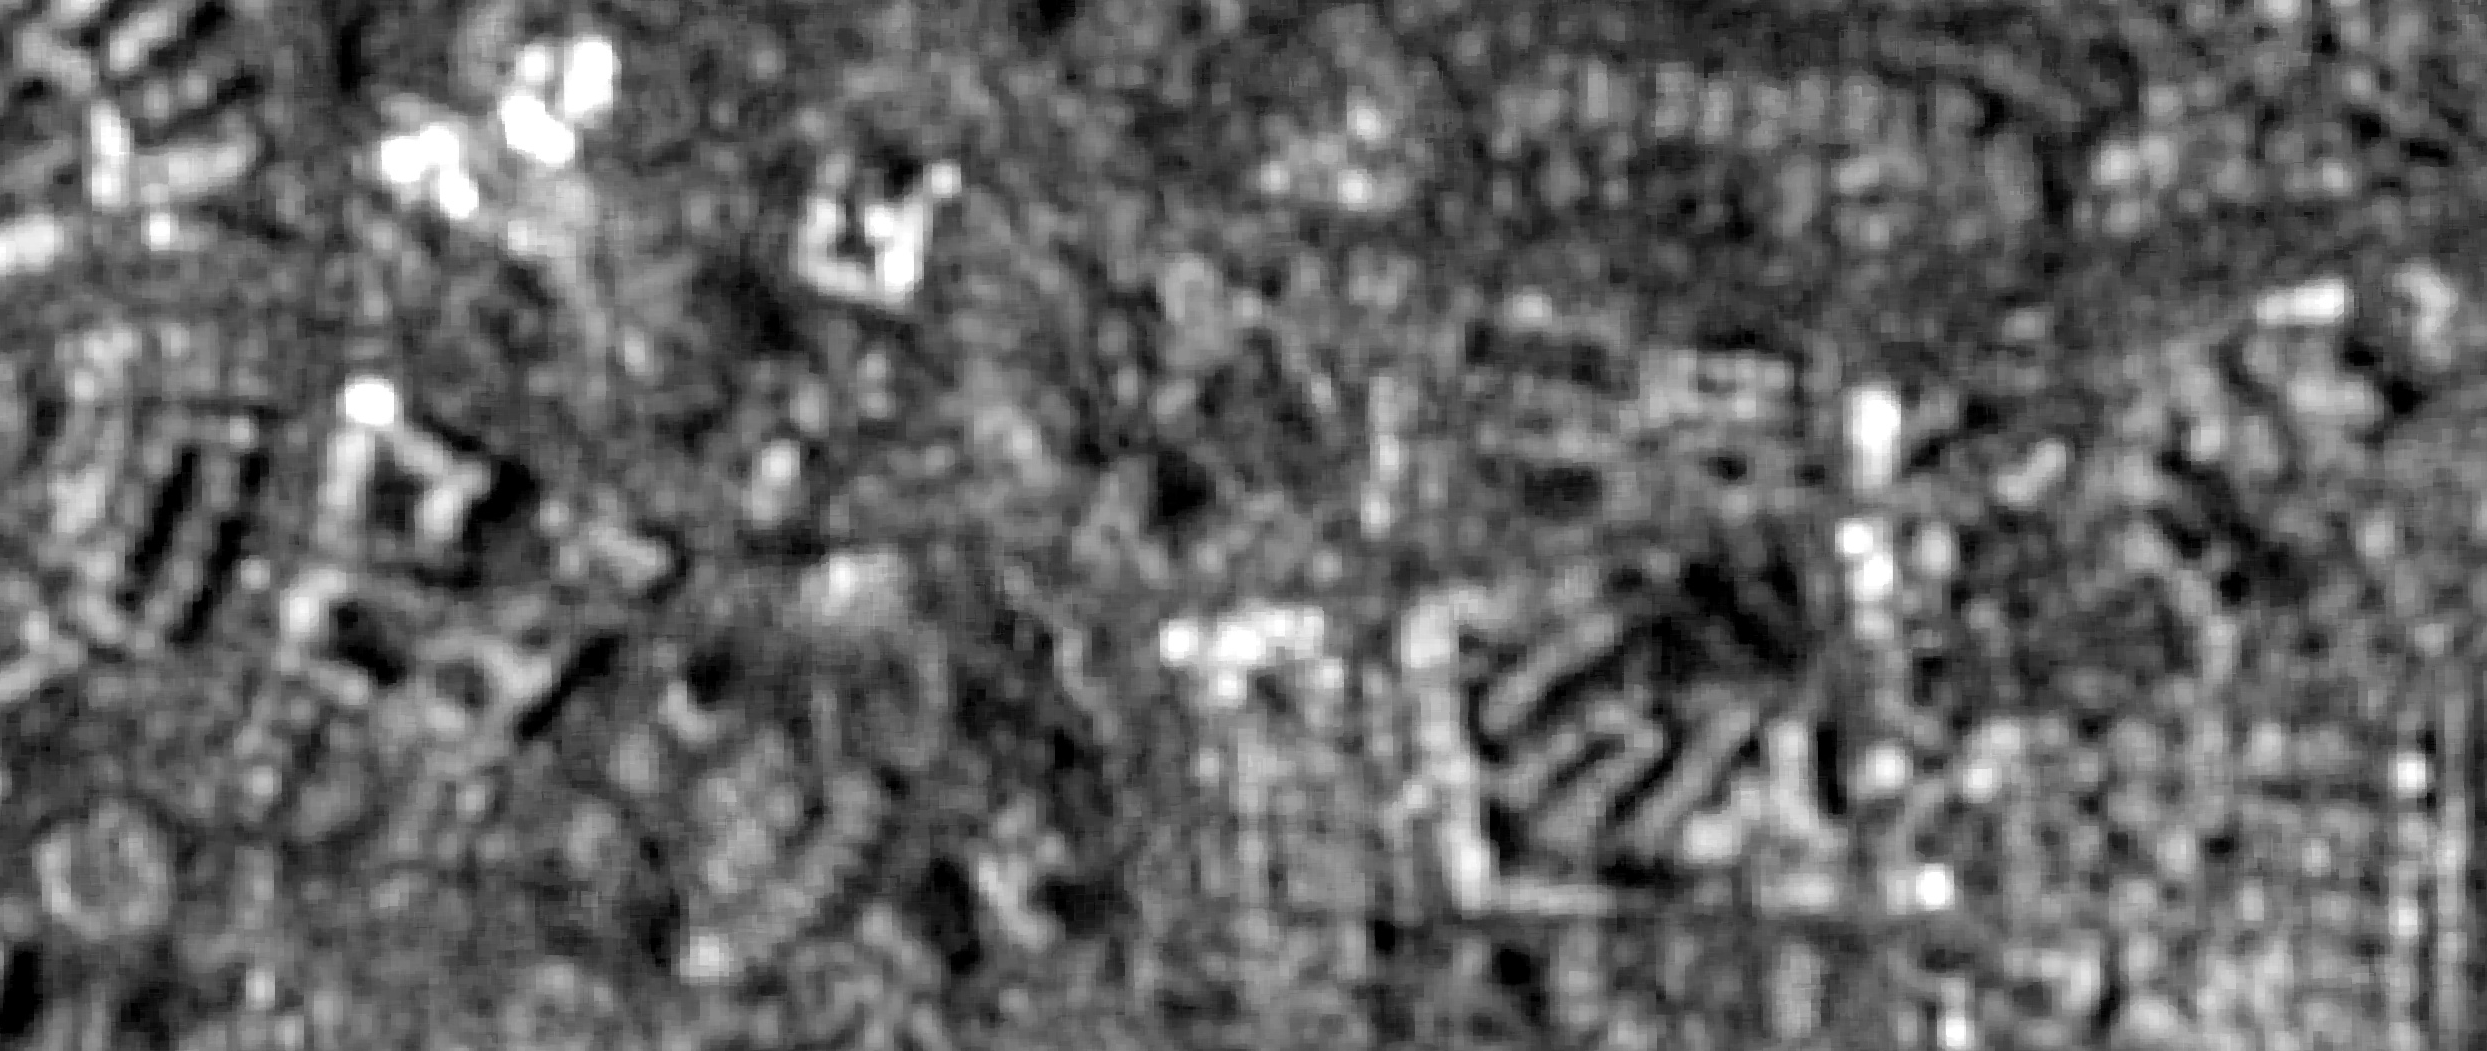
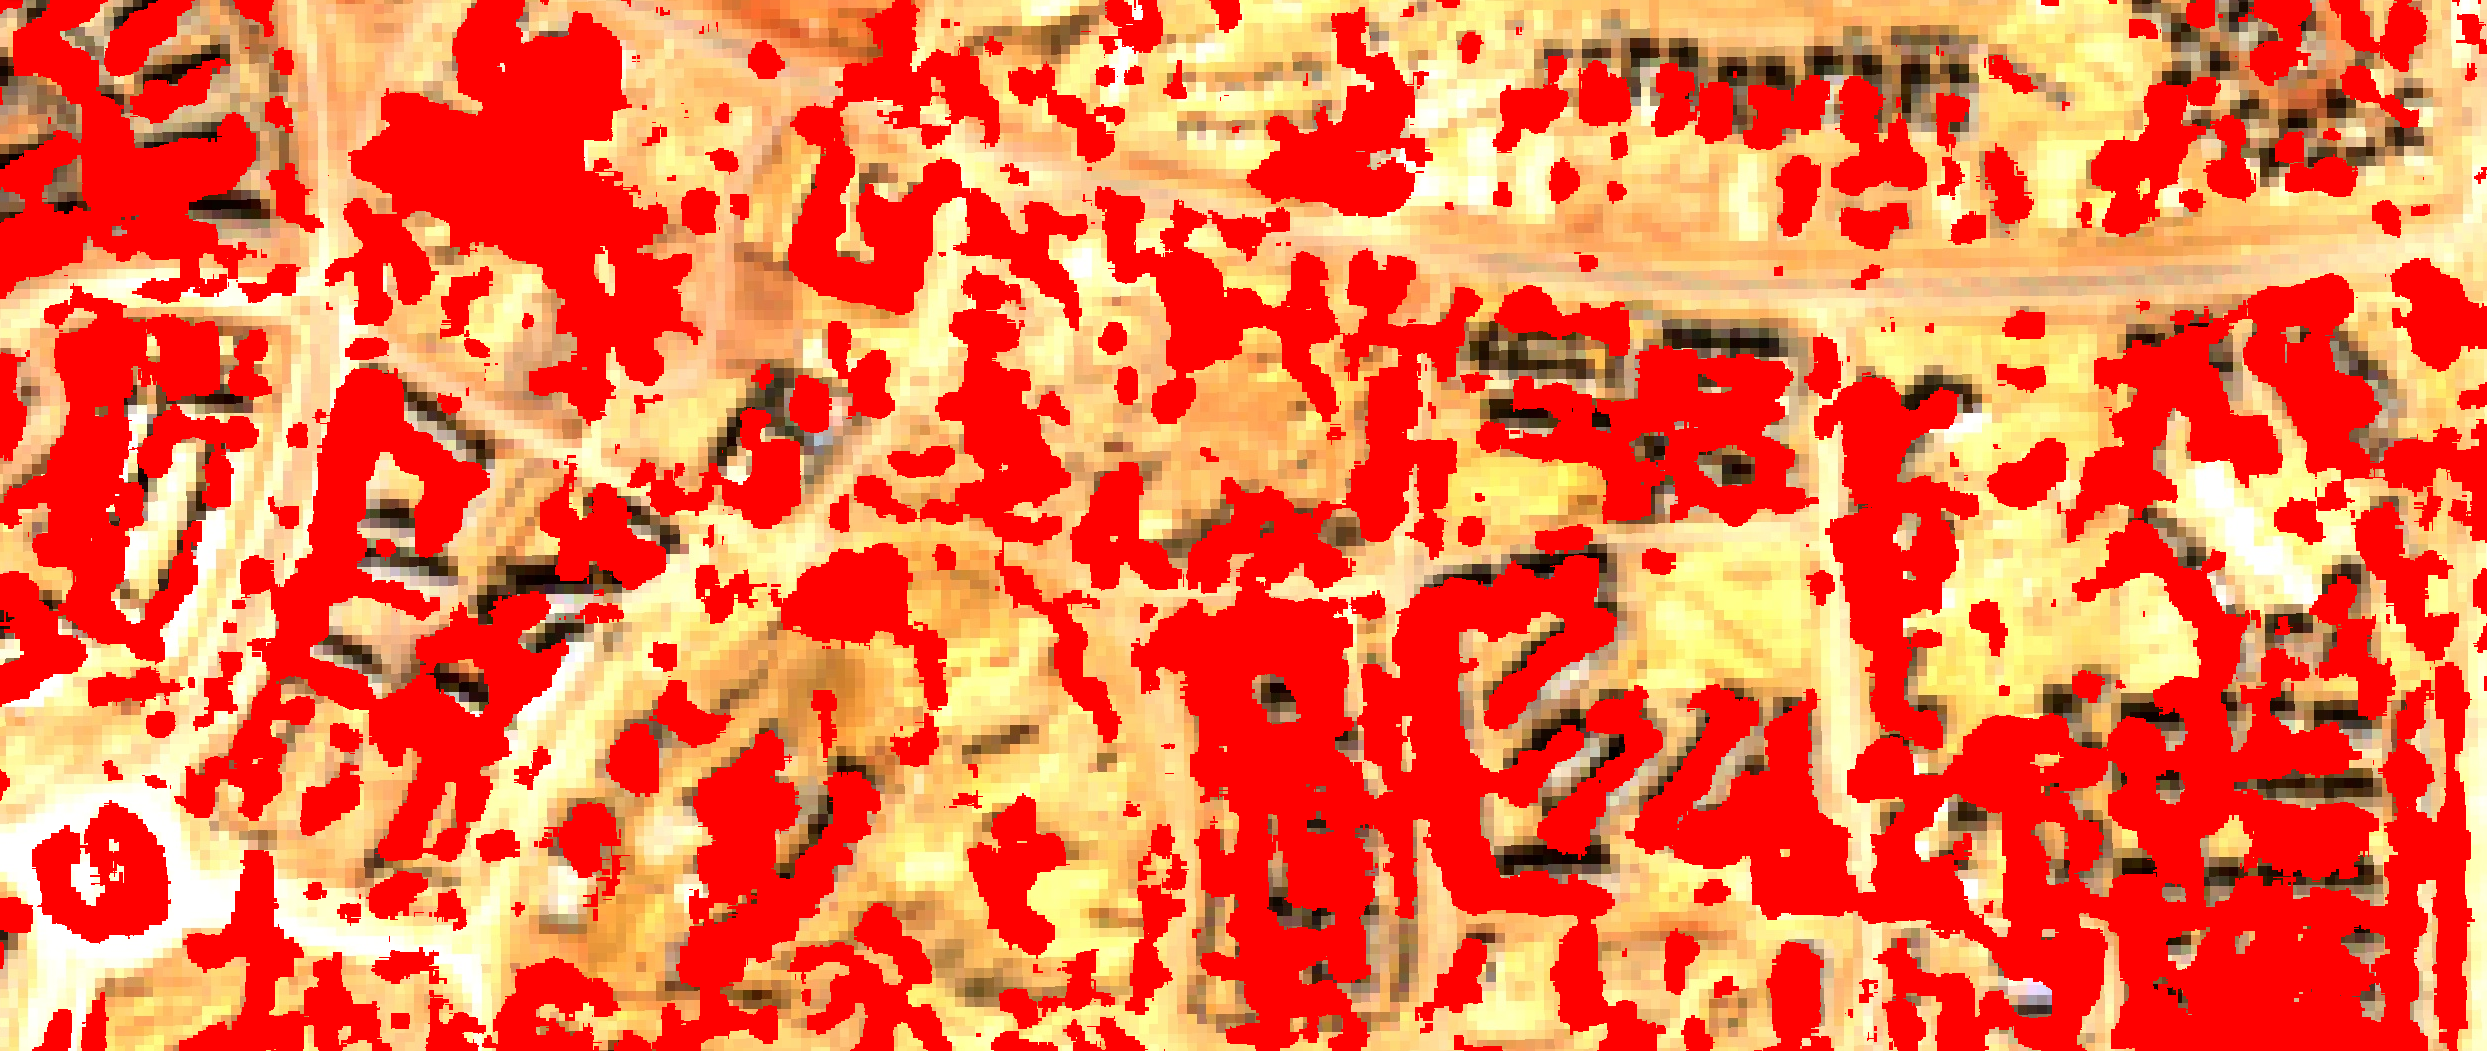
Figure 2: Real-time physical detection. Top: Raw Sentinel-1 SAR imagery capturing structural backscatter. Bottom: Simple thresholding (> -12 dB) isolated in red, instantly capturing human-made structures regardless of cloud cover or daylight but with many false positives.
Is this raw radar extraction a perfect, ready-to-use map? No. As seen in the red overlay, simple thresholding can pick up false positives like construction cranes, temporary scaffolding, or rocky terrain.
One might ask: why not just train a classic Machine Learning model to clean this up by fusing well-mapped cities and applying it here? While transfer learning is possible, classical models typically suffer from severe domain shift. A model trained on the consolidated urban fabric of existing cities will struggle to generalize to the unique spectral and radar signatures of a half-built megacity in the desert. Correcting this shift classically would require an exponential, manual effort to create new labeled data (polygons) for every new environment—reinventing the very human bottleneck we are trying to avoid. Achieving true global generalization requires self-supervised learning on petabytes of raw, unlabeled data.
This is exactly why the industry has shifted toward massive Foundation Models. So, why not simply hand the task over to advanced GeoAI like Google DeepMind’s AlphaEarth?
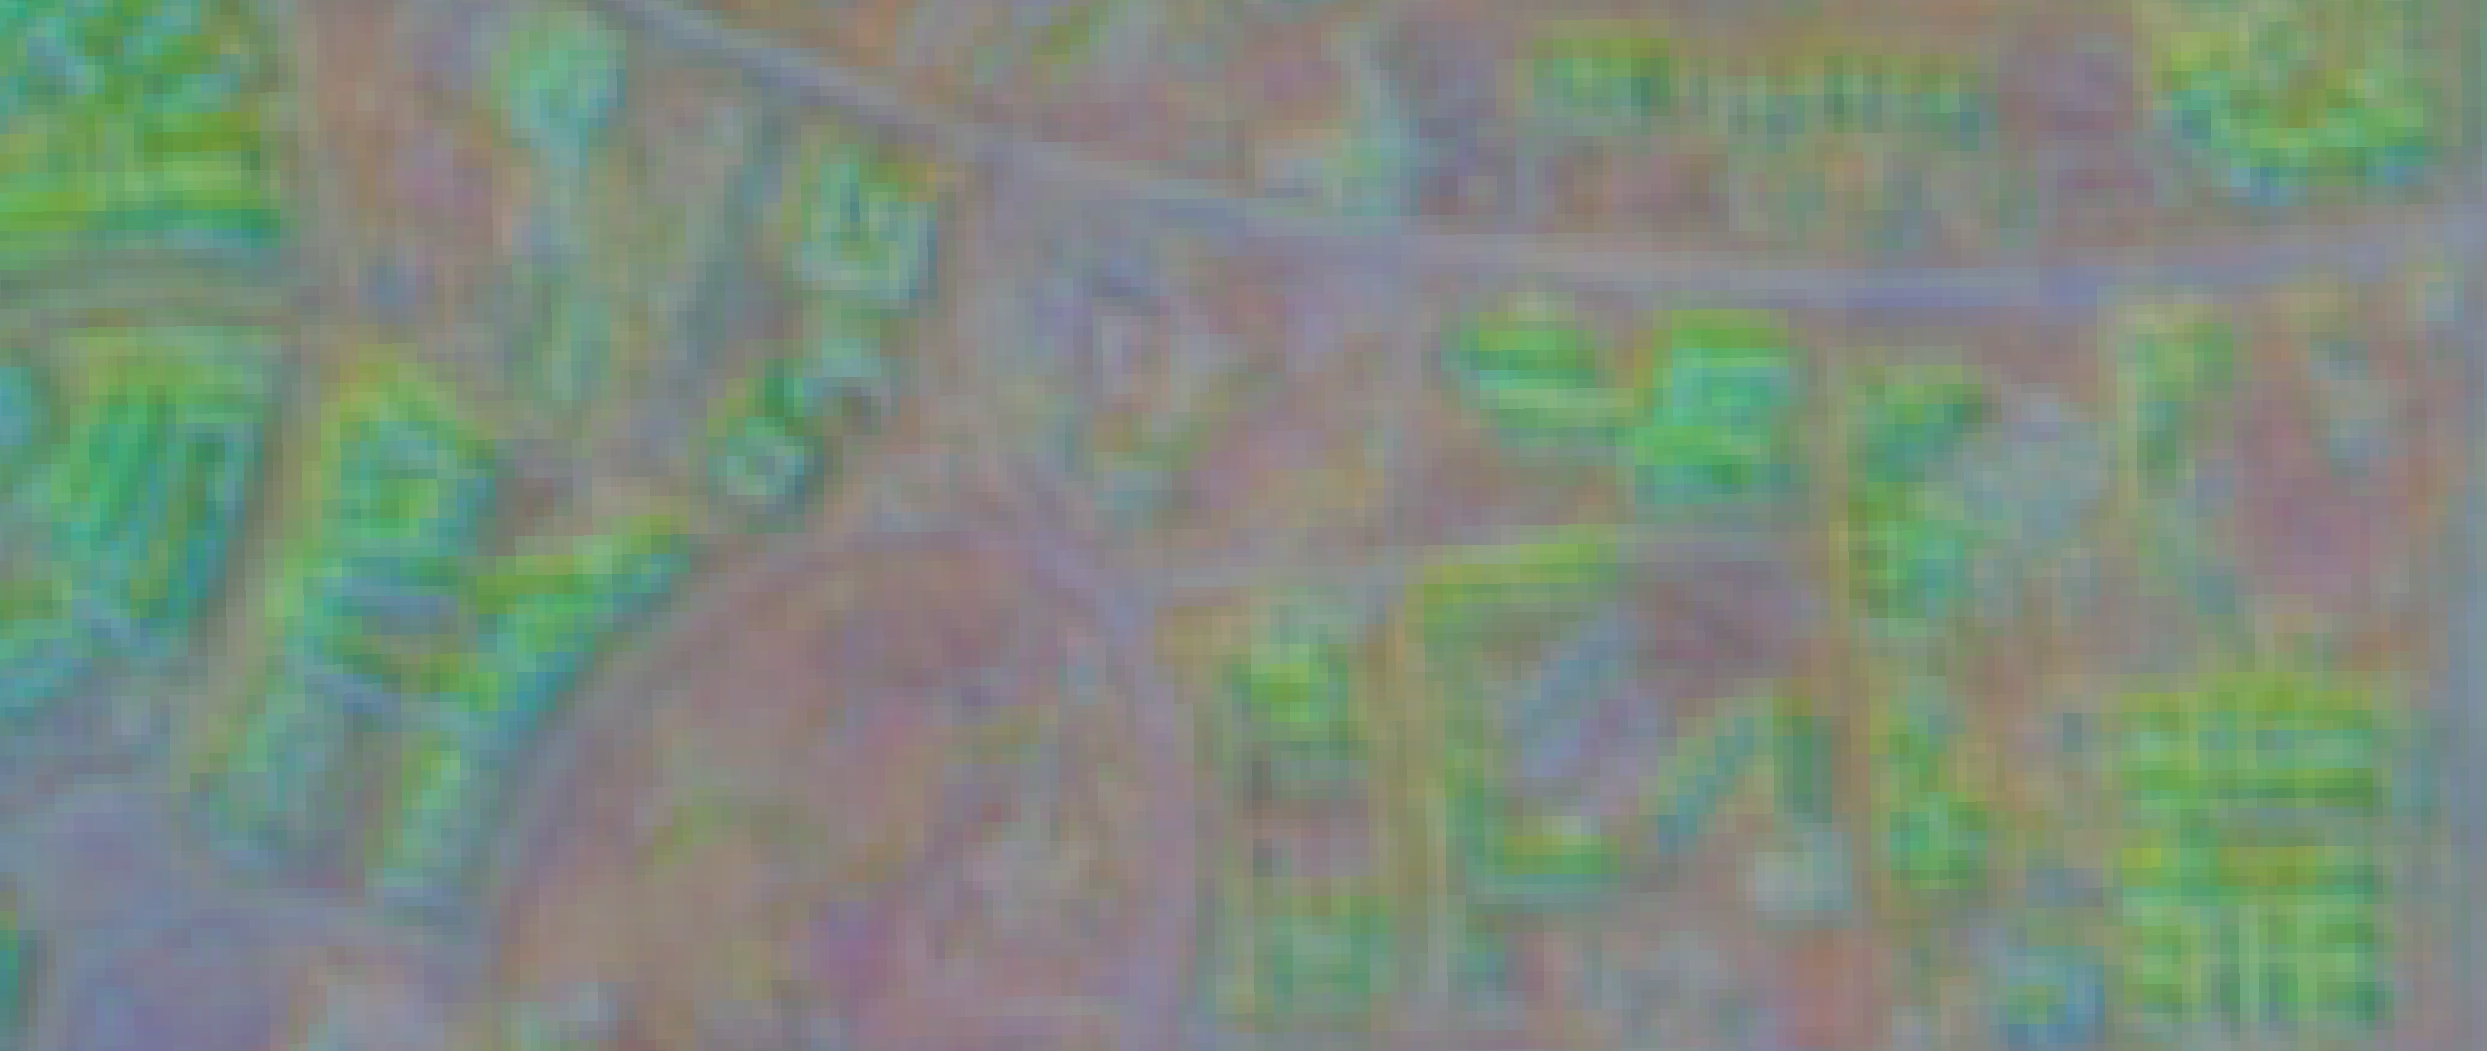
Figure 3: AlphaEarth 2025 multi-dimensional embedding (Bands A01, A16, A09). The GeoAI perfectly captures the consolidated urban context but misses the newest residential blocks visible in 2026, highlighting the temporal lag of annual foundation models.
If you look closely at the AlphaEarth visualization, you will notice a fascinating limitation. While the AI brilliantly captures the consolidated urban footprint in its multidimensional embedding, it completely misses the newly built grey residential blocks visible in the 2026 optical image. Why? Because computing 64-dimensional embeddings for the entire planet requires ingesting petabytes of multi-modal data, forcing these massive models to be published as annual composites. AlphaEarth is currently showing us its “memory” of 2025. It possesses deep contextual intelligence, but it operates with its own temporal lag.
The solution to the Cartographic Lag is not to choose between fast radar or smart AI, but to build a continuous, hybrid monitoring pipeline. We must use the high-frequency, cloud-penetrating SAR data as a real-time ‘tripwire’. When the radar detects fresh concrete today (2026) in an area where the latest GeoAI baseline (2025) sees only desert, it flags an immediate discrepancy. The system can then clean the noise, cross-reference it with the AI’s contextual knowledge, and instantly output accurate urban vectors. To keep up with the megacities of tomorrow, we must transition from manually drawing static maps to continuously computing living infrastructure.
Try it yourself: Visualizing the Cartographic Lag
This article proposes a theoretical hybrid pipeline to solve the Cartographic Lag. To help you visualize the exact problem we are trying to solve, I have written a Google Earth Engine script that overlays the real-time physical backscatter of Sentinel-1 (2026) with DeepMind’s AlphaEarth embeddings (2025).
Read the code: You can review the exact data extraction logic in this GitHub Gist: https://gist.github.com/rinvictor/93806c694118daf348556c4ee134e75a
Run the interactive map: You don’t need to set up a local environment or write any code to see this in action. Click the link below to open my public GEE workspace and explore the Cartographic Lag in real-time in our sample zone: https://code.earthengine.google.com/06b7710445999e0dbf6a3f961a215aef
Did you like this post? Read more and subscribe to our monthly newsletter!

