Tech for Earth: Key Developments and Breakthroughs from the Past Month

The past month delivered a remarkable concentration of updates across the geospatial sector and the tech for Earth. Technologies that once evolved separately – remote sensing, GIS, navigation systems, Earth observation satellites, and GeoAI – are now intersecting in ways that reshape how organizations work with spatial information. The pace of integration is accelerating, and the field is shifting from collecting data to producing real-time, decision-ready intelligence. What follows is a selection of the most significant stories, showing how platforms, datasets, satellites, and analytical tools are converging into more connected and operational ecosystems.
AI Is Becoming Embedded in Geospatial Workflows
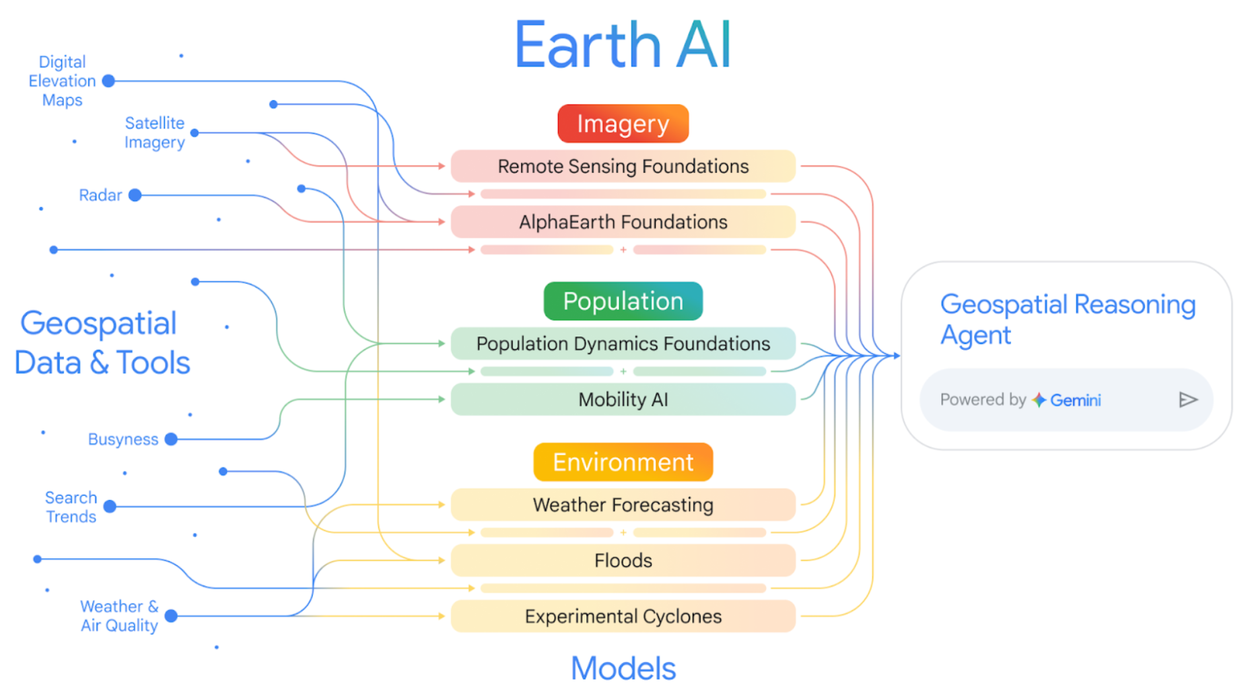
Major platforms are reshaping how practitioners interact with spatial data. Google’s announcement that developers can now integrate live Maps data directly into Gemini-powered applications signals a future where AI models “see” and reason about the physical world with context that traditionally required domain expertise. This effort aligns with broader work on geospatial foundation models, including Google Earth’s research into cross-modal reasoning for environmental questions. These developments suggest that spatial grounding will become a default capability in AI systems, not an add-on.
IBM is taking a different approach by releasing compact geospatial models designed for resource-constrained environments. They aim to democratize AI for field operations, edge devices, and low-bandwidth regions; critical for agriculture, conservation, and disaster response.
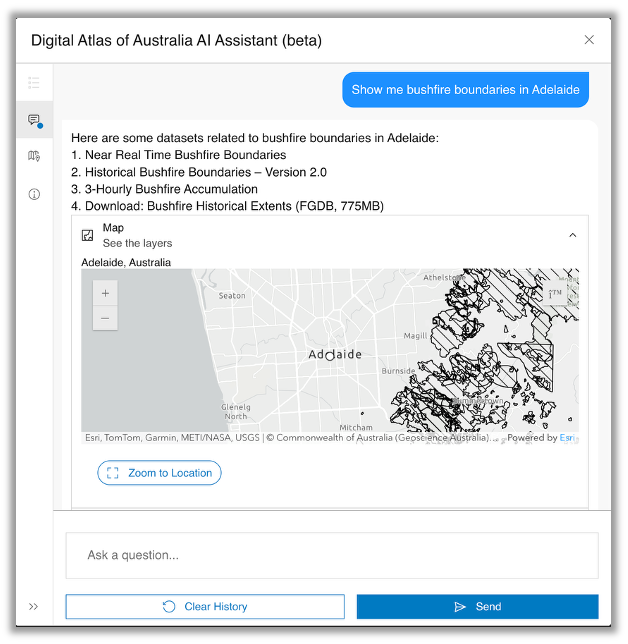
Esri, meanwhile, continues to fold AI deeper into its ecosystem. The latest ArcGIS Online updates include improved imagery tools and AI assistants, while ArcGIS Pro now supports direct access to Google Earth Engine data. These integrations point to a future where cloud and desktop workflows blend seamlessly.
Beyond large companies, smaller initiatives are also gaining traction. AlphaEarth’s take on GeoAI reflects a broader movement toward automated feature extraction and change detection at scale. The trend is clear: AI is no longer simply a tool to speed up analysis; it is beginning to shape how analysts conceptualize spatial problems.
Open Datasets Are Fueling Community Innovation
Open data remains a foundational driver of progress. AWS recently announced 82 new or updated datasets on its Registry of Open Data, expanding access to climate, land, and ocean datasets for research and commercial use. NASA’s Harmonized Landsat–Sentinel-2 collection is now accessible through Microsoft’s Planetary Computer, making higher-frequency optical imagery easier to integrate into machine learning pipelines.
Community-driven knowledge is another key part of this ecosystem. New geological resources, such as the USGS interactive subsurface map, show how open tools can make complex scientific data more accessible. Competitions and global opportunities, like the CaGIS map design contest and CartoGIS 2026, continue to encourage emerging talent to contribute.
The rise of decentralized mapping platforms also deserves attention. BeeMaps’ latest funding round reflects a growing interest in community-driven spatial data models, although questions about quality and governance remain open.
Earth Observation Enters a New Orbital Phase
The landscape of EO missions is changing quickly. Europe is preparing for the launch of the Copernicus Sentinel-1D satellite in November 2025, strengthening global SAR coverage at a moment when reliable radar data is critically needed. Copernicus also marked 10 years of collaboration with Frontex on border security, demonstrating how EO has become an operational pillar for public agencies far beyond environmental monitoring.
A growing number of countries are accelerating their own capacities. Pakistan launched its first hyperspectral satellite, China continues to test new EO platforms, and Africa is taking steps to strengthen regional EO strategies ahead of the AfriGEO Symposium.
Commercial players are pushing technology even further. ICEYE’s new Gen4 SAR satellite promises wider coverage and sharper imaging. Planet introduced OWL, its most advanced high-resolution imaging mission, while Space42 and partners plan new integrated SAR constellations for the UAE.
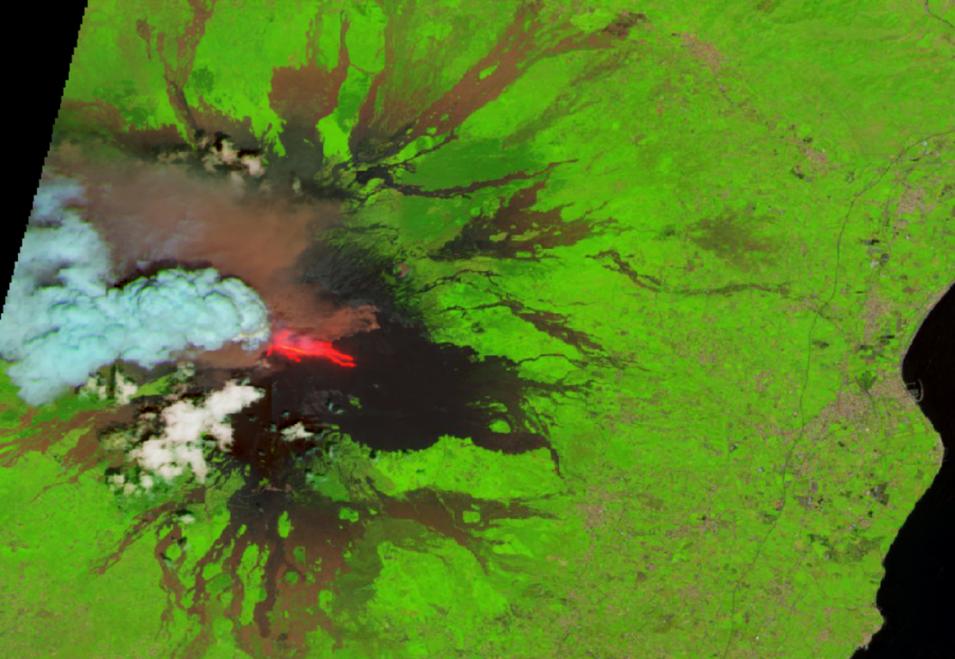
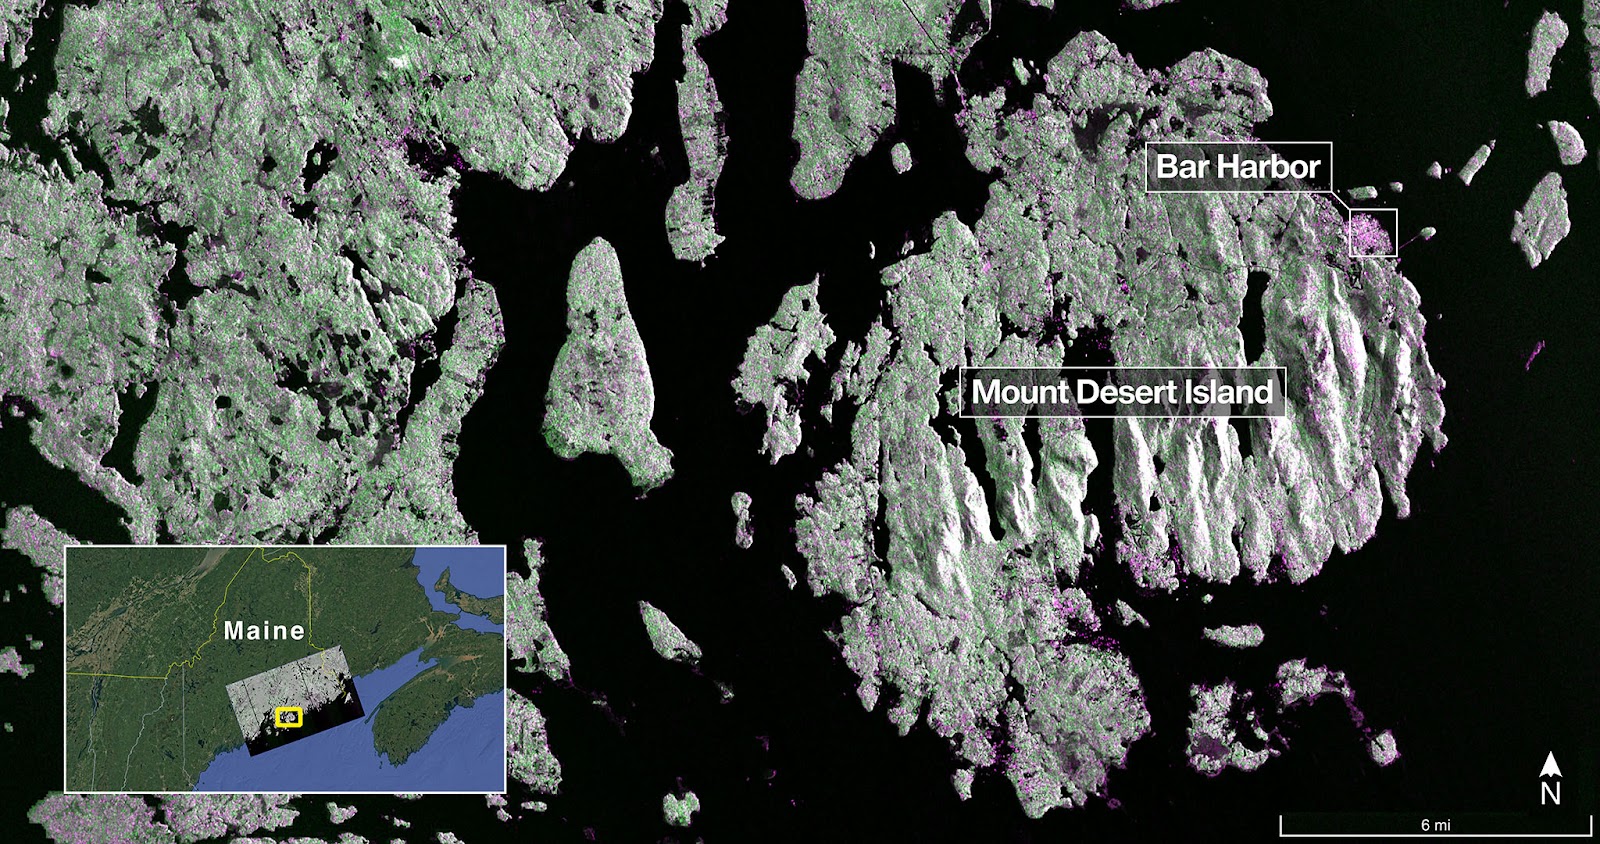
NISAR, the joint NASA–ISRO mission, released its first operational radar images, offering unprecedented dual-band SAR data that will likely transform land deformation, forestry, and hydrology research.
At the same time, geopolitical tensions are accelerating demand for EO capabilities. New reports highlight how companies are sharpening their focus on defense markets. The satellite industry itself continues to consolidate, as seen in Europe’s evolving merger landscape.
The result is a more multipolar EO sector with more actors, more sensors, and more competition – ultimately expanding global access to high-quality data.
Environmental Observations Are Becoming More Urgent and More Actionable
Climate-driven applications dominated many updates. NASA’s latest analysis of ocean warming and Copernicus’ Ocean State Report underscore how satellite observations remain essential for tracking long-term environmental change.
The weakening of the South Atlantic Anomaly continues to draw attention, with ESA’s Swarm mission documenting how this anomaly may affect satellites and navigation.
Hydrometeorological agencies are preparing for a more connected future, with the World Meteorological Organization outlining upcoming trends in observing systems. The integration of digital twins, highlighted in NOAA’s study on AI-driven environmental modeling, points toward a world where agencies can stitch together satellite, in-situ, and socio-economic data into unified decision frameworks.
These advances resonate with broader discussions on Earth observation as a tool for climate intelligence. The World Economic Forum and MIT recently emphasized EO’s role in global resilience strategies. In agriculture, organizations like CGIAR are deploying AI-enhanced EO to tackle food security risks such as aflatoxin contamination.
The message is consistent: geospatial data is no longer passive. It is becoming a strategic resource for environmental governance.
Navigation and Positioning Are Entering a New Competitive Era
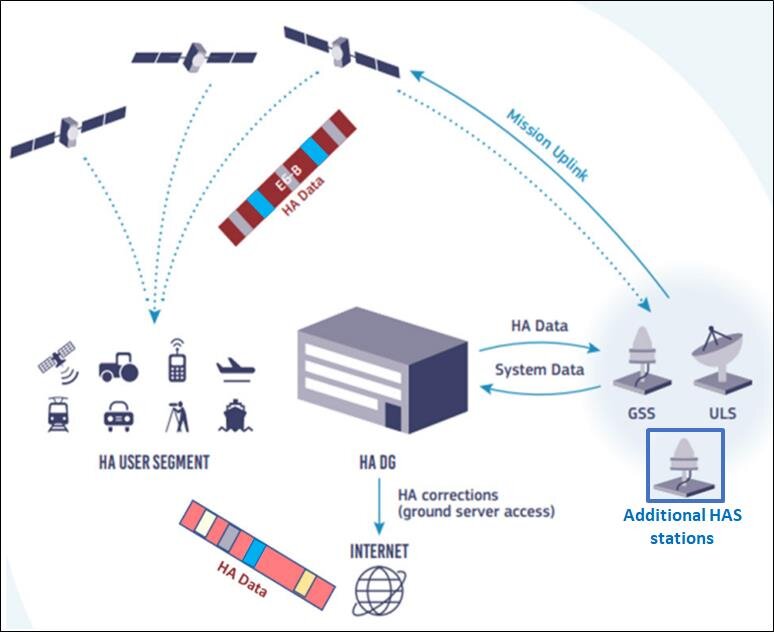
GNSS systems are undergoing a significant transformation. Galileo is preparing to offer free high-precision services for mass-market applications, while new research showcases how GNSS can be combined with inertial sensors for centimeter accuracy.
At the same time, interference and spoofing remain pressing concerns. Analysts continue to warn about electronic warfare implications for commercial GNSS users and the growing scale of GPS jamming.
Alternative systems are emerging in response. NextNav and others are developing 5G-based PNT capabilities, illustrating how the navigation landscape may diversify in the coming decade.
Training, Capacity Building, and Community Growth
Amid rapid technological change, the demand for skills continues to rise. Initiatives range from community-focused disaster response training to international programmes on space applications and GIS for conservation and agriculture.
The Asia-Pacific region remains especially active, with high-profile conferences and smart city programmes incorporating digital twins and urban sensing (for example, Malaysia’s digital twin initiatives).

Smart Cities Expo KL. —Low Lay Phon/The Star
This wave of capacity development is essential for ensuring that new tools benefit not only well-resourced institutions but also communities dealing directly with climate, agricultural, or development challenges.
A Turning Point for the Tech for Earth
Taken together, these developments paint a picture of a geospatial sector that is maturing rapidly. The coming year will likely be defined by:
- greater fusion of AI with EO and GIS platforms
- faster transition from raw data to decision-ready intelligence
- new competition in satellite and GNSS markets
- broader participation from emerging economies
- rising expectations around transparency, accessibility, and resilience
As the community navigates this shift, the central challenge will be ensuring that innovation translates into real public value. The tools emerging today – AI-driven EO, accessible cloud datasets, precision navigation, and integrated satellites – have the potential to transform environmental governance and economic opportunity. But their impact will depend on responsible deployment, open collaboration, and continued investment in skills.
The pace of change is accelerating. 2025 shows that the geospatial field is no longer simply documenting the world; it is actively shaping how societies understand and respond to global challenges.
Did you like this post on Tech for Earth? Read more and subscribe to our monthly newsletter!


#Fun
Next article


For most of our history, maps have been flat. They worked well enough when all we needed was a top-down view of roads, rivers, and land cover. But the world we measure today is not flat at all. Drones, satellites, and ground sensors now capture the shapes of buildings, the layers of soil, and even the movement of air around our cities. These things do not exist in two dimensions, so a 2D map cannot accurately represent them.
Imagine trying to squeeze an entire building into a single floor plan, or trying to show the layers of the ground on a single flat sheet, or trying to map smoke moving through the air using only a top view. It feels wrong because it is wrong.
As a result, we are hitting a wall. Our tools still think in flat surfaces, while our data now describes a full 3D space. The gap keeps growing. Anyone working with modern sensors can feel it. The world we measure has depth, layers, and hidden structures. A traditional map simply cannot show all of that, no matter how hard we try.
This article is here to help you make sense of that shift. By the end, you will understand what a voxel is, why everyone in geospatial talks about it, where it is already changing real projects, and how you can explore voxel tools yourself.
This is the moment where mapping starts to move from surfaces to space. And it begins with one simple idea: the voxel.
What Exactly Is a Voxel?
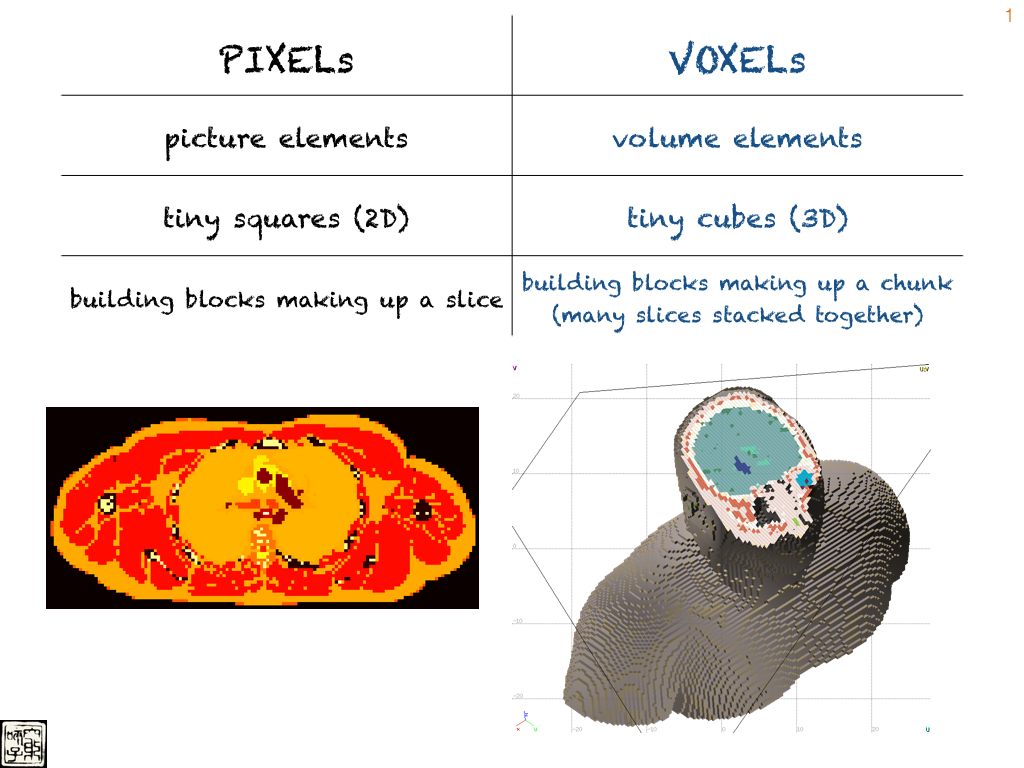
Before we go deeper, we need to meet the small cube that makes 3D mapping possible. This cube is called a voxel. It is a discrete, cube-shaped unit in a three-dimensional grid that represents a specific, bounded volume of space and stores physical or semantic attributes associated with that volume. It is the volumetric counterpart of a pixel, extending spatial information from a flat area into real 3D space
You can think of it as a pixel with depth. A pixel shows what happens on a surface. A voxel shows what happens inside space.
Source: Marychin
Once you imagine the environment as a big stack of tiny cubes, it becomes clear why voxels matter. They give our digital maps a way to store information above the ground, below the ground, and all the way in between.
Next, let’s look at why our current 3D data is so messy and why these cubes help clean things up.
The Problem with Raw Data: Why LiDAR Is Chaotic
Now that we know what a voxel is, it is easy to see why our current 3D data feels messy. Most of the data we collect today comes from LiDAR scanners, drones, and photogrammetry. These tools capture millions of tiny points floating in space. This huge collection of points is called a point cloud, and while it looks impressive, it is also very chaotic.
Each point stands on its own. It has a location and maybe a color, but no structure. Nothing tells the computer which points belong together. There is no grid. There is no order. A study that looks at point cloud structure explains that this lack of organization makes it hard to run analysis or spot patterns.
This becomes a real problem when we want to use AI. Many AI models need data to be arranged in a regular structure, not scattered like confetti. Another analysis shows how raw point clouds slow down learning because the system must constantly guess where things belong. A deeper look at 3D learning points out that AI performs much better when the data is grouped into small cubes first.
This is why many researchers now say that voxels are not just a data format but the foundation of smart 3D analysis. They turn scattered points into something a computer can read. They give the data a shape. They bring order to the chaos.
Next, we will look at how voxelization actually does this and how we manage the huge amount of data that comes with it.
How Voxels Bring Order to Messy 3D Data
Once we have a messy point cloud, the first thing we want is some order. That is where voxelization comes in. Voxelization is simply the step where we take all those floating points and sort them into tiny cubes. Each cube now has a place in a 3D grid, which makes the data much easier to work with.
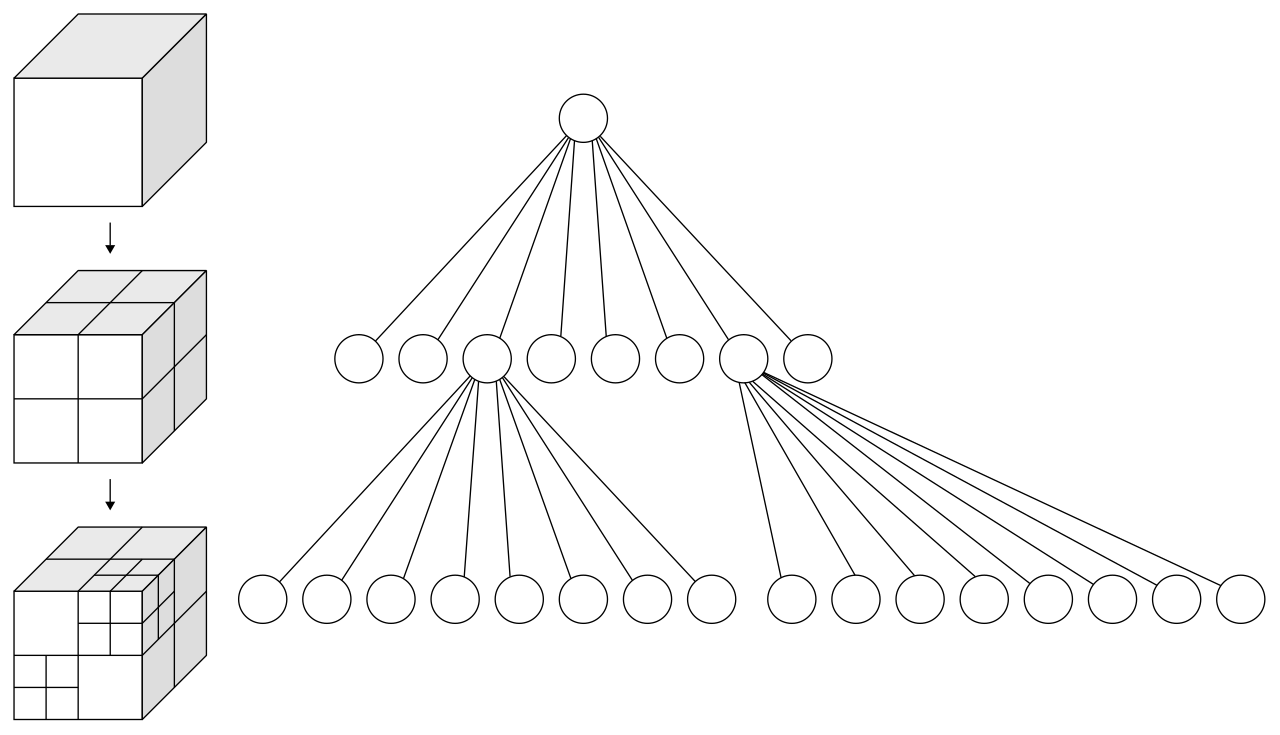
But there is a catch. When we turn 3D space into cubes, the amount of data grows very fast. If you double the resolution of a 2D map, the size grows by the square. If you double the resolution of a 3D model, it grows by the cube. A high-resolution voxel grid can become enormous. An analysis of voxel data structures points out that even a small increase in detail can explode the memory needed. Without any tricks, the grid becomes too big to store or process.
The good news is that most of the world is empty. The air above a city. The space between trees. The gaps inside a building. We do not need to store every possible cube. We only need the ones that contain something. This idea is called sparsity.
To make this work, many systems use a smart structure known as a Sparse Voxel Octree. It breaks space into cubes, but only where there is data. A detailed study of octrees shows how they divide space into smaller and smaller blocks only when needed. This saves a huge amount of memory and still keeps all the important details. Dense areas like building walls or underground layers can stay sharp, while empty regions take almost no storage.
Source: Voxel Compression
This simple idea makes voxel models practical. It gives us the structure we need without drowning us in data. With this in place, we can finally start using 3D information the way it was meant to be used.
Real-World Impact: Where Voxels Change Everything
This is the part where voxels stop being an abstract idea and start becoming something you can see and feel. Once you move from flat maps to tiny cubes of space, a lot of things suddenly become possible.
The Living City
One of the most impressive examples comes from Stuttgart. In this study, researchers combined everything above the ground and everything below it into one voxel model. That meant the soil layers, the underground tunnels, the buildings, the heat flow, and even the geological structure were all stored in the same cube-based world. When you view a city like this, you see relationships that never show up on a flat map. You see how heat moves from underground into buildings. You see how foundations interact with soil. It feels less like a map and more like a living system.
The 4D Map
Voxels become even more powerful when you add time. Because each cube sits in a fixed position, you can track what happens inside it as days, seasons, or years pass. ESRI’s explanation of voxel layers shows how this works. It allows you to watch groundwater levels change, pollution spread through the air or temperature shift over time. This turns a static map into something you can actually observe and understand as it evolves.
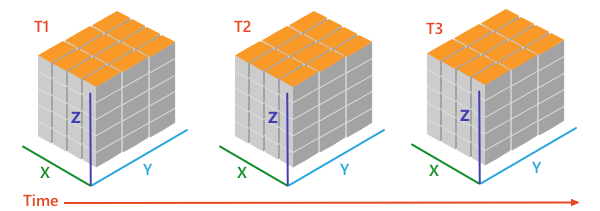
Source: ESRI
Helping Autonomous Vehicles Understand the World
Self-driving cars and robots make constant decisions about where to go and how to avoid obstacles. A voxel map gives them a clean and structured view of the 3D world. Research on 3D occupancy prediction for autonomous driving shows how vehicles use voxels to detect road edges, buildings and moving objects. With cubes, the car sees space in a way that is simple and reliable.
Environmental and Disaster Simulation
Voxels also help model how natural processes move. For example, a study on environmental simulation uses voxels to examine how wind carries noise and pollution through urban spaces. When the world is divided into cubes, you can see how smoke or gas spreads between buildings or how water flows during floods. It makes complex processes feel easy to follow.
Designing Better Cities
Urban designers use voxel models to study how comfortable a neighborhood feels. With cubes, you can see where sunlight reaches, how wind moves through streets or where heat gets trapped between buildings. These details help shape cities that are not just beautiful but pleasant to live in.
Across these examples, the idea is always the same. Once you stop flattening the world and start modeling it as space, you discover patterns that were hidden before. Voxels make the invisible visible.
See It In Action: Tools and Visuals You Can Explore
This is the part where you can actually try voxels yourself. You do not need special software or technical skills. Just open a link, upload something, or click around. These small experiments make the idea of “tiny cubes in space” feel real.
1. Turn Any 3D Model Into Voxels
There is a simple online voxelizer that lets you upload a 3D model or even an image and turn it into cubes in seconds. You can then rotate it, zoom in, and see how your object becomes a blocky 3D version of itself. It is surprisingly fun to play with, and it teaches you more about voxels than a whole page of text.
Online voxelizer: https://drububu.com/miscellaneous/voxelizer/?out=obj
If you upload a small object like a chair, a toy, or even your own drawing, you will immediately see how voxels build up volume.
2. Explore ESRI’s Voxel Layers
If you want to see how voxels look in real GIS software, ESRI has a clear example page that shows voxel layers for geology, temperature, and underground volumes. The visuals are simple to understand and make it clear how voxel grids store information above and below the surface.
ESRI’s voxel example:
https://pro.arcgis.com/en/pro-app/3.4/help/mapping/layer-properties/what-is-a-voxel-layer-.htm
You can scroll through the page and look at how each cube holds a slice of the environment.
3. Look at Some Voxel Illustrations
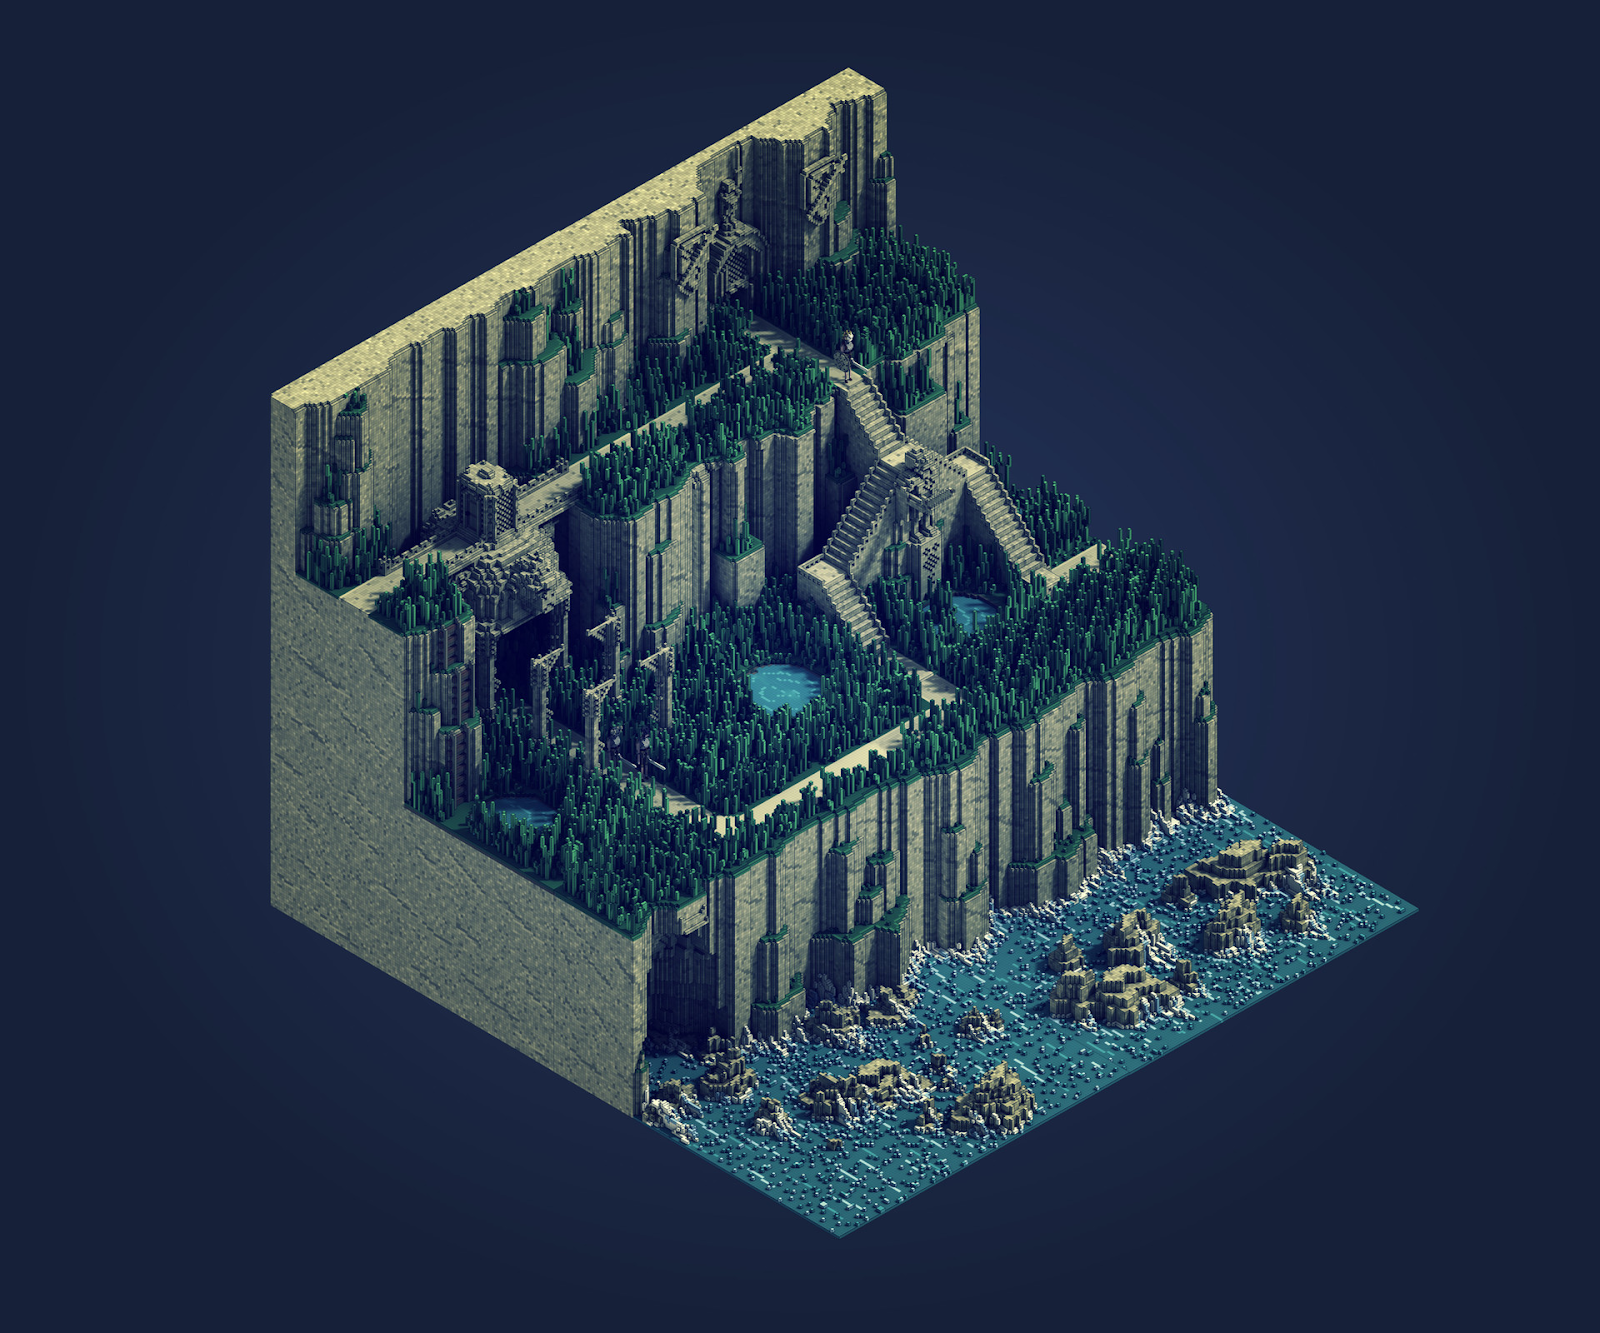
Source: Sir Carma
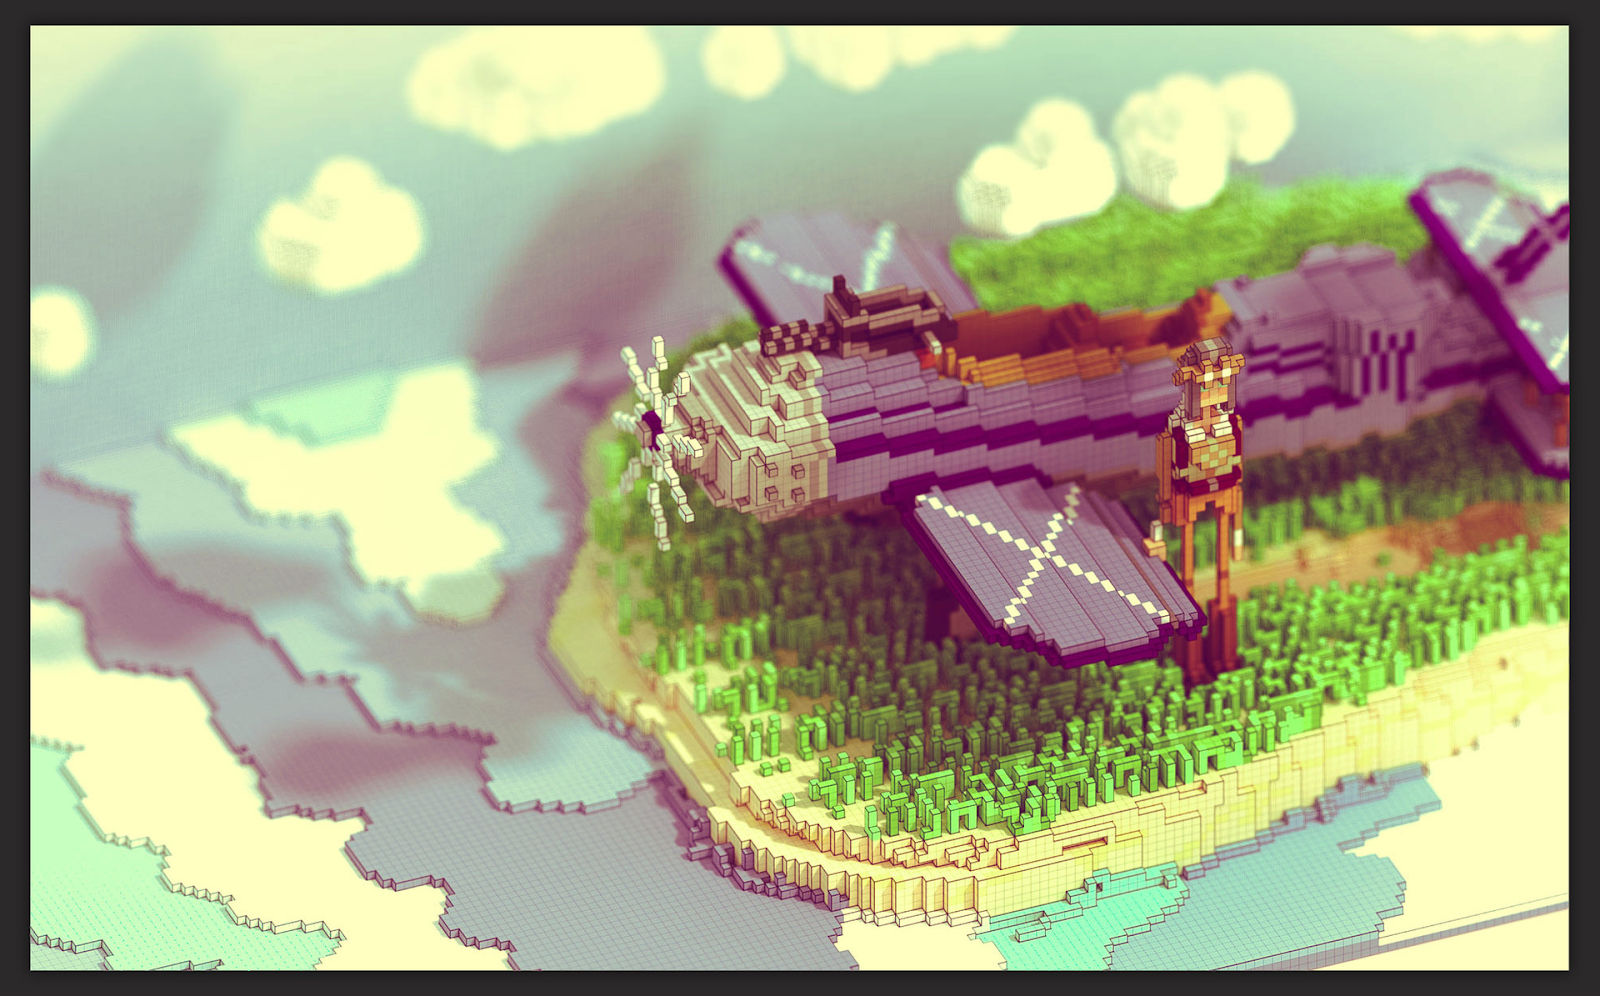
Source: Sir Carma
The Road Ahead: Challenges and the Cloud Fix
Even though voxels open up a whole new way of seeing the world, they still come with challenges. The biggest one is choosing the right size for each cube. If the cubes are too big, you lose detail. If they are too small, the data becomes huge and slow to work with. It is a balancing act that every project has to think about.
Another challenge is that there is still no universal format for sharing voxel data. Different tools use different ways of storing cubes, which can make it hard to move data from one system to another. This slows down collaboration and makes projects more complicated than they need to be.
But there is also good news. More and more of the heavy lifting is moving to the cloud. Instead of trying to store and process giant voxel models on your own computer, many platforms now let you upload your data and let the cloud handle the rest. This makes even very large 3D and 4D voxel models easier to use.
A clear example of this shift appears in the way companies use platforms like Cesium. Their cloud engine is able to stream large datasets, work with 3D Tiles and support new forms of voxel content, making it easier to build big models without worrying about hardware. You can read about the movement toward cloud-based voxel workflows in this overview.
This “voxel and cloud” partnership is becoming the default approach for many teams. The cloud handles the scale. The voxels handle the space. Together, they make it possible to work with complex 3D environments in a way that feels simple from the outside.
As voxel tools grow and the cloud catches up, it becomes clear where things are heading. For a long time, we described the world as a flat surface because that was all our tools could handle. Now we are finally able to describe the world as a space. Not just where things are, but what fills them, how they change, and how they connect. Voxels make this possible simply and intuitively. The question is not whether they will become part of everyday mapping, but when. With better tools, clearer standards, and the support of the cloud, that moment is much closer than most people think.
See more:
https://learn.arcgis.com/en/projects/visualize-social-distancing-across-california/
https://mhinfographics.com/2024/12/19/tutorial-how-to-create-this-voxel-styled-map/
https://www.voxelmaps.com/100-cities
Did you like this post? Read more and subscribe to our monthly newsletter!

