

The first COVID-19 case in Liberia was confirmed in early March 2020, but like most countries in the region, there was no system nor infrastructure in place to curtail the spread of the virus. By July, the country had 1,180 cases (including 623 recovered cases and 75 deaths). Despite efforts from the national government, development actors, and the private sector, new cases have continued to increase across Liberia’s 15 counties. The information available to citizens was limited, with gaps around coronavirus awareness, prevalence of cases, testing availability, and information on where to get tested, quarantined, or treated.
iLab Liberia saw this need for knowledge around healthcare access, open data policies, and infrastructure on the part of citizens, researchers, and responders in contributing to the eradication of coronavirus in Liberia. iLab is a nonprofit tech organization that has supported the central government and the people of Liberia in open data, access to information, peacebuilding, elections, data management, and visualization since 2011.
With funding from HOT’s Rapid Response Microgrant: COVID-19 Program, iLab was able to map all functional healthcare and COVID-19 facilities across Liberia to OpenStreetMap (OSM), and visualized the confirmed COVID-19 cases by creating web maps, infographics, and datasets for public use.
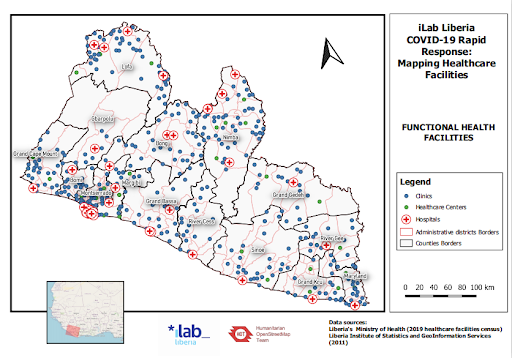
Image of a printable map for county health teams
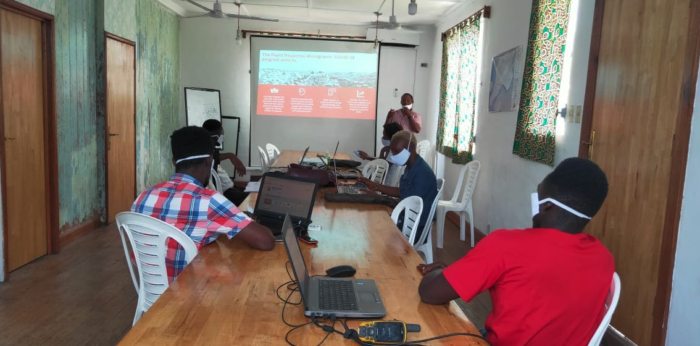
The three-month project was done exclusively through remote mapping activities, which allowed our community of mappers to work from home in the midst of a national lockdown. Working from home was a huge challenge to mappers in an environment where access to electricity and the internet is limited.
Despite the bureaucracy in data acquisition from line government agencies, the Ministry of Health, National Public Health Institute, and Liberia Institute of Statistics and Geo-Information Services recognized that our Rapid Response mapping initiative could enhance their efforts in the national response to COVID-19. The data we needed from those organizations was released to us and we were able to effectively use it in our project.
During the project, we mapped 24 hospitals, 750 clinics, and 20 healthcare centers. We also mapped other forms of infrastructure, including 10 Schools, 9 Hotels, 1 Sports Stadium, and 1 Research facility that were being used as COVID-19 facilities. COVID-19 facilities were classified as either:
- a Precautionary Observation Centers – quarantine centers where suspected cases are monitored.
- a Testing Centers – facilities where COVID-19 testing is being conducted.
- a Treatment Unit – facilities where coronavirus patients are treated.
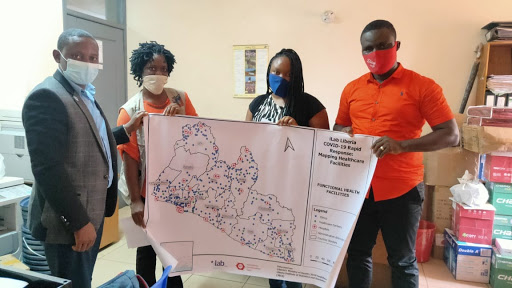
iLab Liberia Country Director presents printed maps to County Health teams officers
Beyond mapping the facilities on OpenStreetMap, we developed and distributed 20 printed maps to the County Health Teams and completed a 2-week social media campaign to ensure the data and products reached as many people and institutions as possible. Our data page consists of digital maps of healthcare and COVID-19 facilities, a wide range of interactive infographics on COVID-19 cases per county, and downloadable datasets available in different formats. We shared this work with our stakeholders and the general public via email exchanges and social media.
Mr. Tijli Tarty Tyee, Jr., the County Health Services Administrator and one of the county health officers who received the printed maps on behalf of the County Health teams, stated that:
“The Ministry including the entire health teams of the 15 counties of Liberia sees your initiative of mapping healthcare facilities across our country to be a vital component to our awareness and prevention campaigns. The government alone cannot do it all, as such institutions like yours will be needed to support our data collection and GIS departments to help build their capacity in order to better serve our people” – Mr. Tijli Tarty Tyee, Jr
Evidence of the demand for our project’s products can be found on our Facebook page. There have been 101 engagements, 16 shares, and 594 people reached excluding audiences on Twitter and Whatsapp. Our website traffic has also increased by 203 unique visitors.
The products that we produced during our project will be used to inform governments, local NGOs, and local communities on where to locate healthcare services and where to get tested, quarantined, or treated for coronavirus. We believe these products can go a long way to support decision-making across organizations and among individuals regarding healthcare and COVID-19 response efforts in Liberia.


#Insights

Next article

How We Responded to Covid-19 Pandemic by Mapping Ugandan Border Entry Towns (by MapUganda)
This post has been cross-posted from HOT News.
Timely provision of medical and non-medical supplies is critical for COVID-19 response, and the need to remember the undesirable demands to protect oneself from the disease has prompted the reinvention of risk communication with targeted messaging like the “Tonsemberera (Do not come close to me) campaign.” All over the world, the outbreak prompted the application of tools, such as digital and geospatial technology, for efficient responses, to enable the quick identification and isolation of infected individuals or families while also ensuring the efficient supply of daily needs such as food, especially among those that were gravely affected by the pandemic.
OpenStreetMap is one such platform that enables building tools and obtaining demographics without needing complex techniques. With the identification of buildings, access roads, and amenities, responders gain easy access to information, and so the planning and delivery of support services become more efficient. Unfortunately, the most affected areas in Uganda were the border districts that only existed as blank spots on OpenStreetMap. Map Uganda, together with Geo YouthMapppers, came forward through the HOT Microgrant program to support the availability of data for the planning and actions of government and field responders, such as the Ugandan Red Cross. The parties embarked on mapping buildings, roads, and identifiable amenities for porous border entry points to help create detailed maps to support and retool the Ugandan Red Cross Society and Ministry of Health surveillance efforts against the spread of the pandemic.
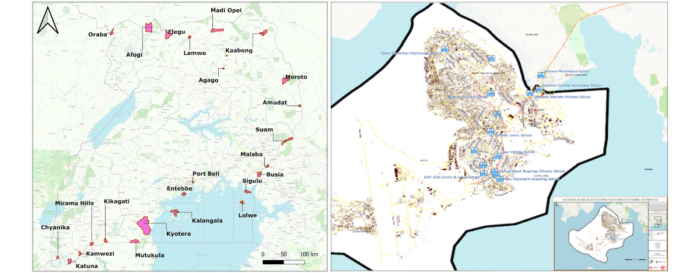
In spite of the lockdown of the airport in March and the strict monitoring and testing at official borders entry points, COVID-19 transmission still found its way into the country through the porous border points, carried by people entering from the neighboring countries of Kenya, Congo, and Tanzania. With support from a Rapid Response Microgrant, students and community members dedicated a piece of their time every day to contribute to the remote mapping of 27 border towns.
Data Collected
A series of trainings and work sessions using different tools, such as JOSM, ID Editor, Tasking Manager, Quantum GIS, Umap platform, were used to remotely prepare the data and information for the communities at the frontline of the awareness and risk communications against the pandemic.
- More than 250,000 buildings were added to the map
- Over 7000km of roads were collected
- More than 400km of waterways were also mapped in these all the border points.
- 27 Digital and paper maps were created.
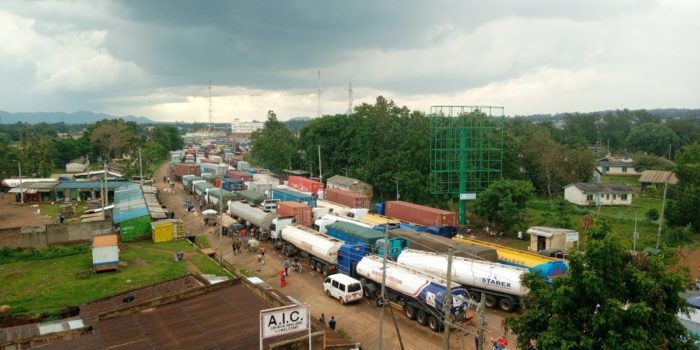
Cargo trucks lining up at the Malaba Border Point on the border of Uganda and Kenya as truck drivers wait to be tested for Covid-19 before they enter Uganda.
Insights from the mapped border towns
Among all the 27 border towns, Kyotera and Busia had the highest number of buildings. The access roads are primarily distributed across Kyotera, Elegu, Busia, Mutukula, and Moyo border towns, with Kyotera having the highest number of access roads. This attributes to the dense population of the town and puts its population at risk of an outbreak if there is a community infection within the area.
For further insights, please see these resources:

