When you want a database of POIs for your app, which service do you use? Facebook places? Foursquare’s API? Google Maps? Maybe another solution? Facebook’s database boasts over 140 million POIs and it is definitely one of the favourite solutions out there, as I learnt during the interview with Radar.io but 140 million POIs sounds awfully small. Think about how many restaurants and shops aren’t listed on Google maps just in your neighbourhood. How many of these shops have their schedules available online? Considering how accurate and up-to-date our maps are, why is POIs not that great? Is there a better solution out there? Diana and Randy certainly think so. Read on! Oh and did I mention blockchain? 😉
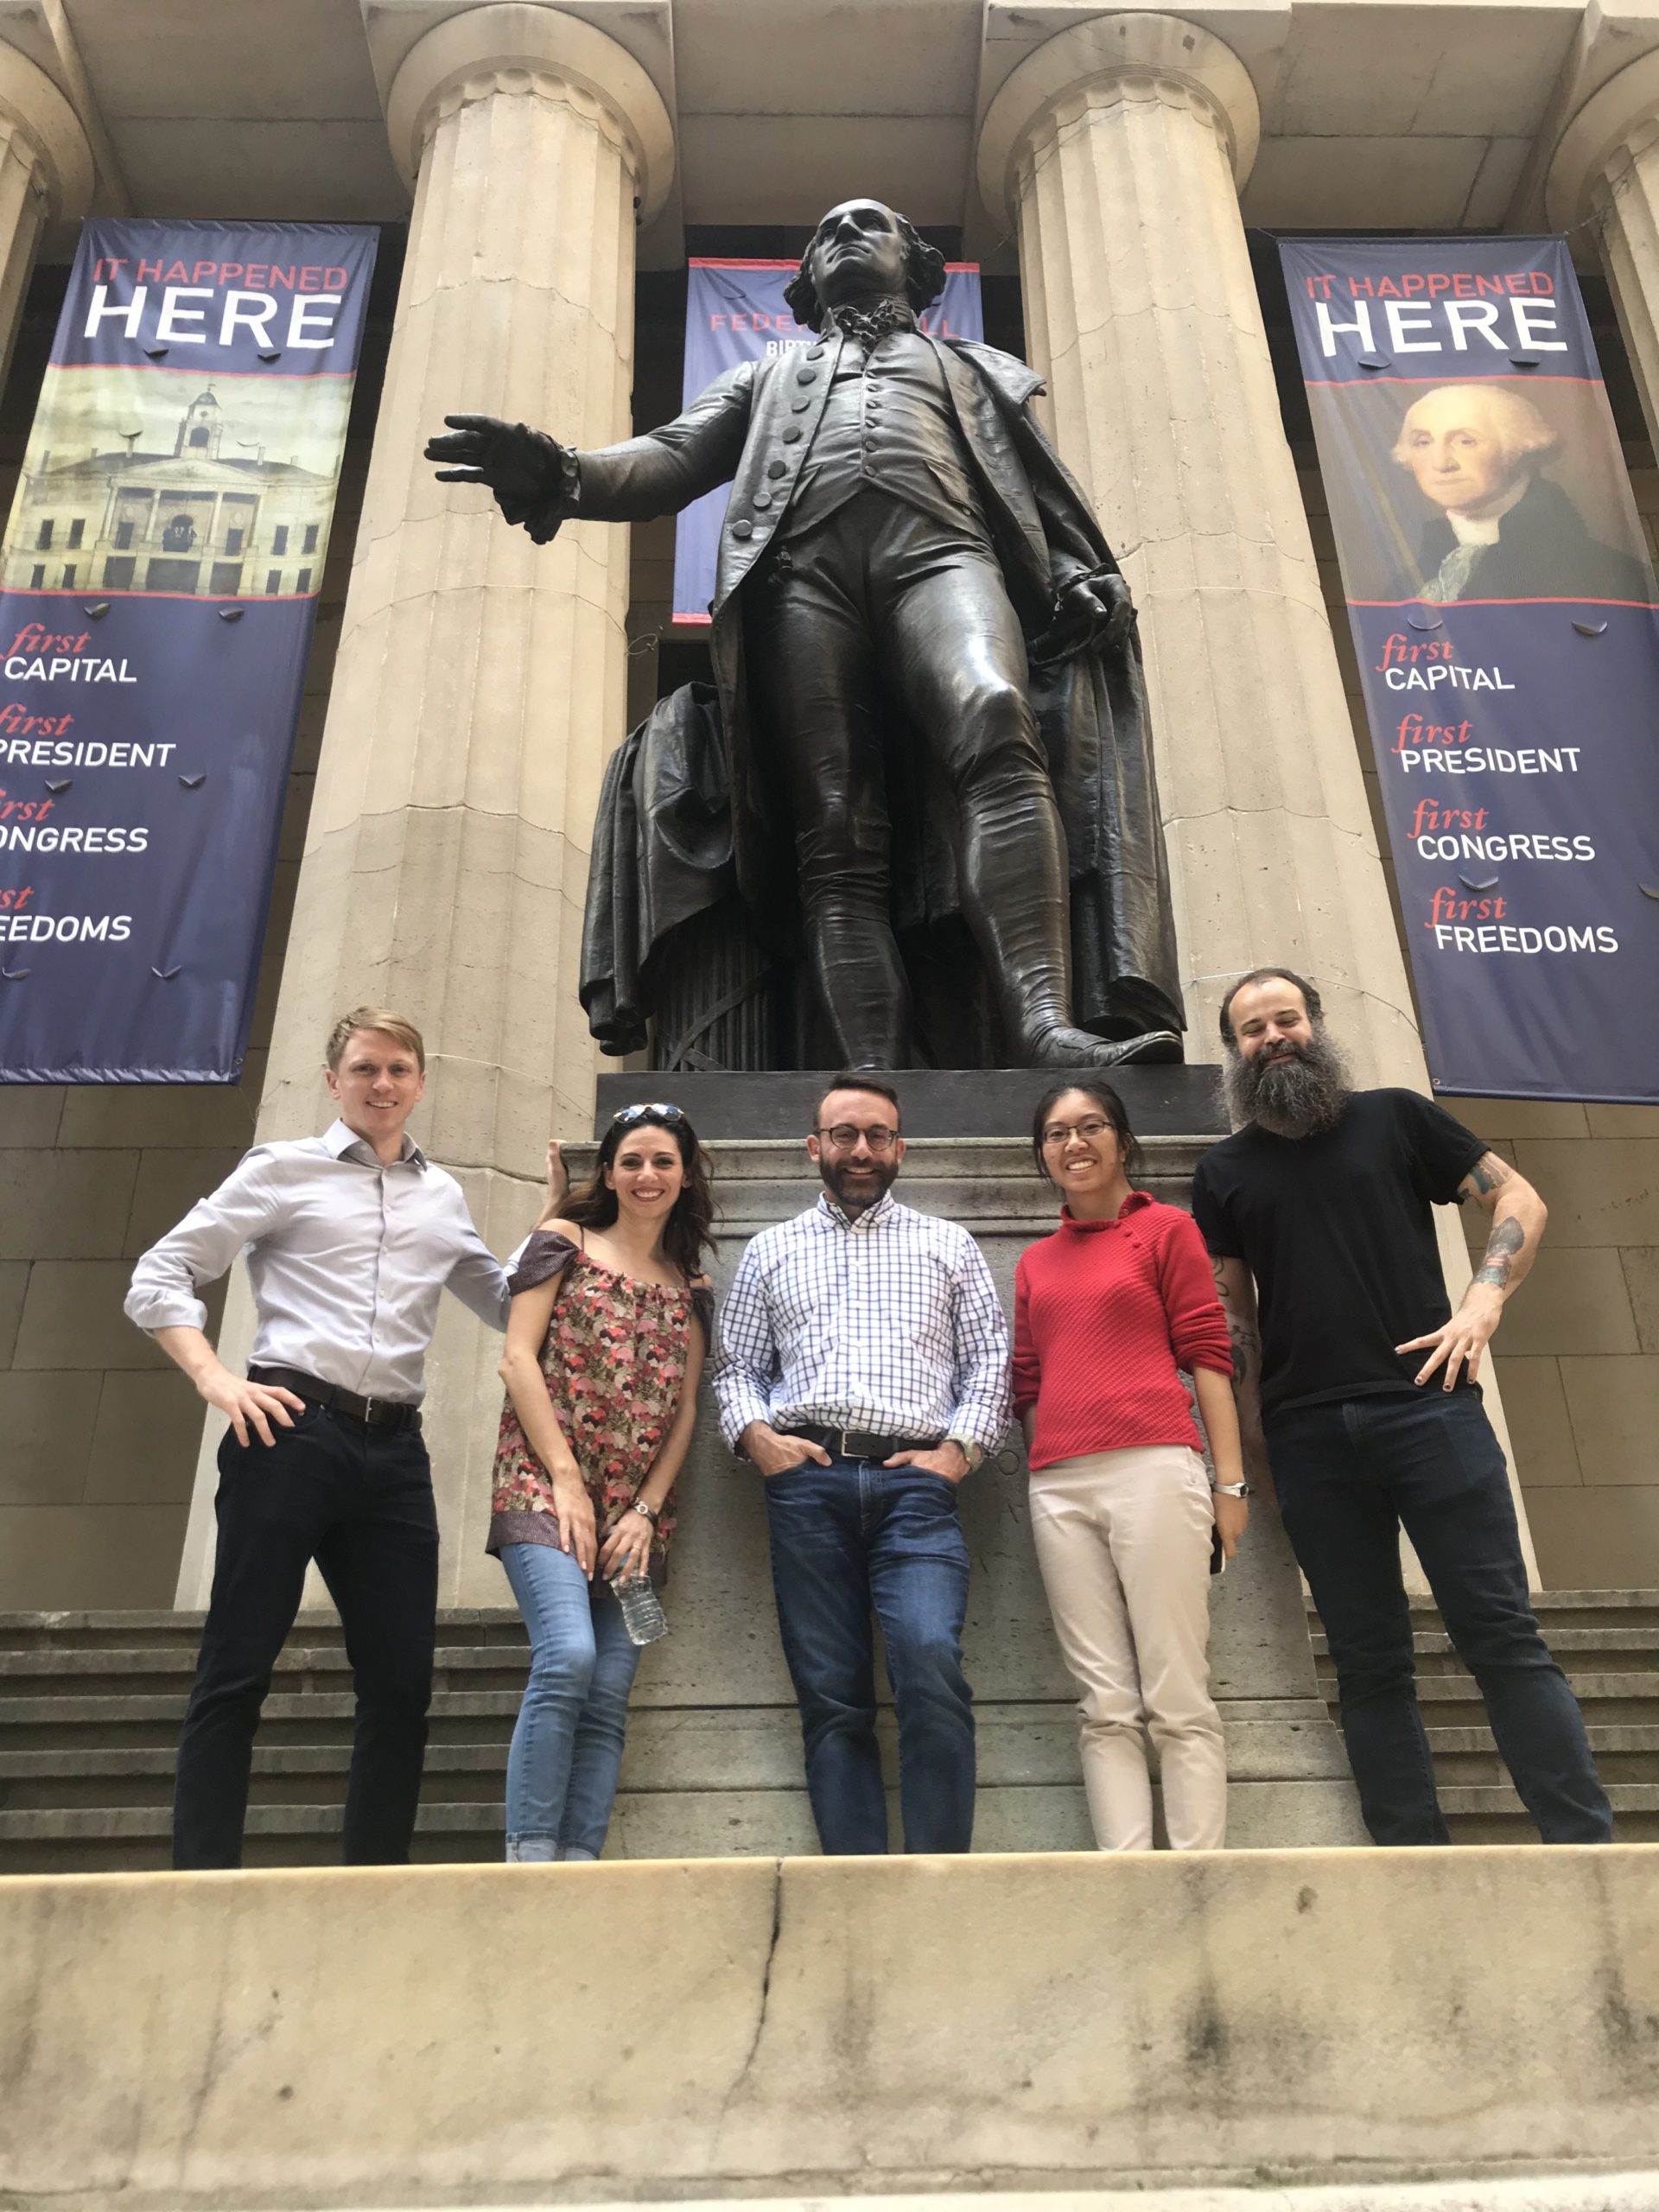
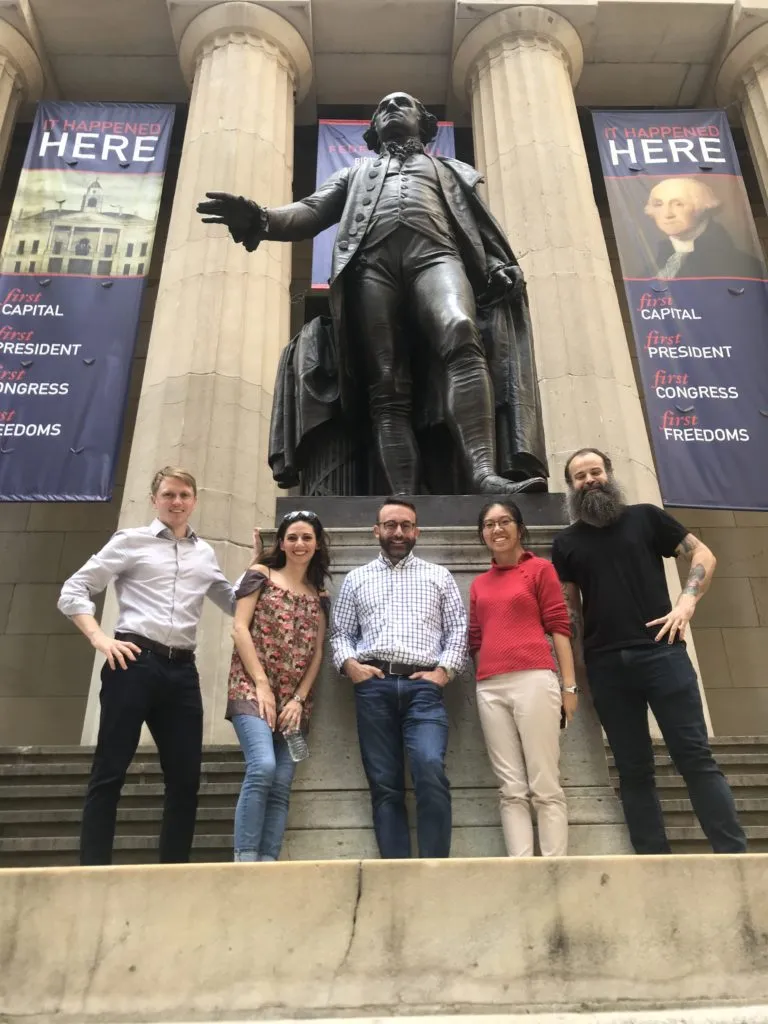
The team behind StreetCred. From left to right: Cassidy Rouse, Diana Shkolnikov, Randy Meech, Lily He, Tyler Gaw
Q: Hello Diana, Randy! Most readers might know you from your work at Mapzen. It’s not surprising to see you start a mapping startup – StreetCred. However, what is really interesting is the problem that StreetCred aims to solve – making place data accessible for everyone
(A): How is this different from a “places database” version of OSM?
Randy: We want to be complementary to OpenStreetMap, and my personal goal is to support it as I have with MapQuest and Mapzen. But there are several serious problems with POI data in OSM that we want to solve by going in a different direction.
First, POI coverage in OSM is incomplete and out-of-date in most areas. I think there are only 3,000 POIs for restaurants in NYC for example. In the past, we’ve experimented with POI apps building directly on top of OSM, but there are too many problems. Assuming your users will OAuth with OSM, you then need a solution for photos, which aren’t available. This would be fine except that there aren’t stable IDs in OSM for POI records: I create a point, someone else changes it to a polygon, and it looks like a different record. The lack of human-understandable categories is another problem. There’s a robust developer ecosystem for other areas in OSM (rendering, navigation), but too many problems for the same to happen for POIs.

StreetCred – building a blockchain-based marketplace for location data
Second, while I am supportive of ODbL and feel strongly that companies should not be telling successful open projects what to do with their licensing, the fact is this license is a non-starter for most businesses with this dataset in particular. Displaying and navigating map is easy for companies to do with the license, but search and geocoding data needs to be mixed liberally in commercial databases, and this will never happen with ODbL even if certain things are clarified (and honestly that’s fine). Our goal is for companies to be equal participants alongside individuals and developers in StreetCred, so the licensing needs to reflect this.
We created Who’s on First at Mapzen, and the idea was that it could be used in projects like OSM based on the license. I’d expect the same dynamic here.
(B) Why a database of places? What motivated you to solve *this* particular problem?
Randy: At the end of Mapzen many longstanding goals had been met. For example, when I left MapQuest I was disappointed that there was no Google-quality navigation engine that scaled globally and included transit. Mapzen built Valhalla, and even Tesla uses it now.
POIs haven’t seen any improvement in years, and don’t seem close to improving now. I care about this dataset a lot, and Diana ran the search team at Mapzen and has a strong understanding of the problems. Also as we interviewed as Mapzen shut down, most companies wanted us to go in and solve this problem behind closed doors. We thought: why not do this in a startup and fix it once and for all?
Q: So in a nutshell, what StreetCred aims to develop is a protocol and a system that will help build this open database of places. However, from a layman’s perspective how is the incentive system any different than working on an uber-style gig for one of the big mapping companies?
Diana: Lack of compelling contributor incentives is one of the big issues facing data collection efforts. When companies pay contributors in fiat, such as US Dollars, at the scale it’s just not enough to make the work lucrative and sustainable for individuals. They also fail to establish a lasting relationship with the contributors to facilitate future maintenance of the added data. Once paid, there is no further connection between the contributor and the value they’ve created through their actions.
What we’re building at StreetCred will revolve around a token that will appreciate based on the coverage, quality, and freshness of the data captured by the StreetCred network. Contributors will always have the option to sell their earned tokens shortly after receiving them, thereby accomplish a similar compensation model as that of an Uber-style gig. However, it gets interesting should they choose to hold on to their tokens as the network grows and swells with real-time, accurate, and complete POI data. As the data improves more consumer demand drives up the token price, at which point the contributors are in control of how much they sell and how much they want to hold on to as the tokens appreciate. By holding portions of their earnings and continuing to contribute to the network to earn more they are positively aligned with the continued success of the overall protocol. These participants get to share in the value they helped create! You just can’t get that with the traditional Uber-style compensation model.
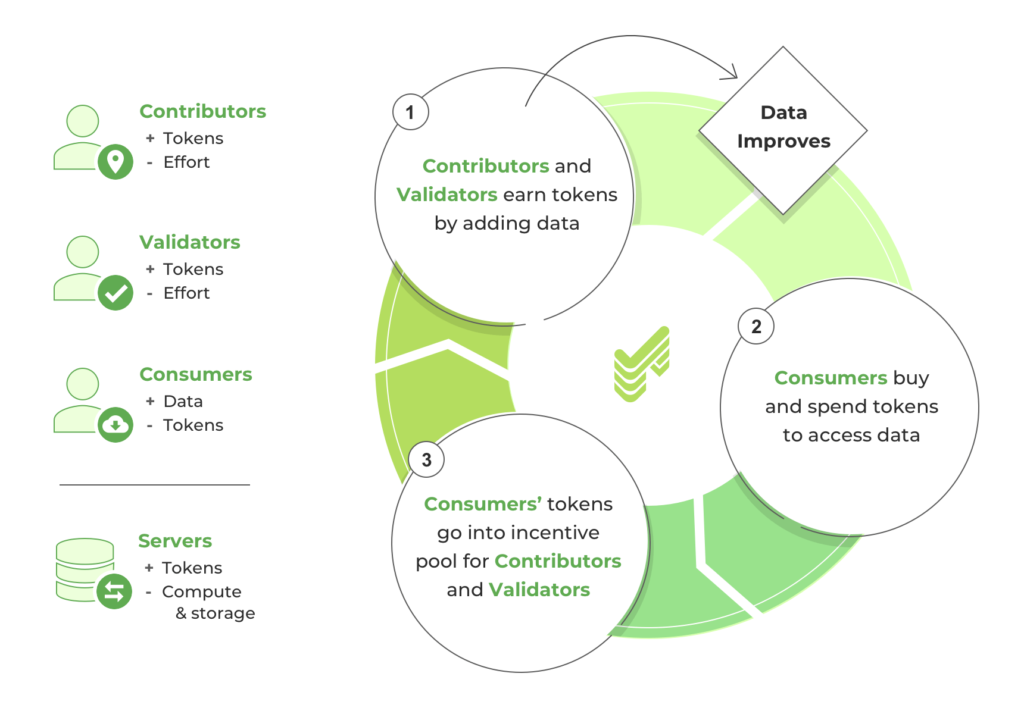
Here’s a high-level overview of the roles on the network and the resulting economy. Each participant brings tremendous value to the network and keeps the cycle in motion.
Q: So the larger the demand for the dataset, the more valuable the token gets. Sounds quite straight-forward. I’m guessing it isn’t that easy though. A couple of questions come to mind,
(A) Are all places going to be valued the same e.g. information about places in Africa might be more valuable than (say) Australia?
Diana: We are still working out the details, but we hope to create a fair base cost for each part of the world, where the value of the data in a region is computed based on a number of local economic factors as well as predicted demand for data for that region. After launch there will be mechanics through which network participants can adjust prices in any area to boost compensation, thereby signalling to the contributors where the consumer demand for data is high.
(B) Considering that this is a decentralized system with real incentives how you ensure people don’t duplicate entries or worse, enter incorrect details in an attempt to game the system?
Diana: While at Mapzen, we developed many open source tools to combat the woes of geospatial data collection and maintenance. One of those awesome tools was a C++ library known as libpostal, which among other things can help detect data duplicates. This is just one of the tricks up our sleeve.
But really the biggest safety mechanism to prevent data abuse is built right into the protocol via the Validator role. Validators are local participants who are tasked with verifying all the incoming data contributions for the region under their supervision. They need to simply travel to the nearby location and verify that the data being submitted objectively matches the ground truth. There must be at least three active validators in an area to complete any data contribution. Surveyed validators must reach consensus about the incoming data before it can be added to the database at which time all participants will be compensated. Validators will be anonymous and chosen at random so no collusion can take place. Should validators vote against consensus they risk losing tokens they’ve staked and their credibility on the network.
(C) How does StreetCred generate revenue?
Randy: The company’s job is to launch a successful protocol. In our case, we’re building an economy with a single product: POI data. The economy will have revenues from companies sponsoring data collection. You’ll see StreetCred engaging in traditional business development, but it’s in the service of launching the protocol.
Diana: Just as our data contributors and other token earning participants on the protocol, our team will be positively aligned with the increasing value of the token. We will similarly earn tokens for doing work on the protocol, the details of which will be quantifiable and transparent to all.
Q: In a system like this which is decentralized and token based, what do you think is going to be the biggest challenge in scaling up?
Diana: We are working on challenges similar to many other projects currently building on the blockchain. Given the high volume of relatively small token exchanges, known as micro-transactions, we are looking for host blockchain networks that can withstand such throughput and offer low transaction fees. We’re optimistic about the amazing undergoing efforts on all the existing networks and hope to join in those efforts as best we can.
Q: Could you tell us more about the tech stack at StreetCred? What technologies do you use? What programming languages do you guys use?
Diana: We’re currently using React Native for the consumer application and node.js for the backend API. For our data analysis layer, we’ve got Python. I will say we’re not attached to any particular stack and are always looking for the simplest most effective tool for the job.
Simplicity, great documentation, and lower barriers are key considerations, all of which served us well back at Mapzen, where we managed to build an awesome developer community (over 70K strong) around our open-source projects, most of which have gone on to continue development after the Mapzen shutdown in early 2018.
We aim to welcome all interested developers from diverse backgrounds and experience levels into the StreetCred community and help them make significant contributions to code, documentation, design, planning, testing, and overall good vibes!
Q: It’s still early days, but where do you see StreetCred 3 years from now?
Randy: I would like to see us with a billion POIs, and switching our focus from creation to maintenance.
Q: StreetCred raised $1 million in seeding funding (congratulations) to build what TechCrunch labelled “a blockchain-based marketplace for location data”. I’ve searched all over your website and couldn’t find the word “blockchain” mentioned once, kudos for that!
Randy: Is this a comment or a question 🙂 In seriousness, blockchain is an important technology but you will see StreetCred handle communications differently from other projects. Mainly because our goal is to attract as wide a userbase as possible. Many projects have complex, highly-technical communications as a fundraising strategy to appear legitimate in the absence of a working product. We’ll avoid that and focus on message clarity and working product. We’ll be writing about blockchain soon, and we hope it will be approachable and clear.
Diana: We’ll also be writing about many others things that will go into making this protocol successful, like social dynamics, data analysis, economics, categories of POIs, data models, community building, and more. Blockchain is just one of the many ingredients.
Q: Andrew Hill, former CSO at Carto gave a talk at Carto Locations earlier this year where he believed the (tech) pendulum is swinging back from centralized systems back to decentralized systems. Is this a trend that you see being replicated in the mapping industry?
Randy: I agree with him overall. For mapping, I think there are several opportunities but there are greater challenges in modelling the physical world. Also, mapping requires a level of expertise and specialization that make it harder to jump in, but I do think there will be a number of new projects here.
Q: You are based in New York, how’s the startup scene? Are there many investors specifically looking at geotech related companies? Are there any local meetups/events that cater to the geo-community?
Randy: I’ve been involved in NY tech for well over ten years and have always loved it. NYC has a mix of people from many different professions (finance, media, etc) that I prefer to the tech concentration of San Francisco, which is an important and special place as well. The early Foursquare product was developed in NYC, which I think makes sense because of the close nature of places; I think that will benefit us as well. GeoNYC is a good event that we used to be involved with at Mapzen. For blockchain, there’s a lot of meetups and a great energy.
Q: Okay, this is a tricky one – on a scale of 1 to 10 (10 being the highest), how geoawesome do you feel today?
Randy: Well, there’s a new build of our test app and I’m able to add places, so I’ll say 10. I go up and down!

Diana and Randy – founders of StreetCred
Diana: For the record, I’m an eternal optimist… but also the team just watched a demo from one of our own showing off some beautiful early data analysis maps which we’ll be sharing more publicly soon, so a 10 for me as well.
Q: While StreetCred is a relatively young company, both of you have extensive experience working in the mapping industry. Any closing remarks for anyone looking to start their own geo startup?
Randy: I like to focus on a problem that I’ve experienced, and have seen others experience. From my days at MapQuest ten years ago, I saw the challenges that restrictive data and services pose, and have focused on that since with StreetCred and Mapzen. It can be hard to break into funding; I’m happy to chat with new geo startups who are working on a product and have questions around this.
Diana: This is my first experience as a founder and I’m extremely grateful to have an opportunity to shape this exciting project from the ground up with Randy. Instead of remarks, I can offer to grab a coffee or take a call with anyone going through a similar experience or struggling to break through, and always happy to make any connections I can to help others reach for their goals, in geo or otherwise.
If anyone would like to reach you, what would be the best way to do so?
hello@streetcred.co would be good.
The Next Geo is supported by Geovation:
 Location is everywhere, and our mission is to expand its use in the UK’s innovation community. So we’re here to help you along your journey to success. Get on board and let’s start with your idea…
Learn more about Geovation and how they can help turn your idea into reality at geovation.uk
About The Next Geo
The Next Geo is all about discovering the people and companies that are changing the geospatial industry – unearthing their stories, discovering their products, understanding their business models and celebrating their success! You can read more about the series and the vision behind it here.
We know it takes a village, and so we are thrilled to have your feedback, suggestions, and any leads you think should be featured on The Next Geo! Share with us, and we’ll share it with the world! You can reach us at info@geoawesomeness.com or via social media 🙂


