Spatial Data Cubes: When Time Becomes the Data

Anyone working with geospatial or satellite data today faces a clear mismatch. High-resolution Earth observation data is more available than ever, but the infrastructure to work with it has not kept pace. Analysts routinely spend large amounts of time downloading imagery, correcting for atmospheric effects, masking clouds, and aligning pixels before any meaningful analysis can begin. While automation, batch processing, and data access APIs can reduce some of this effort, much of the preparation overhead remains a fundamental bottleneck in Earth observation.
The problem is structural. Most geospatial workflows still treat satellite images as independent files, even though they represent repeated observations of the same locations over time. Spatial Data Cubes (SDCs) offer a structural way out of this problem, shifting geospatial work from a file-centric view of maps as layers to a query-centric view of data as a continuum. This article explains what SDCs are, why they exist, and how they make working with large geospatial datasets more practical.
What Is a Spatial Data Cube?
A spatial data cube is a way to organize geospatial data so space and time are handled together, rather than as separate files.
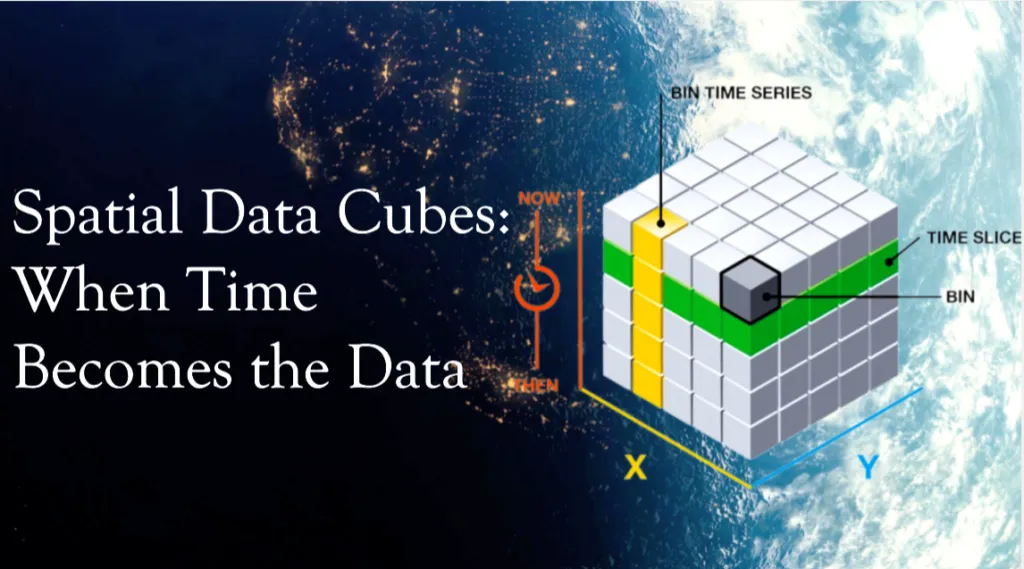
In most GIS workflows, satellite images are treated as independent layers. One image per date – one layer per time step. A spatial data cube takes a different approach. It organizes all observations of the same area into a single multidimensional structure, where coordinates (latitude and longitude or X and Y), and time are treated as equally important dimensions. Instead of working with snapshots, you work with a continuous block of data.
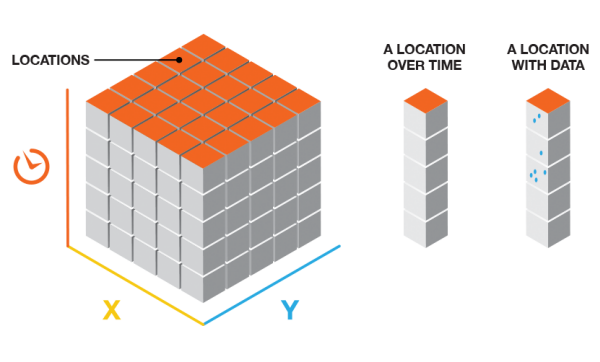
Source: ArcGIS
Conceptually, a spatial data cube extends a traditional map by adding time as a core dimension, often alongside additional variables such as spectral bands, temperature, or precipitation. This makes it possible to analyze how places change, not just how they look at a single moment.
At the architectural level, a spatial data cube is defined by a small number of dimensions:
| Dimension | Identifier | Analytical function |
| X | Horizontal spatial axis (Easting) | Defines spatial position and extent in the X direction |
| Y | Vertical spatial axis (Northing) | Defines spatial position and extent in the Y direction |
| Z / T | Time | Enables change detection and trend analysis |
| B | Bands | Distinguishes physical properties (e.g. NDVI, moisture) |
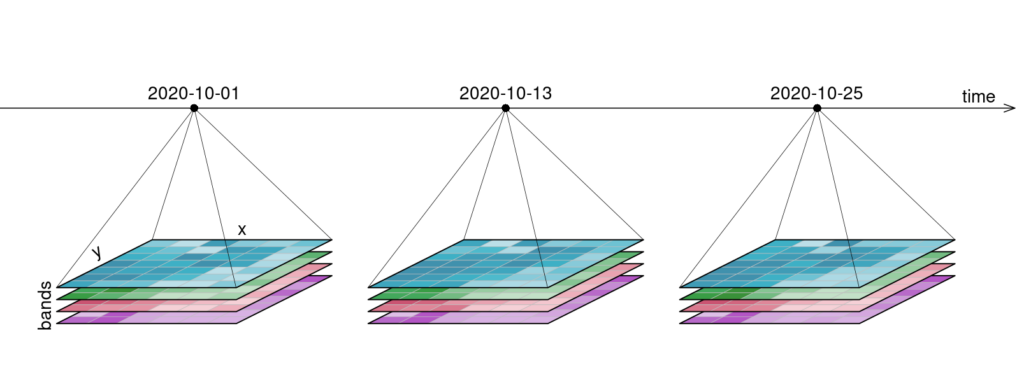
Example of a four-dimensional raster data cube with two spatial axes (X, Y), a temporal dimension (time), and a variable dimension (bands). Source: OpenEO
Similarly, a geospatial data cube organizes data into voxels (volumetric pixels), where each voxel contains a value for a specific point in space and time. This allows for slicing the data in any direction. A horizontal slice through the time dimension provides a standard map of a specific timestep, while a vertical slice through a coordinate provides a time-series graph.
When Time Becomes the Data
Geospatial data became difficult to manage because modern satellites generate observations faster and in greater detail than traditional GIS workflows were designed for.
First, there is velocity. Missions like Sentinel-2 revisit the same location roughly every five days, producing hundreds of observations for the same place over just a few years. Time quickly becomes a dominant part of the dataset rather than a secondary attribute.
Second, there is spectral complexity. Sentinel-2 captures 13 spectral bands at different spatial resolutions, covering visible, near-infrared, red-edge, and shortwave infrared wavelengths. Each observation is no longer a single image, but a stack of variables describing different physical properties.
Third, there is radiometric precision. Modern sensors such as Sentinel-2 use 12-bit radiometry, recording 4,096 intensity levels per band. This improves scientific quality, but significantly increases data volume and processing requirements compared to older 8-bit imagery.
How Spatial Data Cubes Change Analysis
SDCs simplify analysis by changing how geospatial data is structured and accessed. Instead of working with individual files and sensor-specific formats, cubes organize data into a unified grid where space and time can be queried directly. This shifts attention from data preparation to analysis.
One major benefit is working across time. In traditional workflows, calculating long-term averages or detecting anomalies requires loading and processing many separate files. In a SDC, time is just another dimension. Operations such as computing a mean, median, or trend can be applied directly across the temporal axis, which is essential for climate and environmental analysis.
Cubes also make regional comparison straightforward. An urban heat or vegetation analysis developed for Munich can be applied to Paris or Tokyo with minimal changes, since the data is already harmonized on a standardized grid. This reuse is a direct result of multidimensional analysis built into the data structure.
Another key element is analysis-ready data. SDCs are typically built from data that has already undergone geometric and radiometric correction, atmospheric normalization, and cloud masking. This removes repeated preprocessing steps and lowers the barrier to analysis.
At an architectural level, SDCs move away from file-based GIS. Instead of storing rasters as individual GeoTIFFs, cubes use multidimensional array formats such as NetCDF, HDF5, or Zarr. These formats are cloud-native and support lazy loading, where only the pixels needed for a computation are read from storage instead of downloading entire images.
Traditional GIS vs Spatial Data Cubes:
| Aspect | Traditional GIS workflow | SDC workflow |
| Data structure | Files, layers, tables | Multidimensional arrays |
| Storage formats | GeoTIFF, shapefiles | NetCDF, HDF5, Zarr |
| Time handling | Separate snapshots | Integrated core dimension |
| Data readiness | Manual preprocessing | Analysis-ready data |
| Processing model | Local, hardware-limited | Cloud-native, lazy loading |
| Typical analysis | Single maps | Multidimensional analysis |
The outcome is not just faster processing, but a shift in perspective. Analysts stop working with images and layers and start working with observations and patterns across space and time.
Where SDCs Are Used Today
SDCs are already widely used wherever long-term, large-scale environmental monitoring is required.
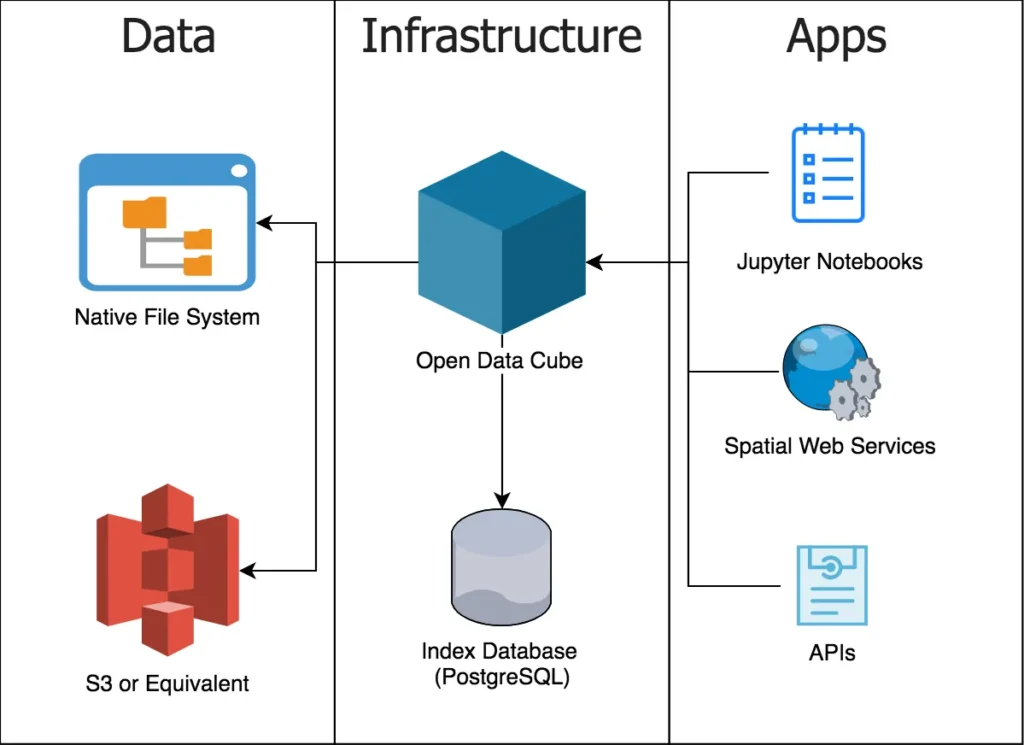
At the platform level, national and continental systems provide satellite archives as analysis-ready data cubes. Digital Earth Australia and Digital Earth Africa, using Open Data Cube, offer decades of Landsat data for applications such as agriculture, water monitoring, and drought analysis. In Europe, the Swiss Data Cube supports government monitoring of land use, ecosystems, and biodiversity. Global platforms like Google Earth Engine and the Microsoft Planetary Computer apply the same cube-based principles to planetary-scale datasets.
Cubes are mostly used to climate and environmental analysis. They are used to track long-term processes such as glacier retreat, deforestation, and temperature anomalies, helping identify regions where change is accelerating and informing climate assessments and adaptation strategies.
In cities and during disasters, cubes enable rapid change detection. Urban planners use them to monitor land cover, heat, and vegetation over time, while emergency responders compare pre-event and post-event conditions to map flood extents or damage within hours instead of days.
Across all these cases, SDCs matter because they turn growing satellite archives into structured, queryable datasets that support continuous monitoring and timely decisions.
A Practical Example: An Annual Vegetation Trend
To see how the SDC helps in practice, let’s consider a simple question:
Has the vegetation in Munich changed over the years 2020-2024?
The goal is not to analyze a single satellite image, but to compare many years in a consistent way. With a cube-based workflow, we can treat time as something we query and summarize.
The example below uses Python with the Google Earth Engine Python API to work with Sentinel-2 surface reflectance data. It calculates the mean peak summer NDVI for Munich for each year between 2020 and 2024.
To run it, you need a Google Earth Engine account and a local Python environment with the earthengine-api and matplotlib packages installed. After authenticating once, the script can be executed like any basic Python file or notebook cell. The computation itself runs on Google’s servers, not on your local machine.
The code:
Output
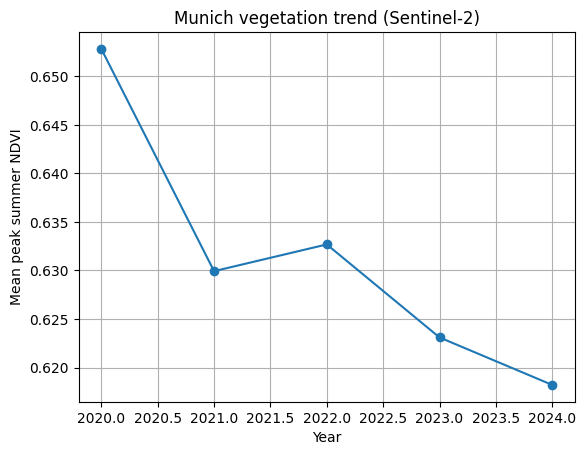
The important part is not the NDVI formula or the plotting code. It’s the workflow. The same structure handles five years of satellite data without looping over files or manually preparing inputs. This is the strength of SDCs. They let you focus on change over time, instead of on data management.
From Cubes to GeoAI
SDCs are not the end of the workflow. They provide the data structure that makes modern GeoAI workflows possible at scale.
Machine learning models require training data that is consistent across space and time. Without spatial data cubes, satellite archives are fragmented into files with different projections, timestamps, and preprocessing steps. Cubes solve this by presenting long, aligned time series for the same locations, which allows models to learn from temporal behavior rather than isolated images.
Cubes also work well with newer ideas like geospatial embeddings. Instead of treating locations as coordinates, embeddings represent places as vectors that capture how they behave over time. When the data is already organized as a cube, learning these representations becomes much easier and more reliable.
This is also why cubes matter for large-scale models. Foundation models for Earth observation are trained on years of satellite data covering the entire planet. Without a cube-like structure underneath, handling that volume and complexity would not be realistic.
Limitations and Why Spatial Data Cubes Still Matter
SDCs are powerful, but they are not a universal solution.
They come with a learning curve. Cube-based workflows often require scripting and data analysis skills, which can be a shift for users accustomed to desktop GIS tools. Most large cubes also depend on cloud infrastructure, raising questions around cost, vendor lock-in, and data sovereignty. And for small or one-off mapping tasks, traditional GIS tools are often still the better choice.
Despite these trade-offs, SDCs represent a shift in how geospatial data is handled. Earth observation systems now collect data faster than file-based workflows can manage. By organizing observations into multidimensional structures, cubes remove much of the preprocessing overhead and make long-term analysis practical.
As shown by examples like multi-year vegetation monitoring, cubes allow complex questions to be answered with relatively little effort. Looking ahead, they form the backbone of modern GeoAI systems that aim not only to observe the Earth, but to detect change and support timely decisions.
Further Resources
- https://www.ogc.org/initiatives/gdc/
- https://www.youtube.com/watch?v=OG_6ZaHJgC4
- https://r-spatial.org/book/06-Cubes.html
- https://www.un-spider.org/links-and-resources/daotm-data-cubes
Did you like this post? Follow us on our social media channels!
Read more and subscribe to our monthly newsletter!


#Contributing Writers


Next article
Inside SuperMap’s GIS Digital Twin Platform: A Blueprint for Smarter Infrastructure
SuperMap, a Chinese GIS software company, is rapidly gaining international traction, mirroring the broader global expansion of Chinese technology firms. Already recognized as one of the world’s leading GIS providers, SuperMap holds the second-largest share of the global GIS Software market according to ARC Advisory Report (trailing only Esri) and is the market leader in Asia. With distributors in over 50 countries and users in more than 100 countries, SuperMap’s growth is primarily driven by over 20 years of GIS innovation and ecosystem building.
SuperMap is pioneering a new approach to digital twins for urban and environmental management. The concept of a Digital Twin – a dynamic virtual replica of the physical world – is transforming how cities are planned and operated by enabling realistic mapping, simulation, and prediction of real-world systems through the integration of technologies like big data, cloud computing, IoT, AI, and GIS.
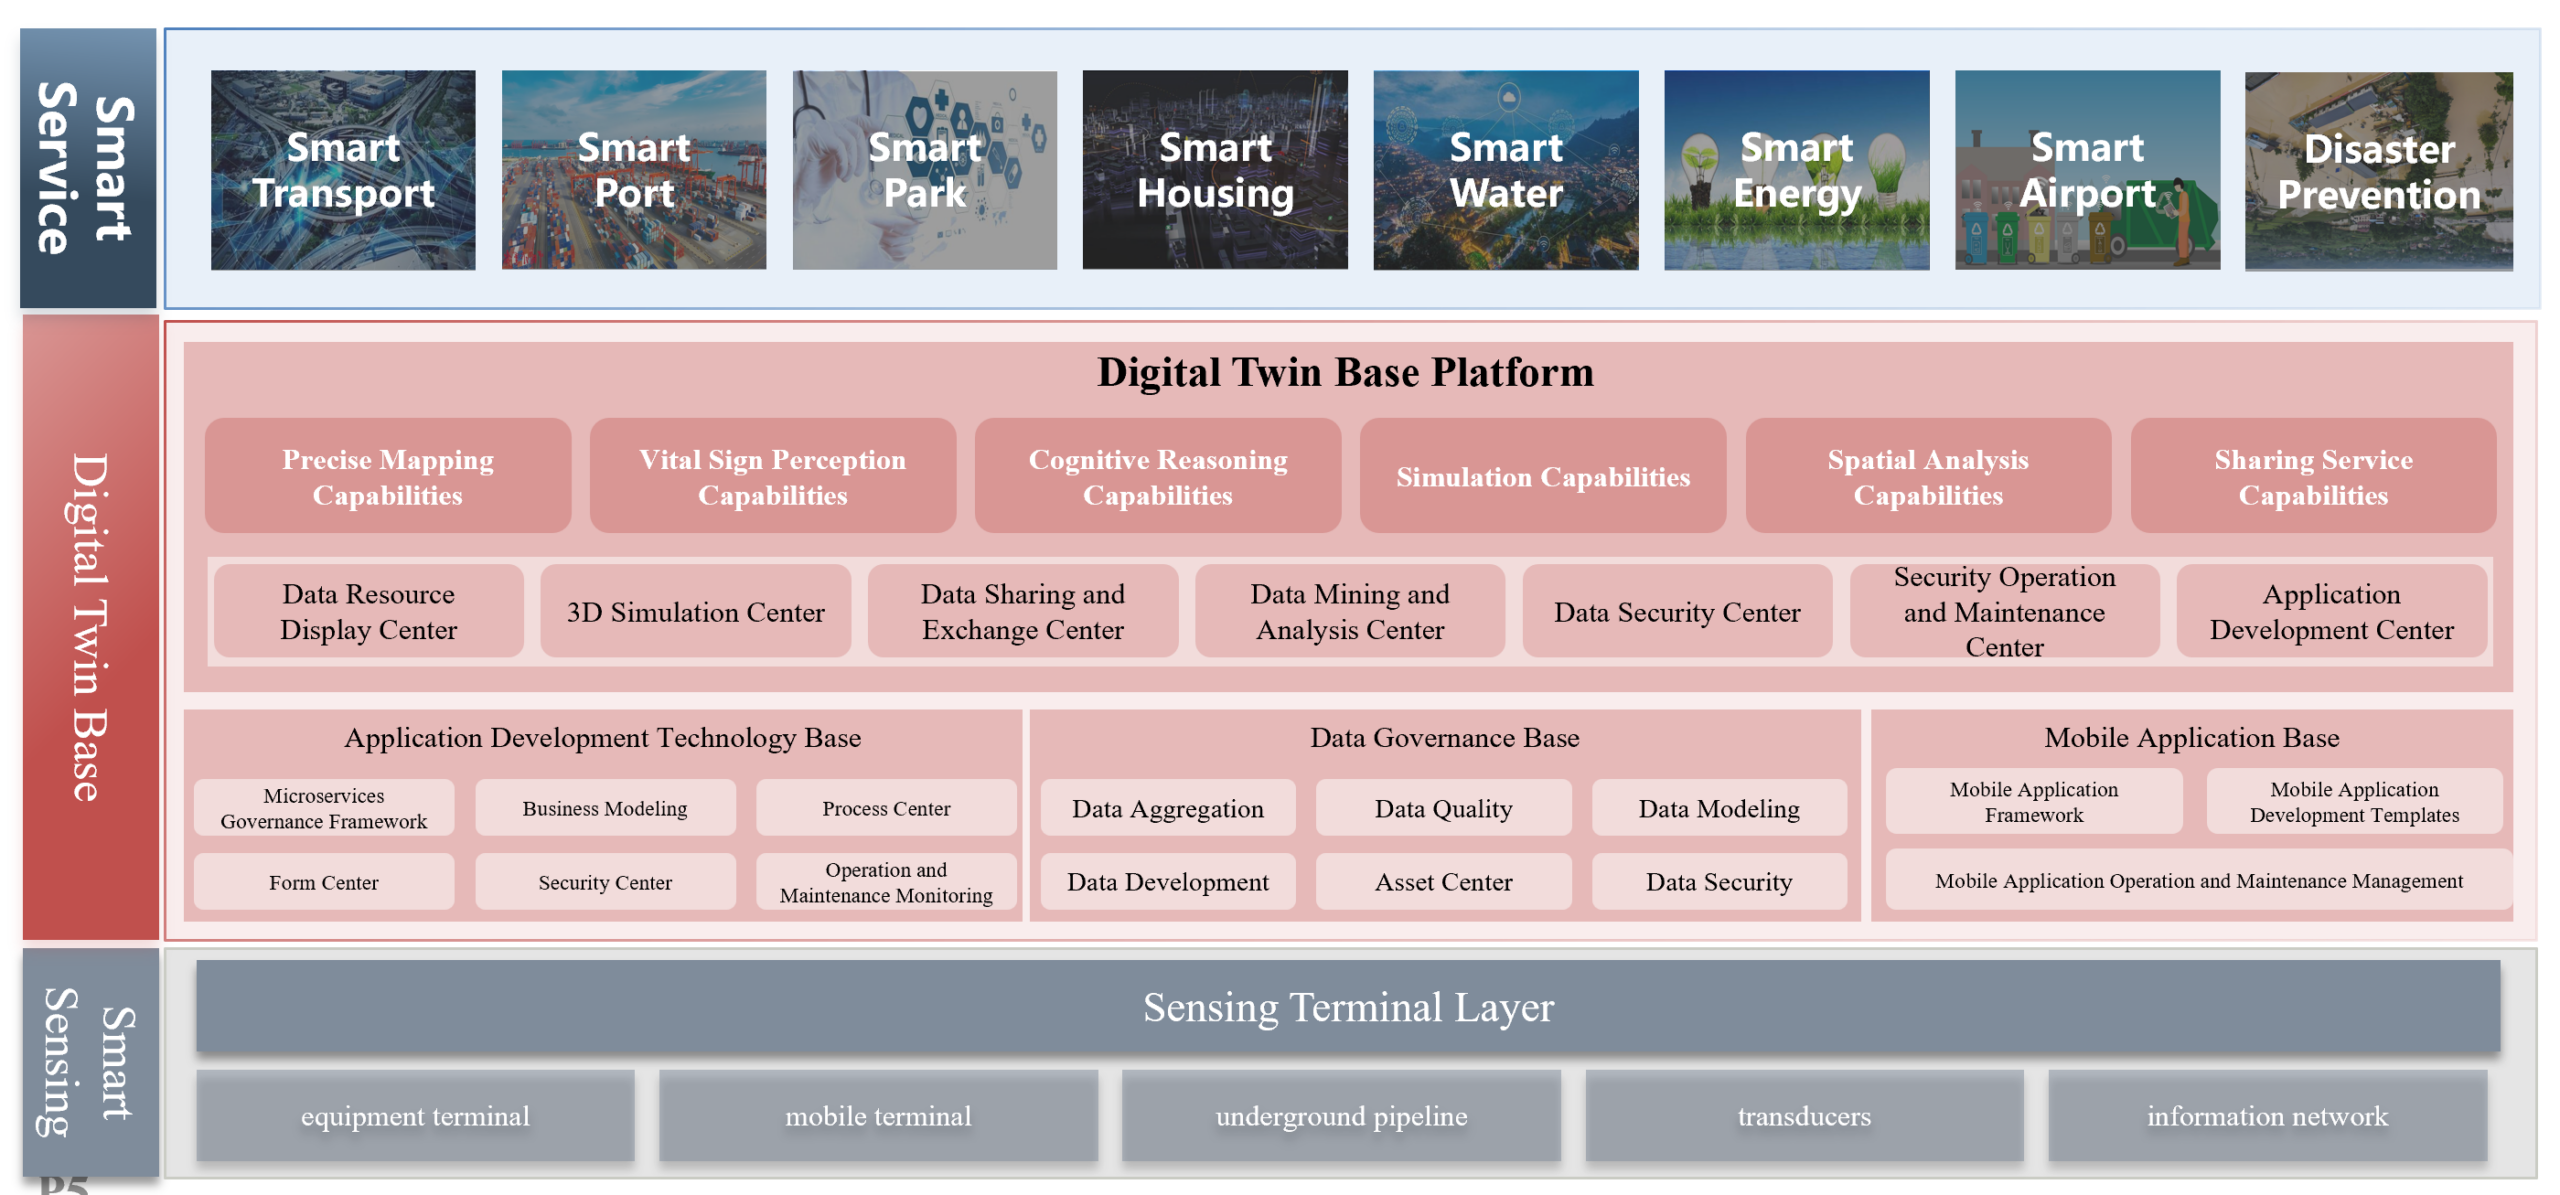
Digital Twin Platform Architecture Diagram
However, many organizations face hurdles in building effective digital twins, including siloed data standards, limited 3D capabilities, and lack of intelligent analysis. SuperMap’s Digital Twin Platform was designed to overcome these challenges. It consolidates multi-source geospatial information into an “all-space” spatio-temporal data foundation and provides a comprehensive toolkit for visualization, analytics, and collaboration. In this article, we explore the platform’s architecture and technical features – such as unified data integration, 3D/BIM support, GeoAI, and cloud-native design – and examine its real-world applications in land governance, smart cities, transportation, water management, and beyond.
Unified Digital Twin Platform Architecture and Features
SuperMap’s Digital Twin Platform is built from the ground up to unify diverse geospatial data and deliver real-time, intelligent insights. At its core, the platform merges 2D GIS maps, 3D models, BIM (Building Information Modeling) data, remote sensing imagery, IoT sensor feeds, and more into a single environment. This unified data integration breaks down traditional silos and creates a “single source of truth” for all spatial information. Below, we outline the key technical pillars of the platform:
- One-Stop Data Integration and Governance: The platform provides end-to-end capabilities for ingesting and managing multi-source, heterogeneous data. It supports standardizing and merging everything from basic survey maps and satellite imagery to oblique photogrammetry, LiDAR point clouds, BIM/CAD models, and IoT data streams. A unified data model and governance framework ensures that all datasets – regardless of format or origin – can be cleaned, stored, and integrated for use in the digital twin. This unified data foundation eliminates inconsistencies and data silos, enabling different departments to work from the same up-to-date information.
- 3D & BIM Support with Immersive Visualization: Traditional GIS struggled with large-scale 3D city models, but SuperMap’s platform is optimized for high-performance 3D. It seamlessly connects 2D and 3D geography with BIM designs, allowing entire urban environments (buildings, infrastructure, terrain) to be rendered in rich detail. By coupling GIS with a game-engine-level rendering engine, the system delivers smooth, immersive 3D scenes that support analysis, querying, and measurement. Users can visualize buildings, roads, and even underground utilities in true 3D, with realistic effects like sunlight and weather for enhanced situational awareness. This robust 3D/BIM integration means digital twins are not just static models but interactive representations of the real world, indoors and outdoors.
- GeoAI and Intelligent Analytics: “AI+GIS” is embedded throughout the platform to transform raw data into actionable intelligence. SuperMap’s geospatial AI toolkit includes capabilities like AI-based remote sensing image interpretation, construction monitoring via computer vision, automated map feature extraction, and even AI-assisted spatial Q&A. These tools enable predictive modeling and pattern recognition on spatial big data. For example, AI algorithms can detect illegal construction activities from satellite images or analyze traffic camera feeds for congestion patterns. By integrating machine learning with location data, the platform moves beyond visualization into predictive simulation and decision support, helping planners and managers anticipate trends (e.g., urban growth, land use changes) rather than just react to them.
- Cloud-Native, Scalable Architecture: The SuperMap Digital Twin Platform is designed with a modern cloud-native architecture for flexibility and scale. It employs a microservices framework where different functional modules (data services, rendering engine, analytics, etc.) run in containers and communicate via standard APIs. This allows the system to elastically scale resources for large datasets or concurrent users, and to be deployed across one cloud or multiple edge and on-premise environments as needed. The microservice design also means updates or new features can be deployed modularly without disrupting the whole system. In practice, the platform supports a “one cloud, multiple terminals” approach – meaning the same powerful engine can drive desktop GIS applications, web maps, and mobile apps simultaneously. This cloud-native foundation ensures that city-scale digital twins remain responsive, secure, and extensible, supporting cross-regional collaboration and high availability.
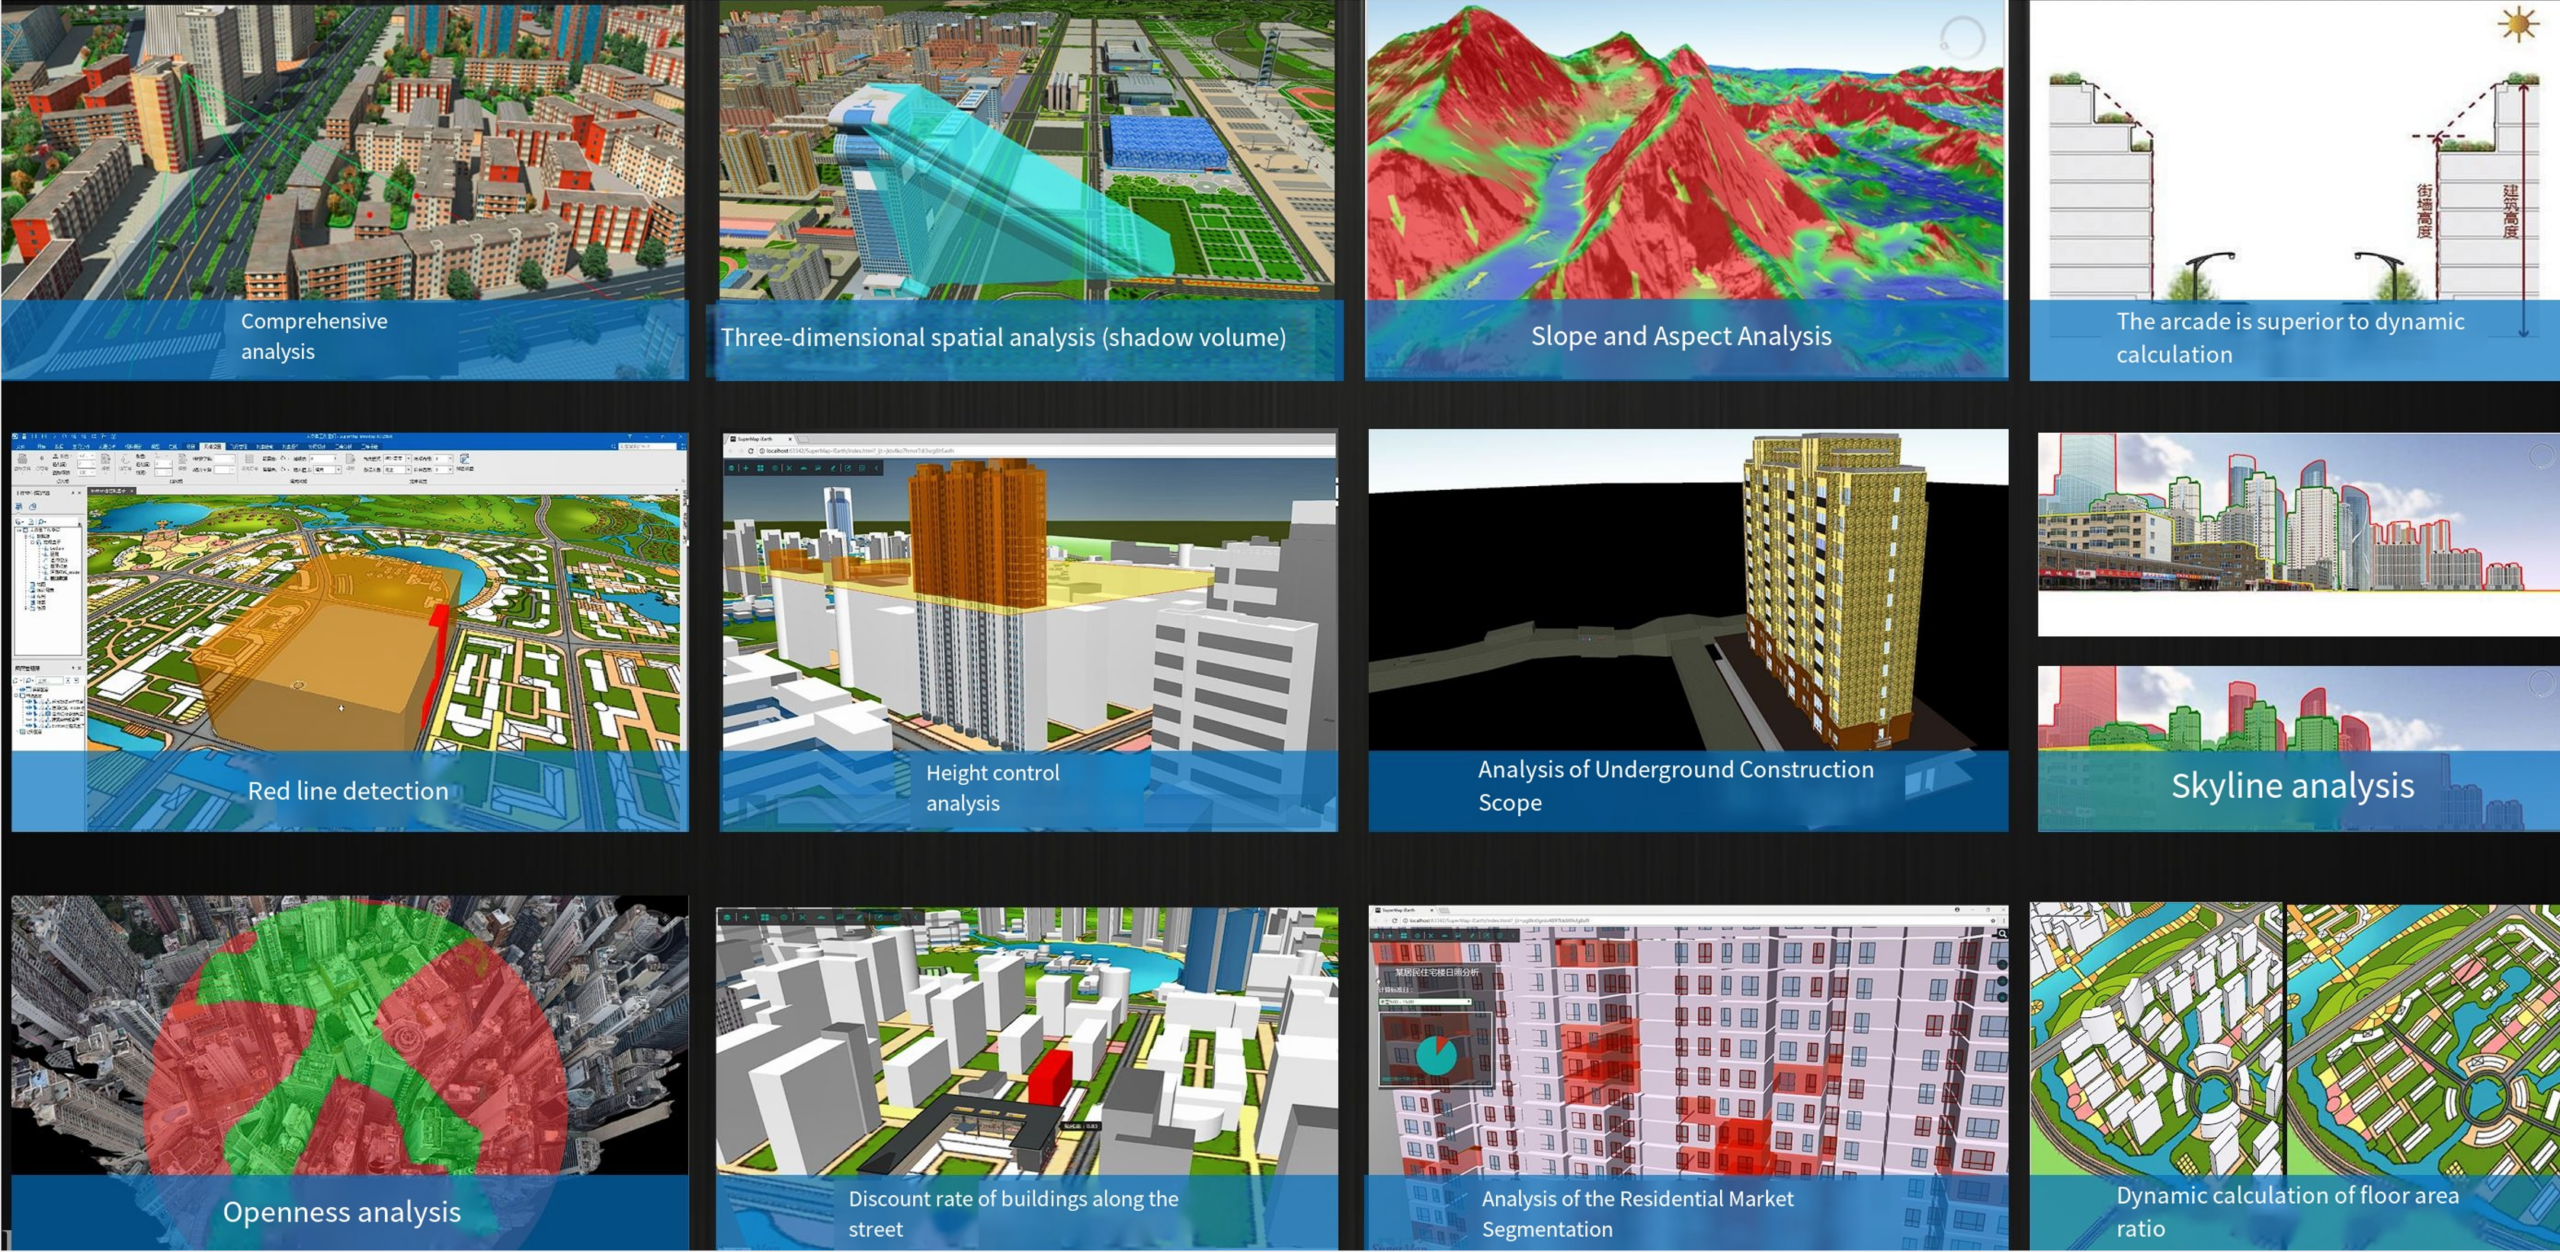
3D Visualization and Spatial Analysis
Together, these features form a distributed, intelligent, and collaborative digital twin platform that can serve numerous sectors. By building on two decades of GIS R&D and global experience, SuperMap has created a robust system that integrates all geospatial data types into one coherent model. In the next sections, we look at how this platform is being applied to solve real-world problems – from speeding up land administration to optimizing urban infrastructure – in a variety of domains.
Land Management and Natural Resources
Effective land governance and resource management are foundational to economic development and sustainability. SuperMap’s digital twin technology is helping governments modernize these traditionally slow, paper-based processes into streamlined, data-driven systems:
Digital Cadastre and Land Administration: In many regions, land ownership records are incomplete or managed in disparate, manual systems, leading to unclear rights, disputes, and slow transactions. SuperMap’s platform addresses this by deploying an AI-powered, end-to-end digital cadastre solution. It automates the entire land registration workflow – from field data collection and 3D boundary mapping to online registry updates and title issuance – creating a single, authoritative source of truth for land rights. By replacing paper maps and siloed databases with a unified digital twin of all parcels, the system brings transparency and speed to land transactions. Governments have reported dramatically faster processing (e.g. cutting permit and registration times from months to days) and fewer land disputes, as all stakeholders can access the same up-to-date information. Secure, clearly-defined land rights in turn boost investor confidence and enable land to become a reliable asset for development.
Natural Resource Permitting: Managing permits for resources like mining, forestry, or water use often involves multiple agencies and lengthy approvals, which in the past could stretch on for years. SuperMap’s integrated geospatial platform breaks down these bureaucratic silos by uniting all permitting departments on a single digital portal. Each proposed project can be evaluated against spatial rules and constraints in real-time – for example, automatically checking if a mining application overlaps a protected area or violates zoning regulations. The platform enforces clear, rule-based workflows and uses satellite imagery plus AI to continuously monitor sites for any unauthorized activities. The result is a much faster, more transparent permitting process with predictable outcomes. Companies benefit from quicker approvals and reduced corruption risk, while regulators can ensure compliance and sustainability (e.g. detecting illegal logging or mining early). By streamlining permit governance, the digital twin platform accelerates responsible investment in natural resources without compromising environmental oversight.
Intelligent Analysis and Predictive Decision-Making
Urban Planning and Smart City Operations
Modern cities are leveraging digital twins to plan better and manage infrastructure more intelligently. SuperMap’s platform provides urban planners and city officials with a live 3D model of the city that aggregates data across departments, enabling a shift from reactive management to proactive, data-informed decision-making.
Urban Planning & Construction Simulation: City planners traditionally rely on static maps and disconnected systems, which struggle to account for real-time changes like new developments or shifting population patterns. SuperMap’s solution creates a unified 3D digital twin of the entire city, incorporating GIS layers with BIM models of buildings and engineering works, plus real-time sensor inputs. Planners can use this dynamic model to simulate future scenarios – for example, testing how a proposed zoning change or new highway would impact traffic flow, sunlight, or emergency response times. The platform’s scenario simulation capabilities allow stakeholders to visualize and compare different development plans before implementing them. During construction, IoT sensors and drones feed into the twin, so managers can monitor progress and detect issues (like unsafe construction activity) in real time. This holistic approach leads to smarter urban growth: projects stay on schedule and within compliance, and resulting neighborhoods have optimized layouts for transportation, public services, and livability. Citizens also benefit through applications like interactive city dashboards or mobile apps that help find housing or services based on up-to-date data (e.g. locating an apartment with optimal commute and nearby amenities). In short, the digital twin becomes a virtual testbed for urban development, reducing risks and improving outcomes for city projects.
Smart Facility and Operations Management: The same platform is used to enhance day-to-day city operations and the management of facilities like campuses, industrial parks, and public spaces. By integrating real-time inputs – CCTV feeds, energy meters, traffic sensors, etc. – the digital twin serves as a unified command center for city managers. For example, in a large industrial park or smart campus, SuperMap can fuse data from all subsystems (security, power, HVAC, logistics) into one 3D operations map. AI routines automatically flag anomalies, such as an unauthorized entry detected on a CCTV or an abnormal spike in water usage, allowing rapid response. SuperMap’s Smart Park solution enabled one industrial zone to implement AI-powered security patrols and grid-based asset management, transforming a formerly fragmented operation into an efficient, safe, and tenant-friendly environment. City-wide, the platform supports use cases like utility network monitoring (preventing outages by visualizing sensor alerts on pipelines or grids) and emergency response coordination (simulating evacuation routes or deploying resources during a crisis). By moving from isolated systems to an integrated “city digital twin”, urban authorities gain better visibility and predictive capability in operations, leading to cost savings, improved public services, and higher resiliency in the face of challenges.
Transportation and Mobility
Transportation networks are another critical application area for SuperMap’s digital twin technology. As cities grow, they face congested roads, aging infrastructure, and the need for smarter mobility solutions. SuperMap’s transportation digital twin aggregates all relevant data – from detailed engineering models of roads, rails, and bridges to live feeds of traffic sensors and transit GPS – into a single 3D platform. This comprehensive view allows transportation planners and traffic control centers to simulate and optimize mobility at both the network and street level.
Using the platform, agencies can model traffic flow under different conditions (peak hours, accidents, road closures) and test interventions virtually before applying them in reality. For example, by simulating traffic patterns, a city can adjust traffic signal timings or design new bus routes to alleviate congestion hot spots. The digital twin also supports predictive maintenance of infrastructure: it can track the condition of bridges, tunnels, and pavement via IoT sensors and schedule repairs before failures occur. Integration with emerging technologies is another strength – the platform lays a foundation for Mobility-as-a-Service (MaaS) applications and autonomous vehicle testing by providing a high-fidelity spatial model of the transport network. Ultimately, these capabilities translate into tangible benefits: smoother traffic flow and shorter commutes, enhanced commuter safety, and more cost-effective management of transport assets over their life cycle.
Water Management and Environmental Resilience
Beyond urban centers, digital twin platforms are being applied to environmental and water resource management to improve resilience against natural disasters. Water conservancy agencies are leveraging SuperMap to create live digital models of entire river basins and water systems, enabling proactive management of floods, droughts, and water infrastructure.
SuperMap’s Smart Water solution integrates data from rainfall gauges, river flow sensors, satellite observations, and hydraulic models into a unified basin-wide digital twin. With this tool, water managers can simulate complex phenomena like flood waves traveling downstream or the impact of reservoir releases on communities. AI-driven forecasting is used to predict river levels and flood risks days or weeks in advance, while real-time monitoring triggers early warning alerts when certain thresholds are reached. This transforms the approach to flood control from reactive (after damage occurs) to proactive – aligning with the “Four Pre” principle (prediction, warning, preview, and plan) in disaster management. For instance, authorities can run flood scenario previews to identify which areas would be inundated if a major storm hits, and then formulate emergency plans or infrastructure reinforcements accordingly. During normal operations, the digital twin helps optimize water allocation and detect unauthorized changes to waterways (like illegal dredging or construction in floodplains) through continuous surveillance. The benefits include timely flood warnings to at-risk communities, more sustainable water use during droughts, and generally higher preparedness for water-related crises. By building a data-driven understanding of their water systems, governments can safeguard both the population and the economy from environmental threats in a way that was not possible with traditional tools.
Conclusion
From land to city to water, SuperMap’s Digital Twin Platform provides a unified digital foundation that is empowering smarter governance and infrastructure management across the board. By integrating 2D maps, 3D/BIM models, and live sensor data into one coherent system, it offers clarity in complexity – a real-time, single source of truth for decision-makers. Coupling this with GeoAI analytics and simulation means organizations gain foresight: the ability to not only see what is happening but also to model what could happen under various scenarios. The result is a shift toward proactive planning and predictive problem-solving, whether that’s preventing traffic jams or mitigating flood damage.
SuperMap’s experience and scalable technology infrastructure ensure that as the demand for digital twins grows, solutions can be rolled out at city and even national scales. In summary, SuperMap’s digital twin platform illustrates how GIS is evolving – moving beyond static maps to become the intelligent, cloud-powered backbone of smart cities, efficient transportation, sustainable land use, and resilient water management for the future.
Did you like the article? Read more and subscribe to our monthly newsletter!

