
Landslides are catastrophic geological events that cause significant environmental and economic damage worldwide. Effective assessment and management of landslide risks rely heavily on accurate geospatial data. Why monitoring landslide events is so important? Well, such events occur more frequently in 2024 due to climate change and more frequent heavy rains.
NASA Landslide Viewer
This article discusses a basic methodology for analyzing raster data in detecting landslide risk areas. Moreover, a post-event analysis of one of the recent landslides in Papua New Guinea was undertaken to showcase the impact of such incidents on the environment. This landslide, in Lagaip/Pogera District on May 24th, 2024, left a scar of 9 hectares and stretched 600 meters, damaging several buildings and Highland Hwy road.
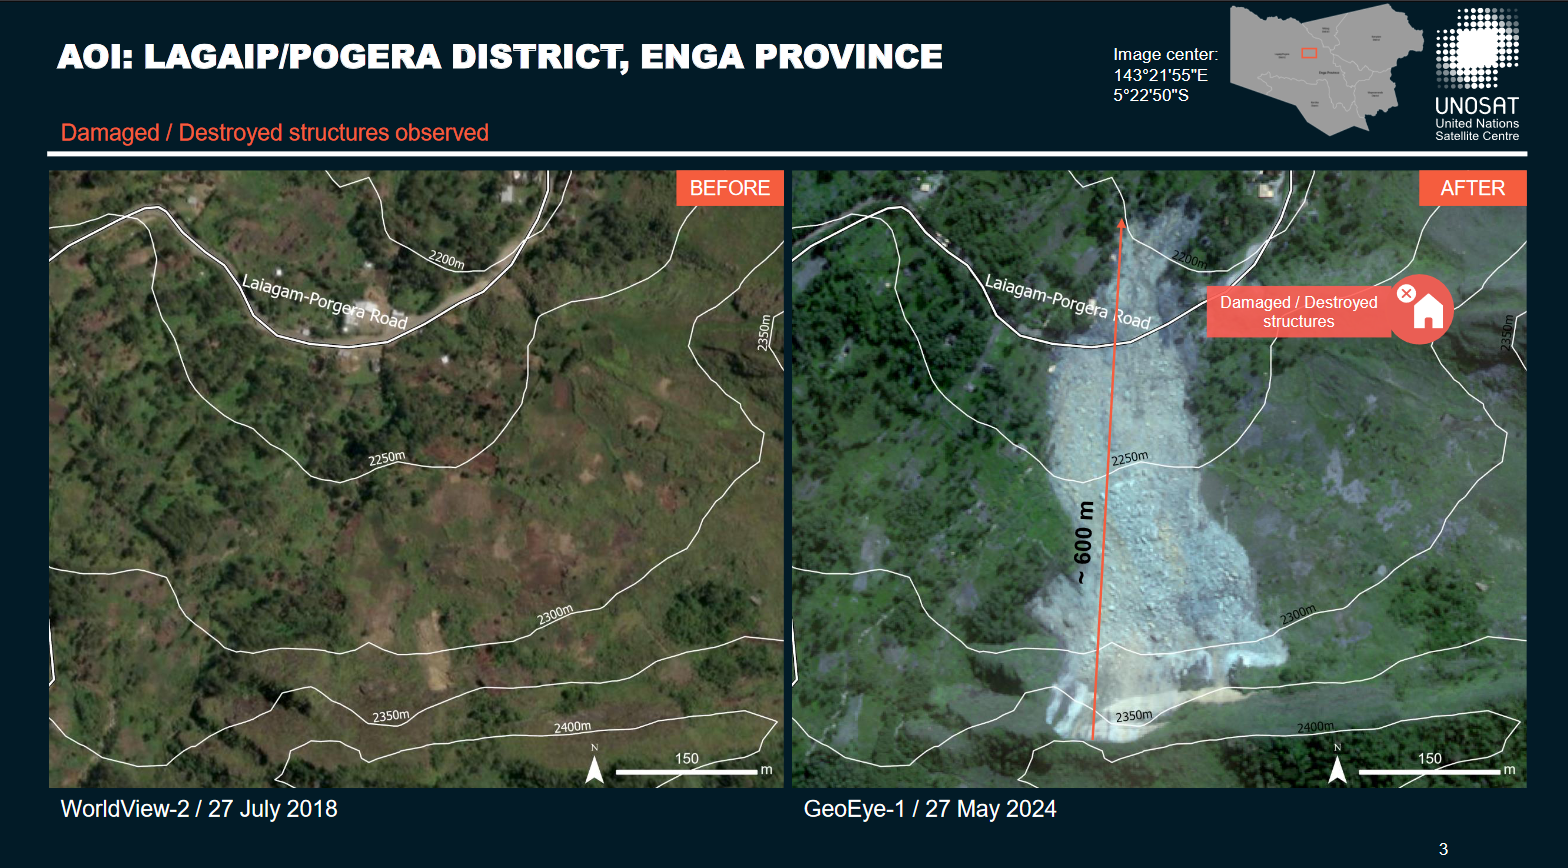
The case of Lagaip/Pogera District, Papua New Guinea. Source: Reliefweb
Methodology
Collected Datasets:
- The 12.5m DEM from the PALSAR Radiometric Terrain Corrected high-res collection.
- The annual sum of precipitation data sourced from the Climate Hazards Group InfraRed Precipitation with Station (CHIRPS).
- Post-event images captured by Sentinel-2, available through SentinelHub in various spectral compositions.
- Vector layers from the website data.humdata.org include polygons representing landslide area and point layer marking buildings damaged by the mentioned event.
Data Processing & Visualization
- Raster datasets were processed to extract slopes greater than 40 degrees from the DEM data, identifying the steepest terrain sections most susceptible to gravitational pull and potential landslides.
- The aspect data layer was analyzed to isolate northern-facing slopes, which, depending on regional climatic conditions, can be more prone to moisture retention and less sunlight exposure, affecting soil stability.
- The precipitation raster was filtered to highlight areas receiving more than 2500 mm of annual rainfall, a critical threshold that significantly increases the likelihood of soil saturation and subsequent landslide occurrences.
- By overlaying these processed conditions—steep slopes, northern aspects, and high precipitation—the analysis pinpointed the zones with the highest risk of landslide, providing vital information for targeted risk management and mitigation efforts.
Raster analysis in QGIS: aspect, slope, precipitation, output layer
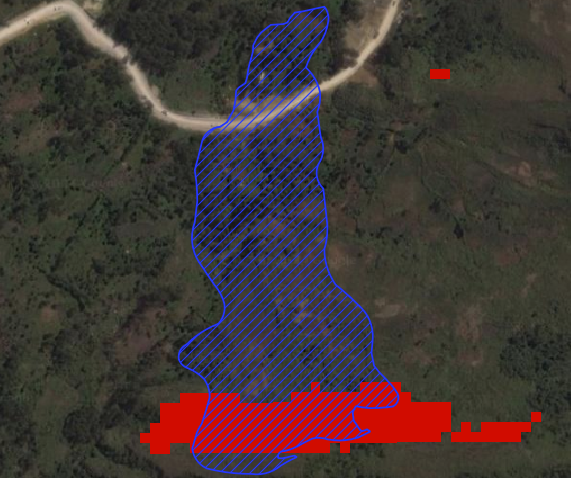
Overlap was found between the area of the specific landslide, mentioned (blue), and the results of the GIS analyses carried out -detected landslide-prone zone (red).
Post-event look
Spectral compositions represent the topographical changes resulting from the earth’s movement – loss in forest areas or reducing the moisture index. Vector layers help better assess the extent of damage and provide additional information in the attribute table.
The landslide visualized in spectral compositions
Discussion
This study highlights the efficacy of simple raster analysis in detecting landslide-prone areas, using a combination of DEM, precipitation data, and spectral imagery. The case of the Lagaip/Pogera District in Papua New Guinea illustrates how these methods can effectively identify high-risk zones and assess post-event damage. By focusing on factors such as slope, aspect, and rainfall, this analysis provides crucial insights for proactive landslide risk management. The integration of geospatial data and raster analysis thus proves to be a valuable tool in mitigating the devastating impacts of landslides.
Did you like the article about detecting landslide zones? Read more and subscribe to our monthly newsletter!


#Environment

Next article

Planet data can be integrated into your geographic information system (GIS) of choice — be it ArcGIS, QGIS, or Google Earth Engine — to help you uncover new insights and perform rich analysis.
There are three simple integration pathways to bring Planet data into your GIS workflow:
- Desktop GIS Integrations: Search, access, and analyze Planet’s catalog of daily, global imagery directly from ArcGIS Pro or QGIS — just download the plugin.
- API-First Platform: Planet offers extensive APIs that allow you to build data pipelines and design custom integrations, whether it’s built on ArcGIS, open source software, Google Earth Engine, or cloud and web mapping platforms.
- Streaming Web Services: If you are working with GIS software and looking for the simplest way to access Planet imagery, consider streaming Planet data to any software that supports the Open Geospatial Consortium (OGC) WMS or WMTS standards.
This article will help you decide which of these integration strategies is best for you and provide resources to help you get started. To get access to Planet data, reach out to our team.
If you want to focus only on integrating with ESRI ArcGIS software, you can also watch our on-demand webinar, Integrating Daily Imagery From Planet With ArcGIS.
WHY INTEGRATE PLANET DATA INTO YOUR GIS WORKFLOW?
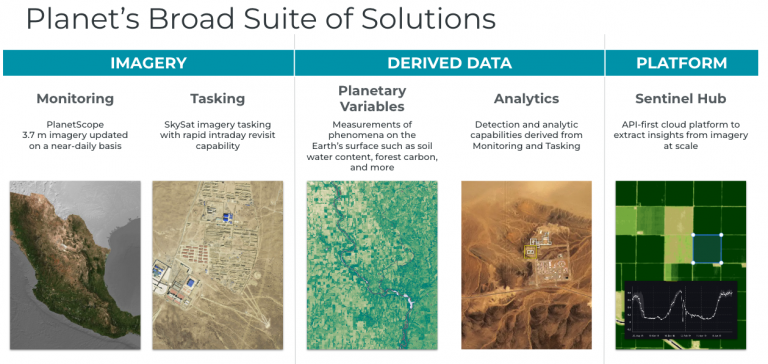
Driven by the mission to make change visible, accessible, and actionable, Planet is a leading provider of global, daily satellite imagery and geospatial solutions. Founded in 2010 by three NASA scientists, Planet designs, builds, and operates the largest Earth observation fleet of imaging satellites. Today, Planet’s global daily Earth data, analytics, and powerful cloud-based tools are all accessible through Planet Insights Platform.
You may want to add Planet’s near-daily data and insights to your GIS workflow for a number of reasons, including:
- Mapping: You want to enrich your maps with more current satellite imagery than what’s available in off-the-shelf basemaps so that your imagery matches other GIS data more closely.
- Sharing: You have Planet imagery, and you want to make it available on your GIS platform so that the rest of your organization can access the imagery for their workflows.
- Analysis: You want to use your preferred remote sensing analysis tools (e.g. for machine learning or spectral analysis) available in your GIS software to generate insights from Planet data.
1. DESKTOP GIS INTEGRATIONS
If you use the ArcGIS or QGIS desktop applications, you can download a Planet plugin that enables you to discover, preview, stream, and download Planet Basemaps and imagery. You can seamlessly integrate these datasets into your GIS workflows and leverage your preferred analysis tools to streamline your work.
Check out this demonstration or take a look at the developer resources page for the Planet Add-in for ArcGIS Pro to learn more about what you can do.
Similarly, the Planet QGIS Plugin provides access to Planet’s satellite imagery directly from QGIS. Learn more on the developer resources page for the Planet QGIS plugin.
Sentinel Hub — now part of Planet Insights Platform — also offers a plugin for QGIS, and can be used together with the Planet plugin to enable imagery analysis and streaming in QGIS. Using the Sentinel Hub Plugin, you can bring satellite imagery — including Planet imagery — into your GIS for visualization purposes, including evaluating accuracy, detecting change, assessing land cover based on time series, and more with a Sentinel Hub account.
WEB SERVICES-BASED INTEGRATIONS
The desktop GIS plugins remain a great option for accessing Planet data, however, you may want to consider web GIS integration options, including our API-first and web services-based integrations for a number of reasons, including:
- Scalability: These are typically more scalable, especially when using cloud platforms
- Shareability: These approaches make data more easily shareable through Web GIS tools
- Speed: They offer the lowest-latency path to imagery
2. API DELIVERY INTEGRATION
Planet Insights Platform is designed to be API-first so that developers can build workflows that scale and integrate with their choice of software. When your use case requires more advanced GIS capabilities, Planet Insights Platform offers extensive APIs that allow you to build your own imagery pipeline into your ArcGIS environment or Google Earth Engine.
Hosting Planet imagery in your GIS application enables you to use advanced tools, store imagery in your cloud of choice, or utilize third party imagery management tools, such as mosaic datasets and image services in ArcGIS.
Planet does this through delivery to your cloud storage destination; we support Google Cloud Storage, AWS, Azure, and more. In addition to cloud delivery, you can use our APIs to work with remote sensing analysis platforms, such as:
- Sentinel Hub: Part of Planet Insights Platform, Sentinel Hub is a scalable Earth observation platform that provides tools for advanced remote sensing analysis, customizable visualization, and simple OGC streaming.
- ArcGIS Image: You can deliver data to your cloud storage to be used with ArcGIS Image Server, or you can create custom data pipelines to ArcGIS Image for ArcGIS Online by downloading and uploading to ArcGIS Online to be used with ArcGIS Image for advanced imagery analysis. Here is a code sample that you can use to publish PlanetScope Imagery to ArcGIS Image for ArcGIS Online.
- Google Earth Engine: Directly deliver data to Google Cloud Storage to be used with Google Earth Engine. Learn more at the Google Earth Engine Delivery Integration page on our developer page.
When you choose to deliver data to your own cloud storage destination or off of Planet Insights Platform, there are a couple of extra steps to make the imagery usable in your workflow. For example, you may need to configure GIS software to read images from cloud storage.
Or, if you choose to build your own imagery technology stack, you’ll need to:
- Implement event-driven processes to handle cloud deliveries and index the imagery in a catalog, such as STAC
- Manage tile server infrastructure for serving imagery that handles compositing and dynamic rendering server-side
- Build an analysis service for imagery processing to handle workflows like compositing, data fusion, and multi-temporal analysis
- Create security and authentication to manage access to imagery
However, you don’t have to build this yourself — Planet Insights Platform can manage all of this for you, and you can use APIs to immediately start to analyze, visualize, and stream satellite imagery when you choose to deliver data to Sentinel Hub.
3. STREAMING WEB SERVICES
Our cloud-native web services integration is one of the most flexible pathways to integrate Planet data into your GIS workflow.
If you are working with GIS software and looking for the simplest way to access Planet imagery, leverage the Open Geospatial Consortium (OGC) API to stream WMS and WMTS services directly into your application of choice — be it any ArcGIS software, QGIS, Felt, or any other web mapping platform.
Planet Insights Platform provides ways to set up customized OGC services in a serverless environment that makes for a much simpler implementation — no need to download, rehost imagery, or use cloud storage — just stream imagery directly from the platform into your applications.
On Planet Insights Platform you’ll find all kinds of great tools, including customizable rendering options to filter clouds, display spectral indices, false color composites, and more. You’ll find extensible and flexible APIs for developers to customize interaction with OGC services to filter through time, change visualizations, and view analysis outputs in GIS software. For example,
- ArcGIS: ArcGIS Online and Enterprise support working with WMTS and WMS services — simply add the URL to your imagery from Planet and you can have imagery in your maps in minutes. Check out this demo to see what this looks like in action.
- QGIS: Sentinel Hub offers an integration for QGIS users. Sentinel Hub can create a remote sensing infrastructure where local analyses aren’t scalable. In the integration, you can:
- Access all of your configurations for customizable visualizations
- Dynamically generate OGC services for given date ranges to compare over time
- Share data and maps without embedding API keys
In QGIS, Sentinel Hub can be your remote sensing infrastructure where local analyses aren’t scalable. This video shows three layers from Sentinel Hub in QGIS: two seven-day composites of PlanetScope from two different weekends, and then an NDVI difference with a custom symbology applied with a mask for NDVI change <-0.2.
Learn more about Planet Insights Platform capabilities.
GETTING STARTED WITH PLANET
Planet has flexible integration options for any workflow, be it through the desktop application plugins, the API-first platform, or our OGC streaming web services. Find the workflow that works best for you, and get started today.

