
High-Altitude Platform Stations, commonly known as HAPS, are unmanned aerial platforms operating high above our heads in the stratosphere, typically at altitudes of 16 to 24 kilometers above Earth’s surface. Positioned between drones and satellites, HAPS offer a unique vantage point that makes them ideal for services such as internet connectivity, navigation, and Earth observation.
The HAPS technology is not entirely new. One of the earliest examples dates back several decades: Boeing’s Condor, a remarkable 60-meter-long reconnaissance aircraft capable of staying airborne for up to 80 hours.
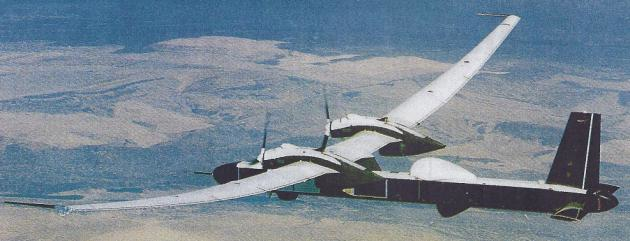
Boeing Condor UAV, Eric Theunissen (2012)
Today’s HAPS platforms have evolved far beyond. Thanks to advances in electric propulsion, solar energy, and lightweight materials like carbon-fiber or UV-resistant solar arrays, some modern systems can now remain in continuous flight for even 3 years. On December, 23rd, the Aerostar company announced that their balloon – Theanderhead has been staying aloft for 1096 days. This multipurpose mission have encompassed a diverse range of objectives for NASA and U.S. Department of Defense.
This dramatic increase in endurance positions HAPS as a compelling alternative to low-Earth-orbit satellites – offering greater flexibility, lower deployment costs, and easier maintenance.
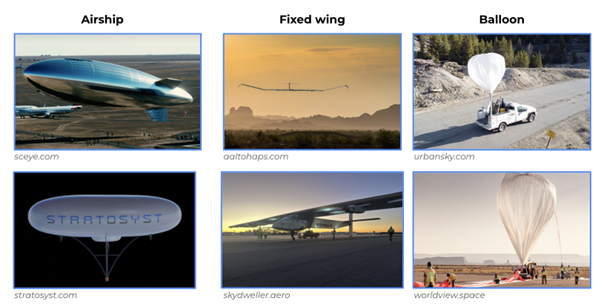
HAPS come in a variety of forms, each designed to meet different operational needs. These include unmanned fixed-wing aircraft, airships, and stratospheric balloons, each with its own strengths, whether it is precise station-keeping, long-term stability, or the ability to carry diverse payloads.
- Fixed-wing HAPS offer precise positioning, higher payload capacity (tens of kilograms), and greater power (hundreds of watts), enabling complex applications for several months.
- Airships can carry the largest payloads (up to 500 kg) and operate for up to a year, though their size increases operational complexity.
- Balloons are lightweight and simple to deploy but have limited power, payload, and positional control.
Filling the gap between drones and satellites
As these platforms continue to mature, HAPS are increasingly filling the gap between drones and satellites in the connectivity and Earth Observation sector, opening a new chapter in the future of monitoring, surveillance, or disaster management applications.
HAPS bridge the gap between the global coverage of satellites and the local precision of lower-altitude platforms.
In this layered network, Low Earth Orbit (LEO) satellites deliver continuous data. When more detailed or persistent coverage is needed, HAPS can be quickly deployed and repositioned – often within 24 to 48 hours – to provide long-duration, extremely high resolution (Figure 1) real-time observation.
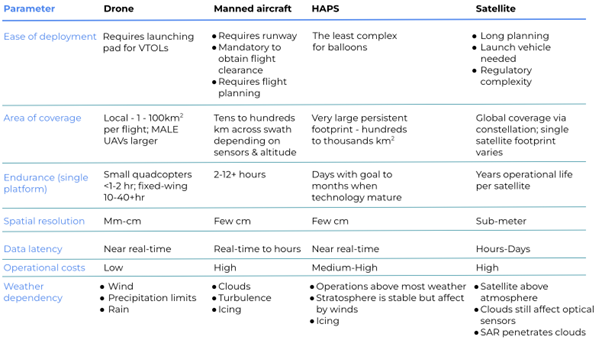
Closer to the ground, drones capture quickly fine-scale, high-resolution imagery or provide local situational awareness, while manned aircraft provide real-time coordination services. Table 1 compares the main parameters of these four complementary data sources.
Table 1. Characteristics of different observation platforms.
HAPS vs satellite image.
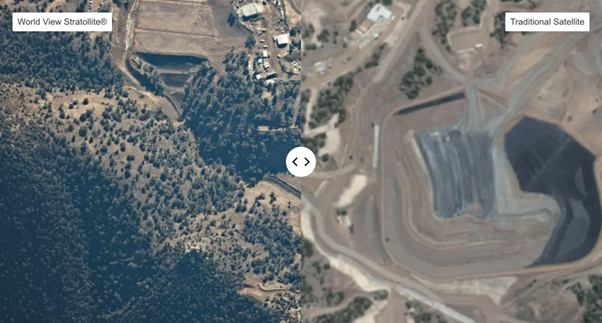
worldview.space/remote-sensing
A market ready for takeoff
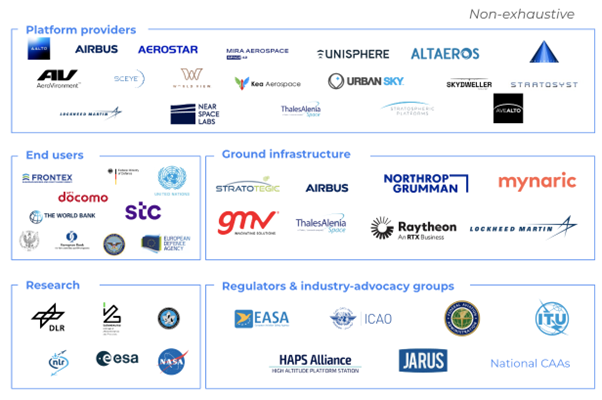
HAPS market is getting crowded – and fast. What used to be a niche area dominated by a handful of aerospace giants has now become a lively mix of established players, new entrants, and cross-industry collaborations. Broadly speaking, there are two main groups of HAPS providers. On one side are the big aerospace and defense companies – names like Airbus (with its subsidiary AALTO HAPS), Thales Alenia Space, Lockheed Martin, and Northrop Grumman – that have expanded their traditional aviation and space portfolios to include stratospheric platforms. On the other side are the new tech-focused startups such as Sceye, World View, Urban Sky, or Mira Aerospace, just to mention few, which are building their entire business models around high-altitude operations.
While many platforms remain in advanced testing and pilot phases, market analysts project that the global HAPS ecosystem could generate approximately EUR 3.5 billion in cumulative value by 2029.
North America, Europe and part of Asia are expected to emerge as one of the leading HAPS deployment regions. Forecasts indicate that up to 1,000 HAPS platforms could be deployed annually in Europe by the end of the decade.
The market expansion is primarily driven by the growing demand for cost-efficient, resilient, and rapidly deployable connectivity and Earth Observation services, particularly in remote, rural, and infrastructure-poor regions. Table 2 provide examples of selected use cases.
| Sector | Connectivity | Earth Observation |
| Disaster Management | Network in disaster-hit areas. | Monitoring of natural disaster evolution (floods, fires, earthquakes) . |
| Safety and Security | Long-range communication for law enforcement. | Persistent surveillance e.g. along borders or large public events. |
| Maritime Awareness | Broadband connectivity to vessels. | Monitor vessel activity, detect illegal fishing, and track oil spills or pollution. |
| Insurance | Support real-time data exchange in remote or disaster-affected regions. | Precise damage evaluation. |
| Transportation | Broadband for intelligent transport systems and connected or autonomous vehicles. | Monitoring of traffic flow, infrastructure conditions, and environmental impacts from above. |
| Agriculture | Persistent rural broadband to connect farms and smart IoT devices. | Crop health, soil moisture, and pest activity monitoring. |
Table 2. Selected use case for connectivity, EO and navigation applications in various sectors.
Major telecommunications operators are increasingly recognises HAPS as the part of their network architectures that complement satellites and terrestrial systems. Recent examples include the 2023 Memorandum of Understanding between AALTO HAPS and Saudi Arabia’s stc Group, aimed at expanding stratospheric connectivity over unserved areas, followed by a similar strategic partnership signed in 2024 with Indonesia’s Mitratel.
At the same time, sustained innovation across aeronautics, advanced materials, energy storage, and data transmission technologies is accelerating HAPS scalability and commercial readiness. Breakthroughs in high-efficiency solar cells, hydrogen fuel cells, payload miniaturisation, and thermal management are making long-endurance stratospheric operations increasingly feasible, sustainable, and cost-effective. Together, these developments position HAPS as a critical enabling layer in the future Earth Observation and connectivity ecosystem.
Governments and private investors are increasingly turning their attention to stratospheric connectivity and observation platforms as a promising extension of the Earth Observation ecosystem. In the United Kingdom, the UK Space Agency has recently committed £20 million (USD 26.1 million) to support a new wave of aerial connectivity projects. The initiative is intended to speed up the development of next-generation telecommunications systems, especially those based on drones and high-altitude platforms that can deliver wireless coverage to regions where ground infrastructure is limited or entirely absent.⁷
Momentum is building in the United States as well. Swift Engineering has received a Phase II award from NASA’s Small Business Innovation Research (SBIR) programme to further develop its Swift Ultra Long Endurance (SULE) platform.⁸ The goal is to demonstrate ultra-efficient, long-duration flight in the stratosphere, paving the way for both commercial and government uses, including persistent Earth observation, communications, and environmental monitoring.
At the same time, private investment is flowing steadily into the sector, reflecting growing confidence in the commercial viability of stratospheric systems. In June 2024, fixed-wing HAPS operator AALTO HAPS secured a USD 100 million funding round, led by a Japanese consortium that includes NTT DOCOMO and Space Compass. Another US-based company, Urban Sky, raised USD 30 million in Series B funding to expand its fleet of reusable stratospheric balloons, designed for imaging and connectivity services.
Alternative platform concepts are also attracting attention. Sceye is developing a stratospheric airship aimed at providing internet connectivity alongside remote sensing capabilities. The company raised USD 50 million in a Series B round in 2021, followed by a Series C round that increased its pre-money valuation to USD 525 million, underlining investor interest in long-endurance stratospheric solutions.⁹ ¹⁰
Stratospheric platforms are gaining particular traction in the defence and security domain. Skydweller Aero, a US–Spanish startup, has attracted investment from major industry players including Leonardo and Palantir Technologies. The company is developing a large, solar-powered, autonomous HAPS aircraft capable of sustained, long-duration flight. Through its partnership with Palantir, Skydweller is integrating advanced target-recognition and data-analysis capabilities for defence applications, and has already secured a USD 5 million contract with the US Navy to continue platform development. To date, the company has raised USD 40 million in venture capital funding.¹¹
Many of these entities are teaming up with telecom operators, sensor manufacturers, and data analytics firms to deliver end-to-end solutions.
Supporting this ecosystem are research institutes, regulators, and advocacy groups like NASA, ESA, EASA, ICAO, and the HAPS Alliance. They’re setting the standards, testing new technologies, and helping shape the rules that will guide safe and scalable HAPS operations. Their work is especially important as companies look to integrate these platforms into regulated airspace and global communication networks.
For now, high technical barriers in areas like aerodynamics, energy storage, and stratospheric weather modeling keep the field from becoming too crowded. But as technology improves and commercial pilots expand, the HAPS market is starting to feel a lot like the early days of the satellite or drone industry — full of promise, collaboration, and healthy competition.
Bibliography
- https://aerostar.com/news#:~:text=Aerostar:%20Three%20Years.,the%20world%20every%20single%20day.
- https://www.esa.int/About_Us/50_years_of_ESA/50_years_of_Earth_Observation
- https://www.eoportal.org/satellite-missions/landsat-1-3#summary
- https://space-solutions.airbus.com/imagery/our-optical-and-radar-satellite-imagery/pleiades-neo/
- https://www.frontex.europa.eu/assets/EUresearchprojects/2023/FX_HAPS_WP1_-_Market_Report_V4.pdf
- https://elib.dlr.de/200789/1/Towards%20the%20Integration%20of%20Higher%20Airspace%20Operations%20in%20the%20European%20ATM%20Network.pdf
- https://www.futuremarketinsights.com/reports/high-altitude-pseudo-satellite-market
- https://www.datacenterdynamics.com/en/news/uk-space-agency-announces-20m-funding-for-aerial-connectivity-projects/#:~:text=It%20will%20improve%20our%20health,Josef%20Aschbacher%2C%20ESA%20Director%20General
- https://uasmagazine.com/articles/nasa-awards-phase-ii-sbir-to-swift-engineering-for-high-altitude-uas
- https://www.telecomreviewamericas.com/articles/satellite-and-broadcasting/from-latin-america-to-saudi-sceyes-haps-funding-secured/
- https://raindefense.ai/2022/06/startups-enter-the-stratosphere-as-haps-market-grows/
- https://raindefense.ai/2022/06/startups-enter-the-stratosphere-as-haps-market-grows/
- https://www.polarismarketresearch.com/industry-analysis/high-altitude-platforms-market

#Deep Tech


Next article

The Planet as a Dataset
Every city leaves a fingerprint on the Earth’s surface. The density of its roads, the geometry of its rooftops, the texture of its parks, the thermal signature of its industrial zones. All of it recorded – in reflected sunlight, in microwave radar pulses that pierce clouds and darkness, in thermal infrared – by a constellation of satellites orbiting a few hundred kilometers overhead. For decades, these signals were interpreted by hand. A GIS analyst would load a satellite scene, apply band combinations, and methodically classify what they saw: urban fabric, agricultural fields, wetland, and bare soil. Rigorous work, but painstaking, expensive, and impossible to scale across the 510 million square kilometres of Earth’s surface.
AlphaEarth changes that.
What is AlphaEarth?
AlphaEarth is Google’s foundation model for Earth observation: a deep neural network trained on petabytes of multi-source satellite imagery to produce a universal, 64-dimensional semantic embedding for any point on Earth’s surface.
The underlying dataset (GOOGLE/SATELLITE_EMBEDDING/V1/ANNUAL) integrates multispectral optical data from Landsat and Sentinel-2 with C-band SAR observations from Sentinel-1, combining long-term historical coverage, higher spatial resolution, and all-weather structural sensing into a unified annual embedding.
From these inputs, AlphaEarth distills a single 64-dimensional vector – a numerical fingerprint – for every 10-metre pixel on Earth, updated annually. Think of it as a coordinate in a latent space where similar-looking places cluster together, regardless of where they are on the globe.
This is the core EO breakthrough: geography becomes geometry. Distance in embedding space becomes a proxy for land-use similarity. You no longer need to classify a pixel as “residential” or “commercial”; you can simply measure how close it is to pixels you already understand.
Case-study: City Similarities Using AlphaEarth
The pipeline used to generate the city similarity analysis follows a straightforward but powerful sequence:
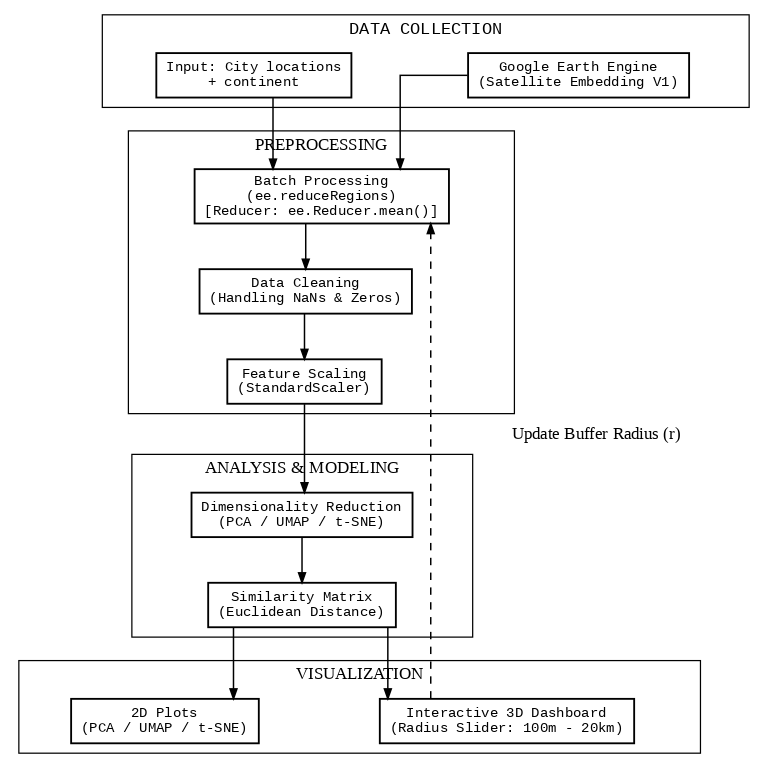
For each city, embeddings are extracted by buffering the city centre by a radius r (tested from 100 m to 20 km) and computing the mean embedding vector across all pixels within that buffer. This single operation – image.reduceRegions() – runs in parallel across all 250+ cities on Google Earth Engine’s infrastructure, replacing what would have taken weeks of local computation.
The resulting matrix is a 253 × 64 array. Each row is a city. Each column is a latent dimension of satellite-derived urban character.
What Does Similarity Actually Mean?
In the embedding space, two cities are “similar” if their satellite footprint looks alike: comparable urban density, vegetation cover, built surface geometry, spectral signature of materials, and structural patterns detectable by radar.
This is not cultural or demographic similarity. It is the similarity that a satellite sees.
Which makes the results both surprising and revealing.
The PCA View
Principal Component Analysis compresses the 64-dimensional embedding space into two (or three) axes that explain the maximum variance across all cities. The resulting scatter plot represents the dominant modes of variation in urban form, derived purely from the learned feature space and independent of geographic coordinates.
The PCA reveals a clear continental separation, but with telling overlaps. Europe and North America cluster tightly together on the right side of PC1, their dense, planned urban fabrics registering as remarkably similar from orbit. Asia spreads broadly across the centre and lower half. Africa occupies the left; dispersed, with significant internal spread suggesting heterogeneous settlement patterns across the continent. South America and Oceania sit between Europe/North America and Africa, gravitating toward the upper-left. The most striking finding is not separation but convergence: European and North American cities are nearly indistinguishable in this embedding space, while Africa’s variance alone spans almost the entire vertical range of the plot.
The PCA explained variance curve reveals something important: the first two components capture only a fraction of the total variance. The embedding space is genuinely high-dimensional. Urban form is complex.
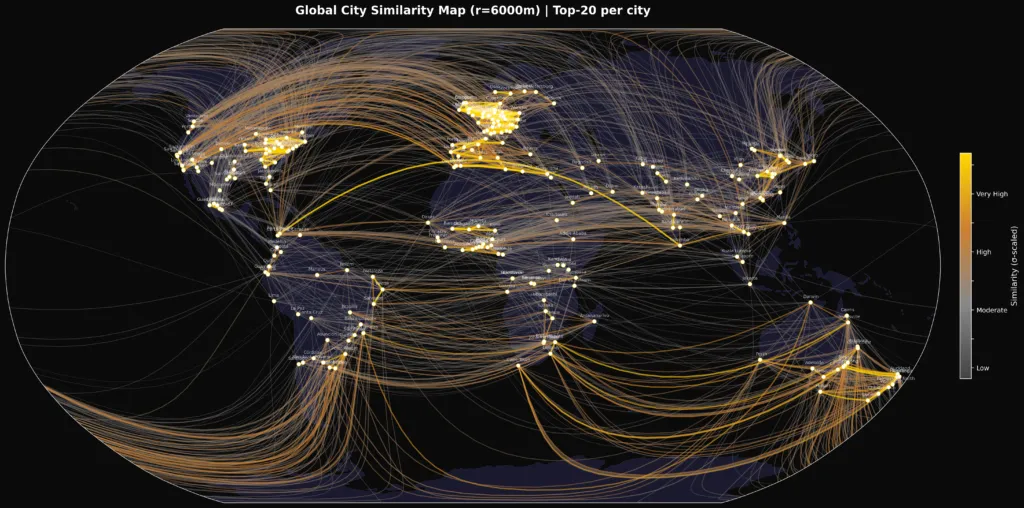
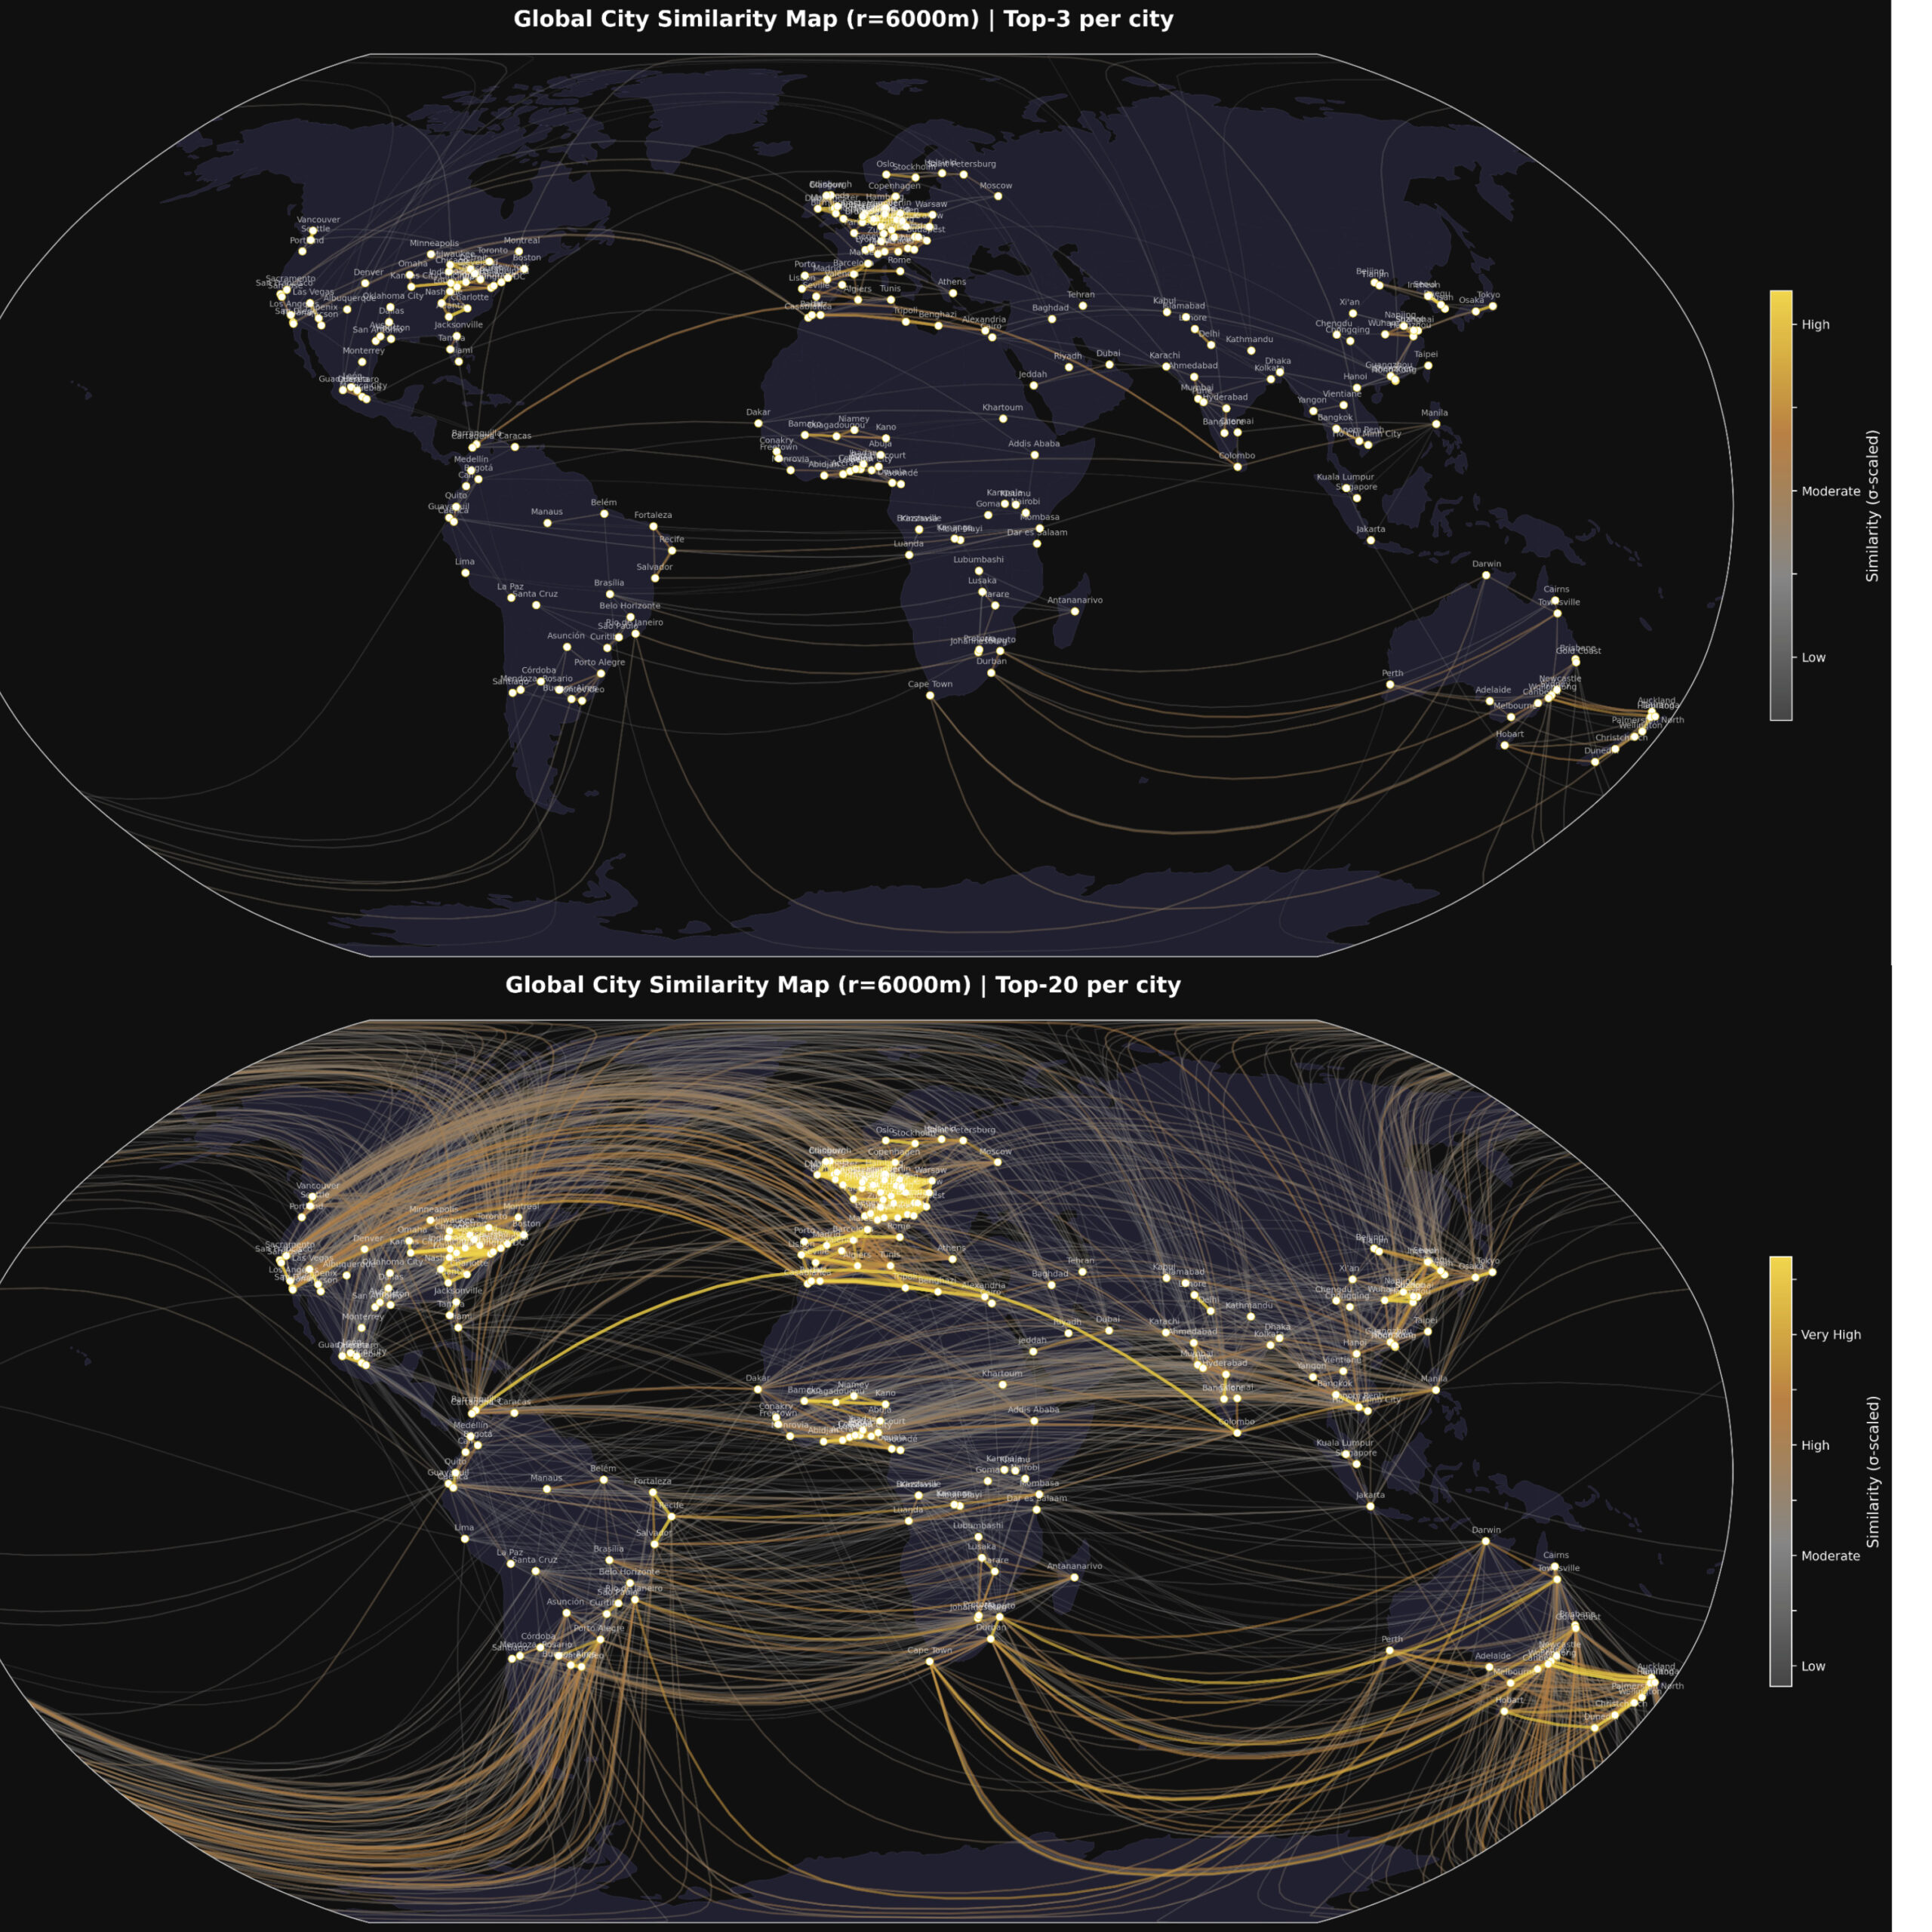
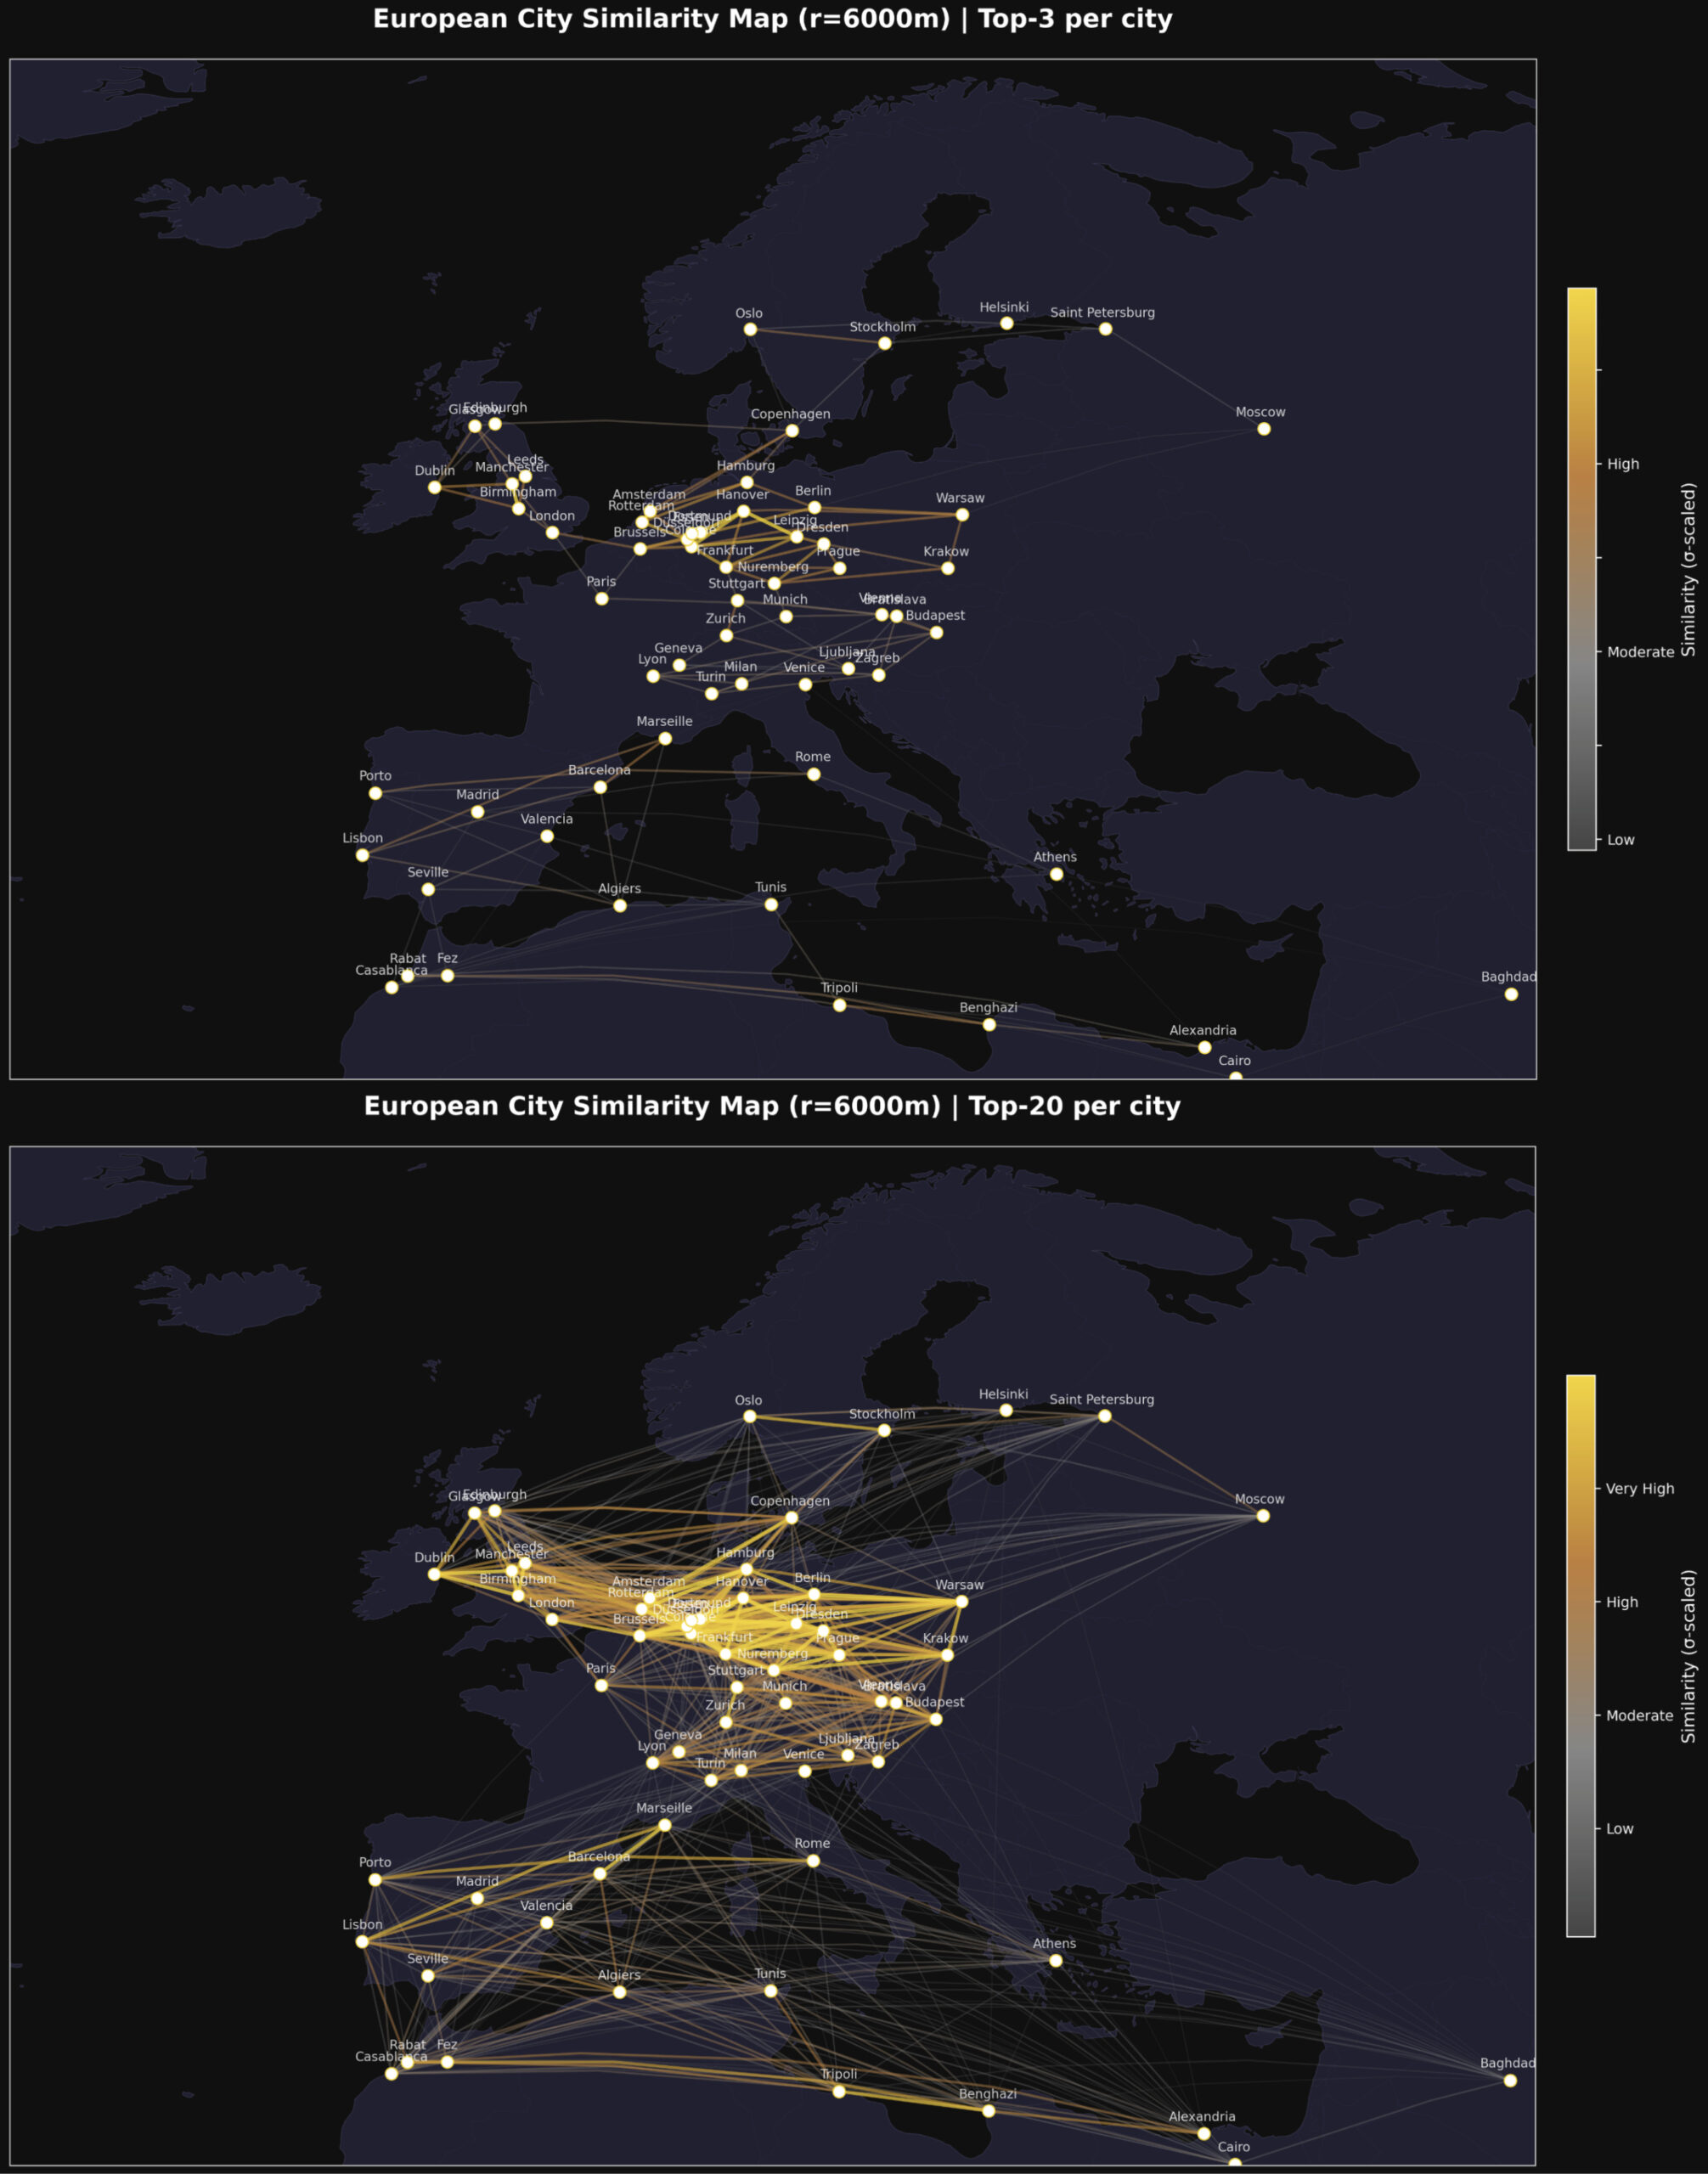
The Connection Maps
The connection maps translate pairwise similarity scores into geodesic lines drawn on a globe. Stronger connections — cities that look more alike from orbit — are rendered in gold. Weaker ones fade to grey.
At r = 6,000 m, a radius that captures the full urban core of most cities, the maps reveal a consistent pattern: European cities connect predominantly to other European cities and to parts of Latin America and East Asia. African cities form tight, internally coherent clusters with notable cross-continental connections to South and Southeast Asian cities sharing similar settlement densities.
The “Top-3 connections per city map” is particularly clean — it shows the skeleton of global urban similarity without visual noise.
“The Paris of…” — Similarity as Cultural Metaphor
One of the oldest clichés in travel writing is the comparative city nickname. Beirut was “the Paris of the Middle East.” Bruges is “the Venice of the North.” Edinburgh is “the Athens of the North.” These labels reflect an intuition that cities can resemble each other across vast distances — that there is something structurally, atmospherically comparable between them.
AlphaEarth lets us test that intuition empirically, from orbit.
The hub map, centred on Paris, with geodesic lines radiating to every other city in the dataset, shows which cities are most similar to Paris in their satellite fingerprint. Lines are colour-coded by similarity strength: grey for distant, bronze for moderate, and gold for the closest matches.
The results are not always what you might expect. The cities that “look like Paris” from space are not necessarily the ones travel writers had in mind. The metric is ruthlessly physical: built surface density, vegetation geometry, and spectral reflectance of urban materials.
That tension — between the cultural intuition and the satellite measurement — is precisely what makes this analysis interesting. Where they agree, it validates the intuition. Where they diverge, it invites new questions: What does it mean for two cities to be similar? And similar to whom: the resident, the visitor, or the satellite?
Why This Matters: Applications in GIS and EO
The city similarity analysis is a demonstration use case, but the underlying capability has significant real-world applications.
Urban change detection at scale. By comparing a city’s embedding at t₀ versus t₁, analysts can flag anomalous shifts in urban character – new development, deforestation, post-disaster damage – without manually reviewing imagery.
Cross-city policy transfer. If City A and City B have similar satellite profiles, interventions that worked in A (flood mitigation, green infrastructure, transport planning) become strong candidates for B. The embedding provides an evidence-based basis for comparison that goes beyond GDP or population statistics.
Training data augmentation. Machine learning models for land-use classification, building footprint extraction, or road detection can use embedding similarity to identify geographically distant but visually similar scenes – expanding effective training sets without additional annotation.
Climate risk stratification. Cities with similar land surface temperature signatures, vegetation indices, and impervious surface fractions face similar urban heat island dynamics. Embeddings can cluster cities by shared climate vulnerability.
Humanitarian response. Identifying settlements with similar structural profiles to areas where ground surveys have been conducted allows rapid inference of conditions – population density, infrastructure quality, informal settlement extent – in unmapped or conflict-affected regions.
The Radius Question
One of the most revealing aspects of the analysis is the sensitivity to the extraction radius r.
At r = 100 m, the embedding captures the immediate block — a single street corner, a park edge, a rooftop cluster. Cities that share a particular microurban typology appear similar, but the signal is noisy.
At r = 1,000 m, the embedding captures a neighbourhood. Patterns of density, green space, and road geometry stabilise. Cross-continental clusters begin to emerge.
At r = 6,000–10,000 m, the embedding captures the urban core. This is where the similarity maps become most geographically coherent, and where the “Paris of…” comparisons carry the most interpretive weight.
At r = 20,000 m, the embedding is averaging over metropolitan regions that may include peri-urban and suburban areas with very different characteristics. Distinctiveness begins to wash out.
The optimal radius depends on the question being asked. For city-centre character analysis, 5–10 km works well. For metropolitan-scale comparison, 15–20 km is more appropriate.
Conclusion
AlphaEarth is not a map. It is a language – a way of describing the Earth’s surface in terms that a machine can reason over, compare, and cluster. The 64-dimensional embedding is a compression of everything that satellites can see: texture, structure, density, reflectance, radar backscatter, and seasonal phenology.
The city similarity analysis is one small demonstration of what becomes possible when that language is applied to a curated set of global urban centres. The connection maps, the PCA clusters, the hub-and-spoke visualisations.
The next time someone calls a city “the Paris of the East,” there is now a way to check.
Analysis performed using Google Earth Engine, AlphaEarth Satellite Embedding V1 (GOOGLE/SATELLITE_EMBEDDING/V1/ANNUAL), and open-source Python tooling (scikit-learn, Plotly, Cartopy). The dataset covers 253 cities across 6 continents, embeddings extracted at r = 6,000 m.
Did you like this post? Check another article on the AlphaEarth foundation.

