Global warming is the most significant environmental problem facing us today, as we experience more and more weather anomalies every year. In long-term perspective it will probably make life harder, not easier, for most of us. This is mainly because we have already built enormous infrastructure based on the climate we now have. People in some temperate zones may benefit from milder winters, more abundant rainfall, and expanding crop production zones. But people in other areas will suffer from increased heat waves, coastal erosion, rising sea level, more erratic rainfall, and droughts.
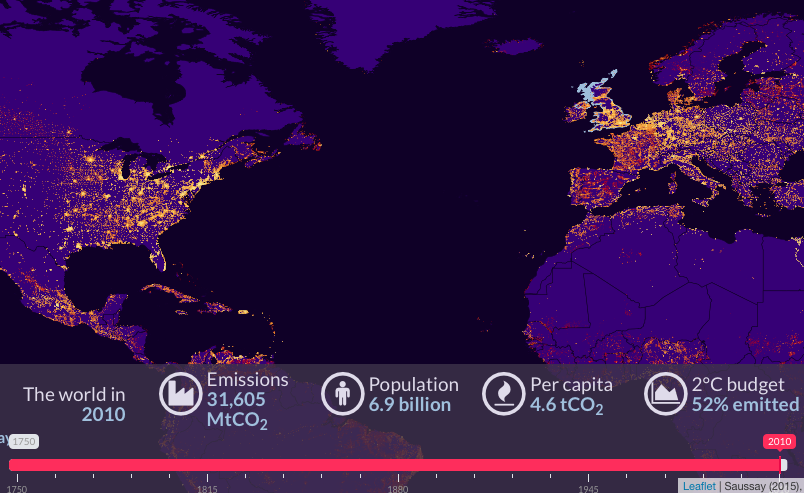
Today we are able to estimate some of the consequences of the global warming for example the rising sea level. But in order to understand and prevent or at least slow down the process we need to look back and understand how has it all started. French economist Aurélien Saussay created the map which might help us to do that.
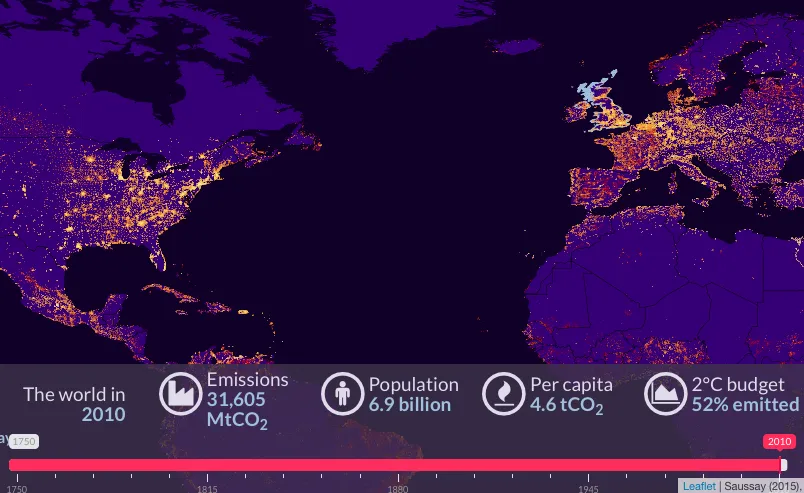
The Global Historical Emissions Map charts global carbon emissions over the course of 260 years. It is based on data from the U.S. Department of Energy’s Carbon Dioxide Information Analysis Center which gathered data about global emissions from fossil-fuel burning, cement production and gas flaring between 1750 and 2010. The dataset is weighted by population distribution over time and represented as a grid.

The map shows historical responsibilities of each region of the world in the total amount of carbon emitted. During the Industrial Revolution, Europe was the carbon hotspot for a close to a century. In 1891 U.S. surpassed the U.K. as Earth’s leading CO2 polluter. Since last decade, China is the leading CO2 polluter.
Cool project.
source: Global Emissions Map, NASA


