#Business #Ideas

Online course of IndoorGML – the standard for navigation inside buildings

Recently we’ve reported that in mid December 2014 Open Geospatial Consortium published IndoorGML a new standard for modelling a spatial data of indoor spaces. As it’s typically with every complicated standard there are only couple of people who actually understand what it is all about. Today you will become one of them.

Accidentally I came across an European funded project called i-locate which is the first implementation of the IndoorGML standard and aims to bring the indoor location technology to European public sector. Fortunately one of project deliverables are openly available online learning materials.

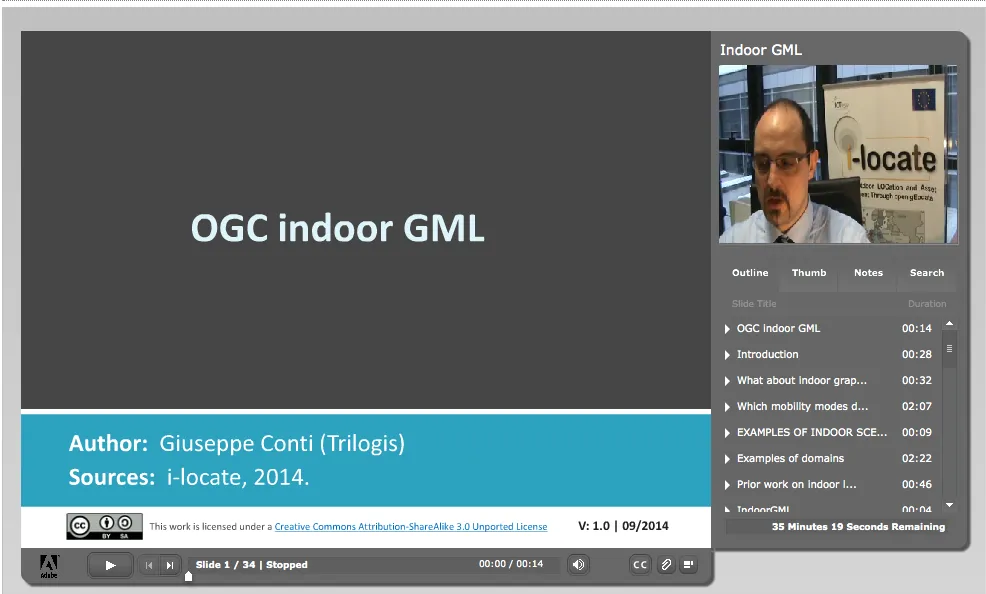
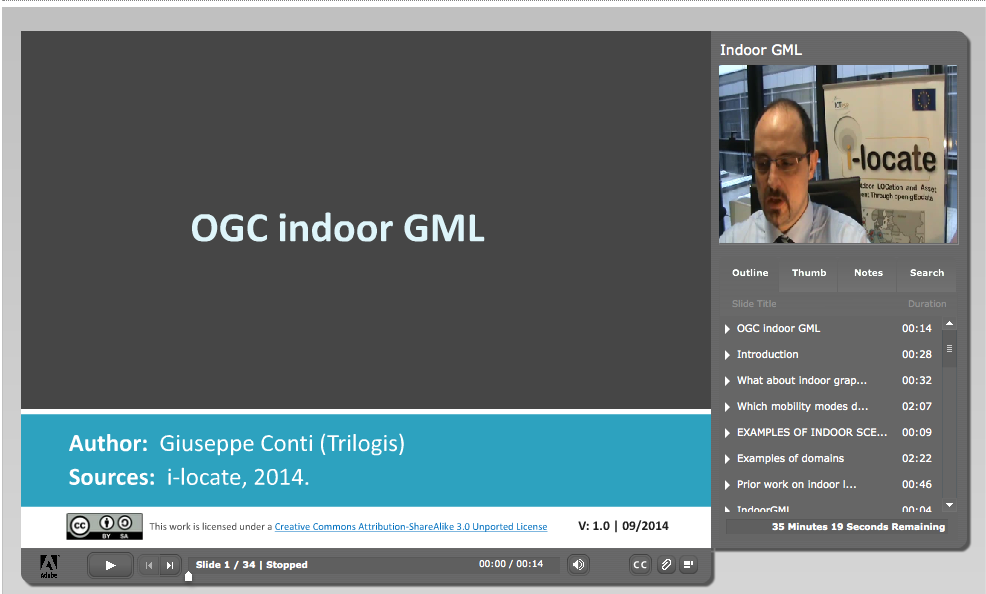
On the project website, under the training section I’ve managed to find the online course of IndoorGML. During less than 1 hour the course will give you all the necessary information about the standard. The only drawback is that need to register on the e-learning platform to access the course.

Zrzut ekranu 2015-02-26 o 23.58.03

Say thanks for this article (0)
The community is supported by:
Become a sponsor
#Business
#Business #Contributing Writers #Fun #People
History of GIS | ESRI – A Pioneer in GIS Technology
Sebastian Walczak & Nikita Marwaha Kraetzig 07.26.2024
AWESOME 1
#Business #GeoDev
3 Pathways For Integrating Planet Data Into Your GIS Workflow
Avatar for Sponsored Article
Sponsored Article 08.12.2024
AWESOME 1
#Business #Featured
Global Top 100 Geospatial Companies – 2024 Edition
Avatar for Muthukumar Kumar
Muthukumar Kumar 01.31.2024
AWESOME 10
Next article
#Ideas

Interactive map of rats in New York

Experts estimates that there are twice as much rats as people in New York city which makes it close to 20 million. It’s a real plague. The city started couple of initiatives to fight it. One of them included sharing the data from city’s 311 hotline on New York City Open Data portal.

We didn’t have to wait long for effects. Meredith Myers – a programmer and data visualizer created a map which shows the last 10,000 rat sightings that have been called into the city’s social services hotline. The map is updated daily but 10k of complains goes back about 6 month (New York received 24,511 complaints about rats last year).

What does the map tell us? You can clearly see that some areas are bright red, with hundreds more reports than nearby neighborhoods. It most likely suggests a simple access to food for rats. This might indicate that people in the area require some additional education about waste management or simply to put poison in rodent tunnels.

The map itself won’t solve the problem but looking at the problem from spatial perspective will definitely help.

Read on
Search