
In today’s fast-paced world, having immediate access to reliable, high-resolution satellite imagery is essential for informed decision-making. Whether it’s for monitoring property boundaries, assessing risks, gathering evidence for legal disputes, or tracking construction progress, clear and up-to-date satellite imagery has become an essential tool for informed decision-making. Recognizing these pressing needs, OnGeo Intelligence offers the innovative Satellite Imagery Report service—a solution designed to simplify access to detailed, high-resolution satellite images for everyone.
Introducing the Satellite Imagery Report Service
The Satellite Imagery Report is a comprehensive service available on OnGeo-Intelligence.com that bridges the gap between advanced geospatial data and everyday applications. It provides immediate access to satellite imagery without the burden of account registration, ensuring that users can quickly obtain the insights they need—anywhere on the globe.
Service Overview and Key Features
The Satellite Imagery Report, branded as OnGeo™ Intelligence, is designed to simplify the acquisition of satellite imagery. Key features include:
- Accessibility Without Registration: Users can order reports without creating accounts, subscriptions, or contracts, making it ideal for one-off needs. This aligns with the service’s goal of bringing geospatial technology to every household, as noted on their website.
- Global Coverage and Resolution: The service covers any location on Earth, utilizing data from a range of satellite constellations, including Sentinel-2, SPOT, Pléiades, Pléiades Neo, WorldView-1, -2, -3, -4, and GeoEye-1. Resolutions range from 0.3 m to 10 m, with the latter sharpened to 2.5 m per pixel using AI, enhancing detail for analysis.
- AI-Enhanced Imagery: The sharpening process, likely leveraging super-resolution AI, improves 10 m resolution images to 2.5 m per pixel, as confirmed by external sources on AI image sharpening techniques. This is particularly useful for detailed land parcel analysis, with additional channels like near-infrared (NIR) and short-wave infrared (SWIR) available for advanced GIS applications.
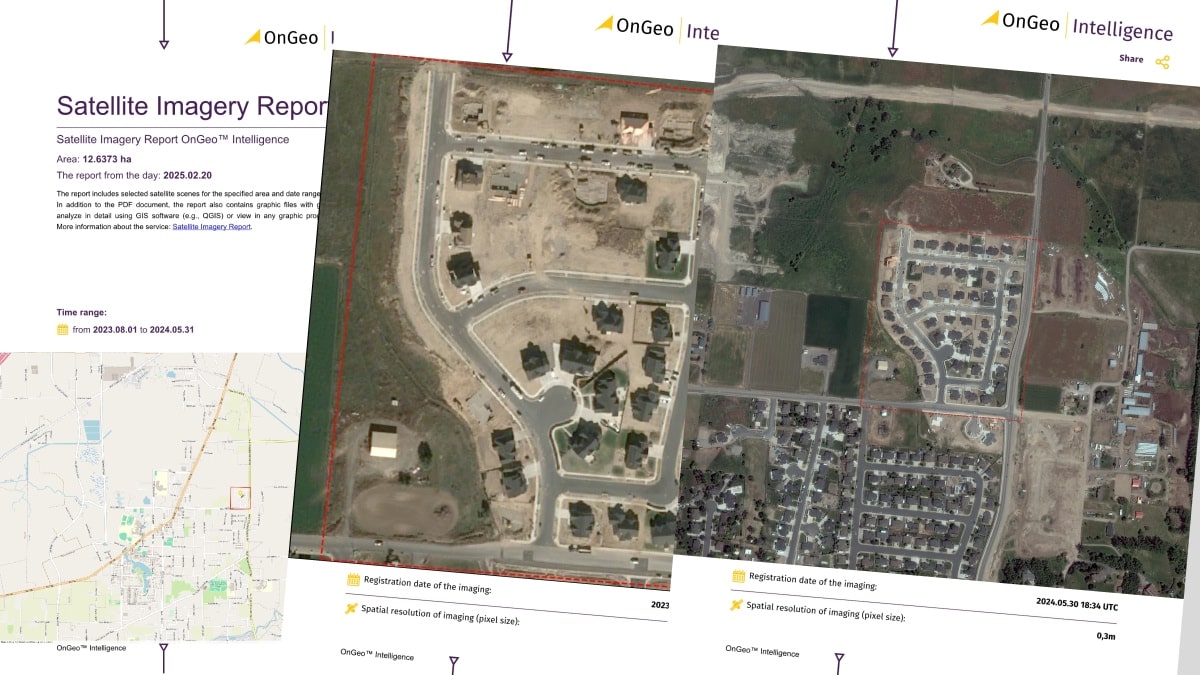
- Delivery Format and Speed: Reports are delivered in a PDF format, including original, cloudless, georeferenced data, AI-sharpened visualizations, and remote sensing indices such as NDVI (Normalized Difference Vegetation Index), NDWI (Normalized Difference Water Index), and NDMI (Normalized Difference Moisture Index), accompanied by charts for monitoring vegetation health, water content, and soil moisture. Delivery times are impressive, with low-resolution scenes available in an average of 5 minutes and high-resolution data within 48 hours.
- Cost and Additional Options: Pricing starts at $12.99 per report, with options to become a member for potential cost savings. The service also offers data packages for download, enabling further analysis by users with GIS capabilities.
For a closer look at the service details, check out our dedicated page on: Satellite Imagery Report.
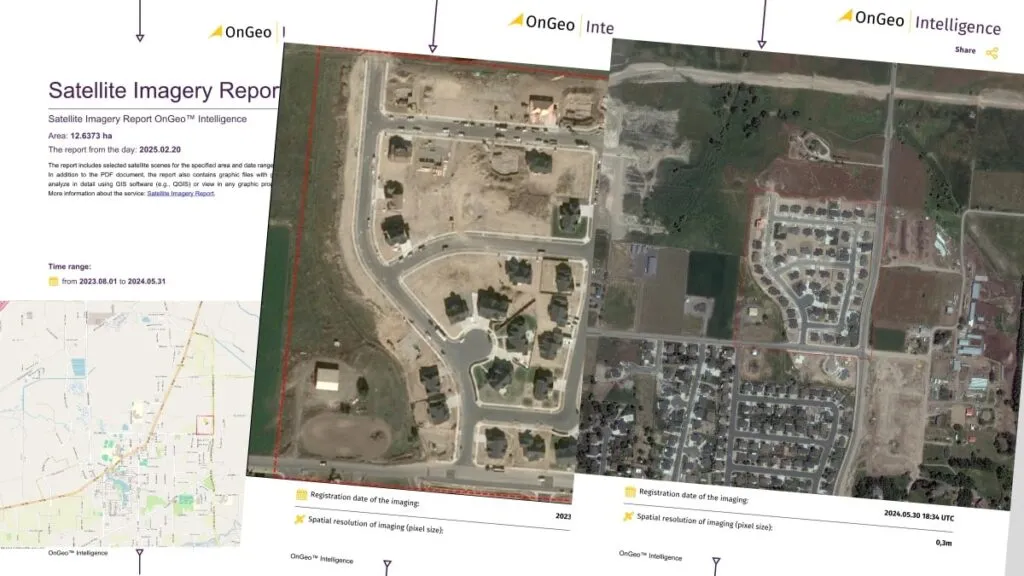
Download a Sample Satellite Imagery Report OnGeo Intelligence.
The following table summarizes the key technical specifications:
| Feature | Details |
| Price | From 12.99 USD per single report |
| Delivery Time | Low-resolution: average 5 minutes; High-resolution: up to 48 hours |
| Content | Original cloudless georeferenced data, AI-sharpened visualization in PDF, remote sensing indices |
| Data Sources | Sentinel-2, SPOT, Pléiades, Pléiades Neo, WorldView-1, -2, -3, -4, GeoEye-1, etc. |
| Resolution | Up to 0.3 m, with 10 m images sharpened to 2.5 m per pixel using AI |
| Use Cases | Property disputes, insurance claims, construction monitoring, environmental observation, legal evidence |
| Process | Select period and location, search archives, order report, receive via email |
| Technology Partners | AI & Machine Learning, Airbus Intelligence, Maxar Technologies, AlterGeo Holding |
A Simple, Intuitive Ordering Process
The process of obtaining your Satellite Imagery Report is designed to be as straightforward as possible. Here’s how it works:
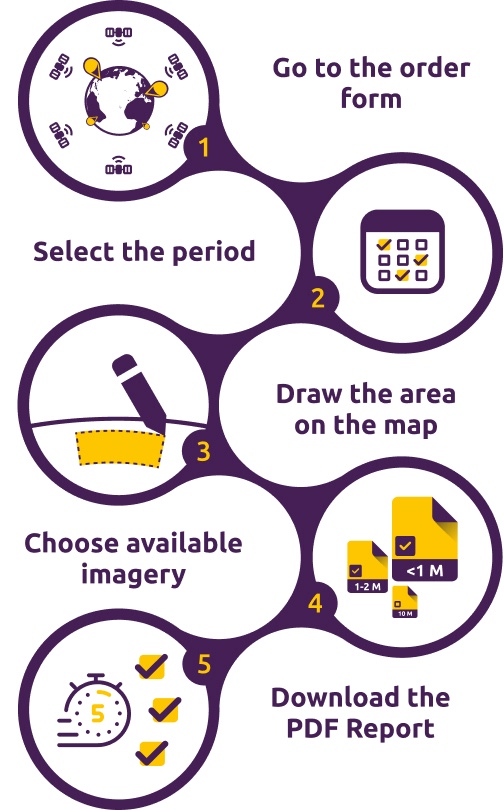
Iconographic showing simple steps needed to order a Satellite Imagery Report.
- Go to the order form: Order Satellite Imagery Report.
- Choose Time Period: Specify the date range, with archives dating back to 2008 for historical analysis.
- Select Location: Users pinpoint the area of interest on an interactive map, ensuring precision.
- Select Resolution: Choose between high-resolution (0.3 m) or enhanced 10 m images, based on need.
- Order the Report: Select from available cloud-free images, with the system searching archives in minutes. Receive the PDF report and data package via email, with low-resolution reports delivered almost instantly and high-resolution within 48 hours.
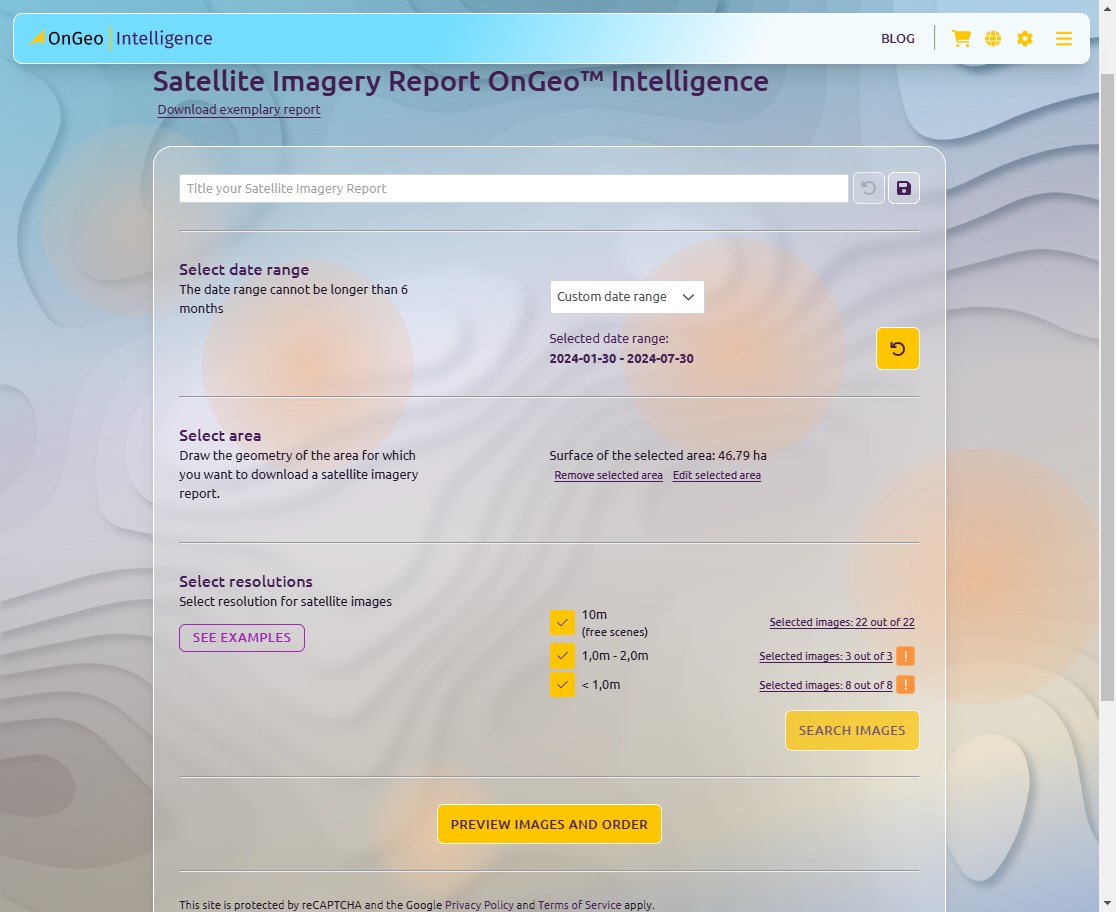
Screenshot of the Satellite Imagery Report order form.
Practical Applications for Everyday Needs
The Satellite Imagery Report isn’t just for experts—it’s a versatile tool that meets the demands of a wide array of practical applications:
- Legal Proceedings:
Utilize high-resolution images as indisputable evidence in property disputes or boundary conflicts. - Real Estate and Property Monitoring:
Keep a close watch on property changes and developments, ensuring accurate records for market assessments or personal oversight. - Insurance Claims:
Access current, precise imagery to support risk evaluations and streamline the claims process. - Environmental Observation: Monitor changes like deforestation, water level fluctuations, or urban expansion, useful for community awareness or personal interest.
- Construction and Investment Projects:
Monitor the progress of construction projects and verify that developments remain on schedule and within scope.
This democratization of access is unexpected for many, as satellite imagery was previously the domain of specialists, but OnGeo-Intelligence’s approach makes it a practical tool for anyone, enhancing decision-making in personal and community contexts.
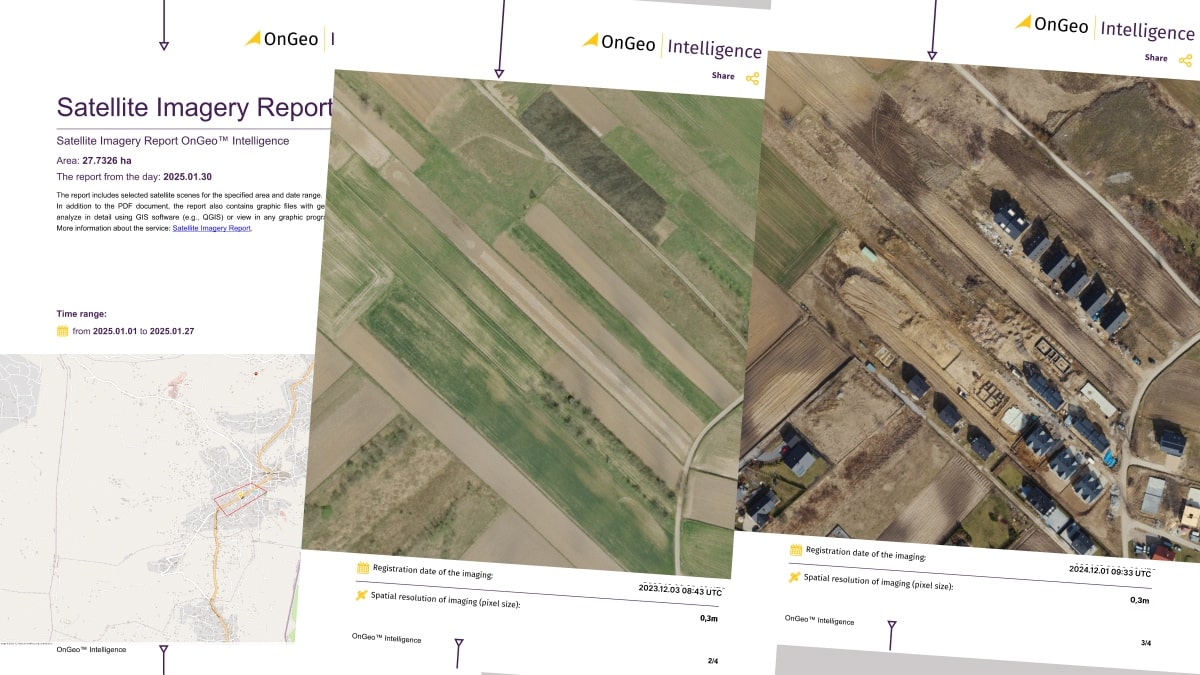
Sample Imagery OnGeo Intelligence.
Client Storytelling: A Home Built Together, and a Map from Space in a Divorce Case
Anna and Thomas, a married couple with a long history, stood in court for a divorce case. The point of contention was the house they had built together. Thomas received the land as a gift from his parents before the marriage. He argued that the house was solely his because it stood on his land. However, Anna claimed that the house was built during the marriage, thanks to their joint financial and work contribution, and that she was entitled to a share of the property.
The case was difficult. Irrefutable evidence was needed as to exactly when the house was built. Memories and bills were not enough. That’s when Anna’s lawyer came up with an idea – the OnGeo Intelligence Satellite Imagery Report.
“We ordered a report for that particular plot,” says Anna. “And what turned out? Archival satellite images clearly showed that at the time of the wedding, there was only a small, unfinished outbuilding on the plot. The house we lived in began to be built only after we got married.”
“The satellite images were key! The court, seeing this evidence, ruled that the house became part of the marital property. I got my due share. It was a difficult time, but the report from OnGeo Intelligence helped me get back what I had worked hard for,” Anna says with relief. Thanks to modern technology, justice was served.
Conclusion
OnGeo Intelligence’s Satellite Imagery Report service is a game-changing solution that addresses the growing demand for rapid, reliable, and easy-to-access satellite imagery. By eliminating registration barriers and providing comprehensive, high-resolution data in an intuitive PDF format, this service is perfectly tailored for both professionals and everyday users alike. Experience the future of satellite imagery and make informed decisions with confidence.
Use the order form and check available satellite imagery for your property
Note: This is a sponsored article by OnGeo Intelligence, published by the Geoawesome Team to provide valuable insights to our readers and the geospatial community. It has been reviewed to ensure it meets our editorial standards for quality and relevance. In case you have any questions or comments, please reach us at info@geoawesome.com


#Insights


Next article
What Are Flow Maps?
Flow maps are a special kind of map that visualize the movement of elements like water, air, or traffic across different areas. For example, in hydrology flow maps illustrate the flow of rivers and ocean currents. This information helps us understand how they behave and interact, providing insights into their dynamics.
How Do Flow Maps Work?
Flow maps combine spatial and temporal data to depict movement across a landscape. They use lines or arrows to yyyindicate direction and flow magnitude, with varying thickness or color representing intensity or volume. Animated flow maps incorporate time-series data to display changes in flow patterns over time, offering a dynamic way to visualize movement.
Creating Animated Flow Maps: A Step-by-Step Guide
- Data Collection: Gather spatial data (e.g., river paths, ocean basins, wind direction) and flow data (e.g., water velocity, discharge rates, wind power) from reliable sources.
- Data Integration: Combine information about location and movement in a GIS to understand the connection between geography and movement.
- Data Visualization: Implement animation techniques. Symbols like arrows or streamlines show the direction and speed of the flow. For animations, the data is sequenced to show changes over time in the flow patterns.
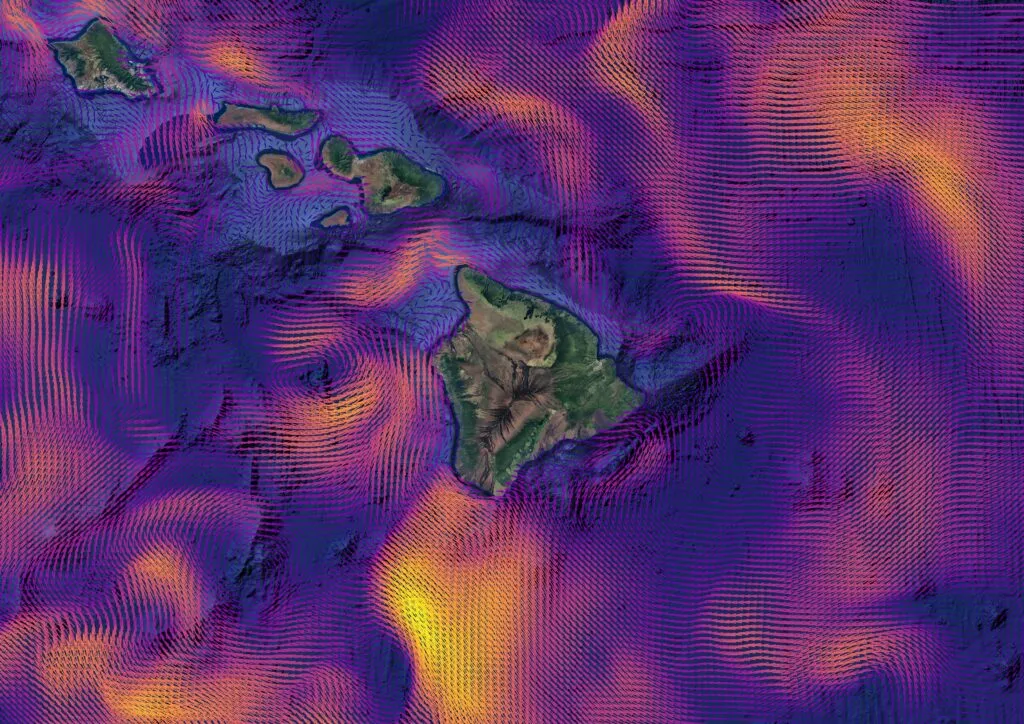
Wind vector map based on mesh, location: Hawaii Islands
Examples of Flow Map Visualizations
Several online resources showcase compelling flow map visualizations:
1. Visualizing the World’s Watersheds
This project uses animated maps to trace water flow from upstream locations to where rivers meet the oceans. It provides a cleardepiction of watershed dynamics, helping users understand how water moves across landscapes.
2. NASA’s Ocean Flow Vignettes
Created by NASA’s Scientific Visualization Studio, these visualizations highlight ocean flows in various regions, such as the US East Coast, central Pacific, and southeast Asia. They demonstrate the complexity of ocean currents and their role in global sea-level changes.
3. Mapping France’s Rivers with Adobe After Effects and GEOlayers
A tutorial demonstrating the creation of animated river maps using GIS data and animation software, providing insights into the mapping process.
4. Windy.com
Windy.com is an interactive platform that visualizes real-time ocean currents, wind patterns, and weather conditions. It allows users to explore global flow dynamics in an intuitive and dynamic way, making it easier to understand complex environmental phenomena.
 |
 |
Windy.com: Wind and Waves Visualizations
Case study: Creating A Simple Animation Using DEM
In this case study, we’ll showcase steps to create a flow on the slope of Mount Etna. This technique can help identify potential sites for massive lava flows or areas susceptible to rapid water surges during heavy rainfall.
1. Data Acquisition
To begin, you’ll need a DEM for your area of interest. One of the best free data sources is OpenTopography. It’s a free, public platform that provides high-quality topographic data, including LiDAR and DEMs, for geospatial analysis and research. You can also get slope and aspect information based on the area you’re interested and download DEMs in formats like GeoTiFF.
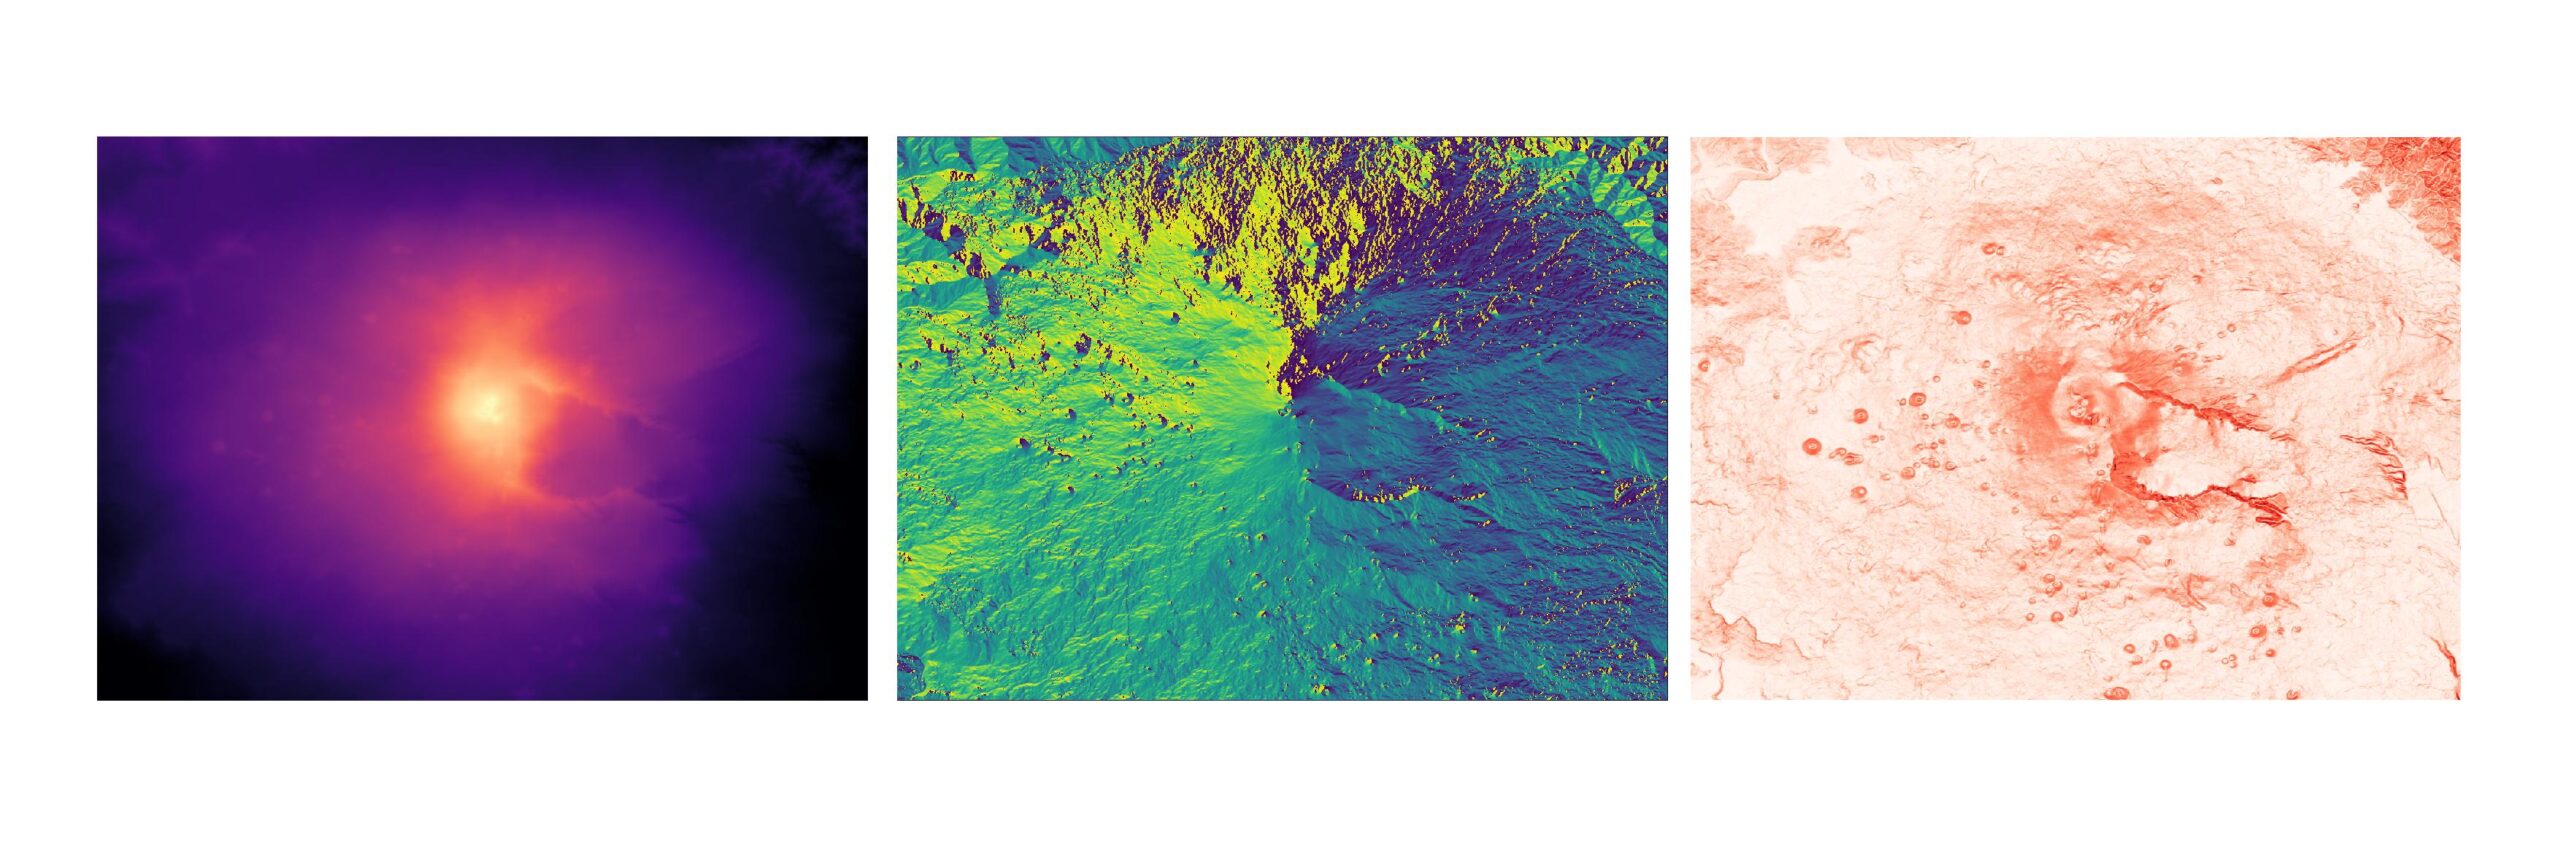
Case study: Height maps vs. Aspect vs. Slope
2. Data Preparation
Once you have your DEM, prepare it for use in a GIS environment. This may involve converting the DEM into a format suitable for your software, such as QGIS or ArcGIS. =
A) Ensure all layers are loaded into the GIS software, such as QGIS
B) (Optionally) If you downloaded only DEM raster, create aspect and slope maps
C) Use the “Raster pixels to points” tool to convert a raster layer (e.g., a height map) to a vector layer.
D) Sample raster values for other raster layers, including aspect and sloper rasters.
3. Visualization Setup
E) Go to the point layer Properties and select the Symbology Choose the graduated style and select slope as the value.
F) Click on the Symbol option and select Font Marker as a Symbol layer type.
G) Adjust the size using the Data defined override. In the expanding list, select Flow type: int, double, string, and choose Slope.
H) Use the Data defined override to adjust the rotation. In the expanding list, select Flow type: int, double, string, and choose Aspect.
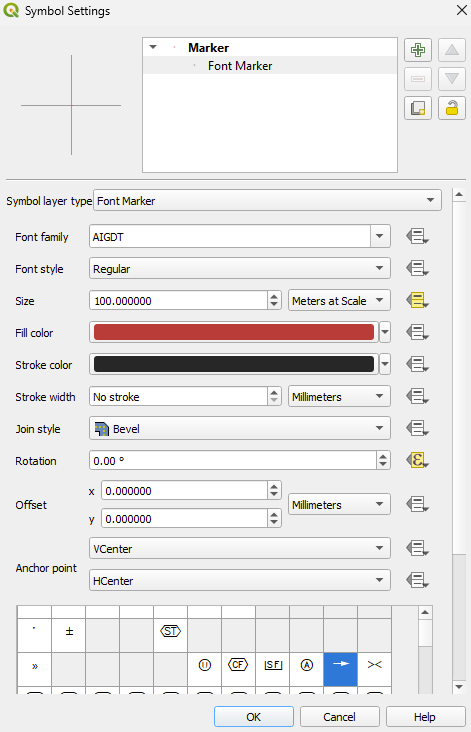
Symbol settings
4. Animation Creation
Almost ready. Divide the points by height. Using on/off layers, starting with the highest layers, you are able to see what the rainwater run-off is.
By following these steps, you can effectively create simple, animated flow maps in QGIS to visualize wind, water, rivers, or ocean currents dynamically.

Case study Visualizing water flow based on DEM
Summary
Flow maps are used to visualize movement across geographic space, such as river currents, ocean flows, traffic, or migration patterns.
They play a key role in understanding trends, and making data-driven decisions in fields, including hydrology, urban planning, and logistics.
Flow maps offer a clear and intuitive way to analyze dynamic processes by representing direction and intensity through arrows or streamlines.
This article was inspired, among others, by open.gis.lab blog. Feel free to read more details on the website.
Do you like this article? Read more and subscribe to our monthly newsletter!

