 The major goal of mobile location-based technology is to help you getting from point A to point B without getting lost but honestly sometimes I love getting lost! Although I’m addicted from location tech travelling and sightseeing with any map and travel guide is best way to discover countries, cities and local cultures. I remember traveling through out half of Spain only with 1:1 mln scale map or walking without knowing where am I along narrow streets of Venice. Yes, getting lost can be very pleasant.
Guys from Broken City Labs, organization from Windsor, Ontario, had the same feeling and they’ve just launched the app called Drift which aims to promote curiosity around locality. The Drift app is a psychogeograpic tool designed for people interested in exploring their surroundings without necessarily needing to have a specific destination in mind.
How it works?
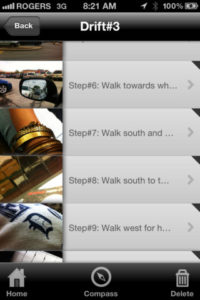 Using it is pretty simple. The app gives you a set of turn-by-turn walking instructions, like “Walk south for two blocks and look for an example of local civic pride and take a picture of it.” After completing that step, the app might tell you to “Walk west for a block and look for something in need of repair and document it.”
For every step, you’re given a specific direction to take and then asked to look for something. Although the app asks to use your location for tracking, the directions given are kept pretty generic and aren’t geographically targeted to specific streets or cities, so you can use it in almost any urban area that’s divided into blocks.
The app has a built-in compass you can use to point you in the right direction, and a camera for taking photos of the objects you’re asked to find. Those photos are then stored in your list of drifts for a complete photographic record of your journey. Drift keeps track of everything you document by geotagging your photos and optionally makes them publicly available for others to view on the Drift website.
Cool idea?
I love this idea. Getting lost in a new place is a great experience, but getting lost is place which you know well is even a better one!!! Currently it’s only available for iOS devices.
source: techvibes


