Measuring Covid19 Impact on Urban Retail
Covid19 lockdown forced retail stores to close in order to avoid contagion. As a direct consequence, many of them did not reopen. Many of them reopened, but will close soon as an effect of the social distancing rules. EIXOS Economic Observatory has developed a model to measure the impact on retail in geographic terms. This model has been combined with an other developed by a research team at Massachusetts Institute of Technology (MIT).
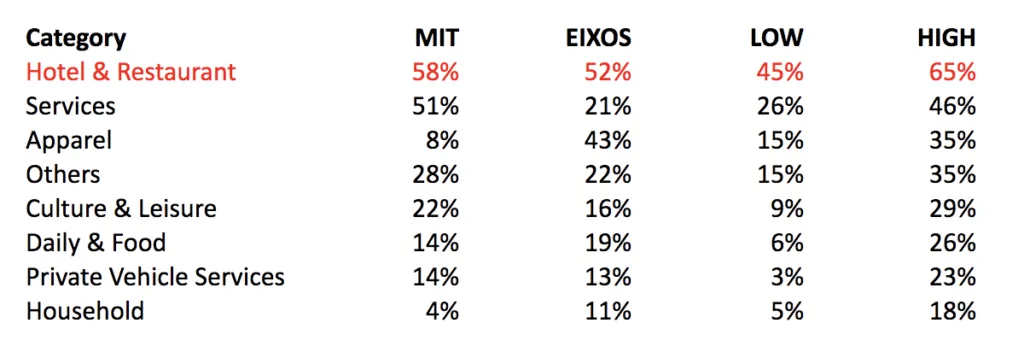
The combined EIXOS / MIT model assigns a specific risk of closure for each economic activity category. It evaluates complementary aspects, such as contagion probability or business financial stress derived from the situation. The MIT & EIXOS values are pondered in order to obtain a final risk value. Then, this value is graduated by an impact coefficient (low, average, high). Finally, the risk is expressed as a percentage of business closures:
Risk of Closure by Category
In order to evaluate the impact of covid19 lockdown & social distancing rules on London retail, all the retail stores in a 500 km2 area were mapped, that includes more than 60,000 retail spaces and 15 boroughs in it, at both sides of Thames.
According to our risk assessment model, the impact on London economic activities will be high, even in the more optimistic hypotheses.
Almost between a third and more than a half of London small businesses could close as a consequence of covid19 impact. From those, hotels & restaurants are the activities that will take the highest loss.
London Urban Model: Retail in a Road in a Garden City
London has a retail infrastructure optimized to cover huge areas of low density housing.
Retail stores align along the main streets, interurban roads. That’s what we call the “retail in a road” alignment.
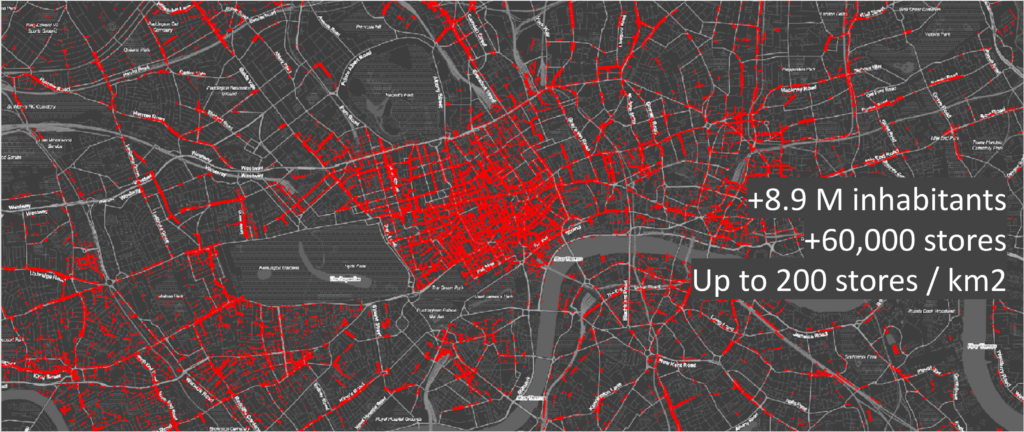
Red dots: retail stores in London
When EIXOS mapped Manhattan, we found up to 700 retail stores / km2. In Barcelona, more than 1,000. In London, with a very different urban model, there are less than 200 retail stores / km2.
The ratio of retail stores per inhabitant also confirms the low density model. In London there are between 1-2 retail stores per 100 inhabitants. In high density retail areas, like Barcelona, there’re between 3-4 retail stores per 100 inhabitants.
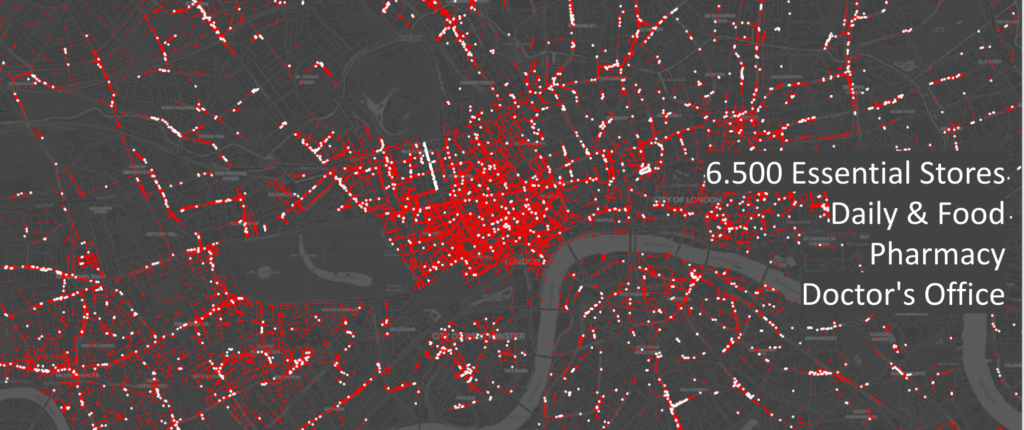
White dots: essential retail stores that opened during the covid19 lockdown.
Occupancy, a key aspect to monitorize retail health, is specially critical in this highly-optimized model.
Less than 90% occupancy scenarios are to avoid. Less than 80% are catastrophic.
London pre-covid19 average retail occupancy is higher than 90%.
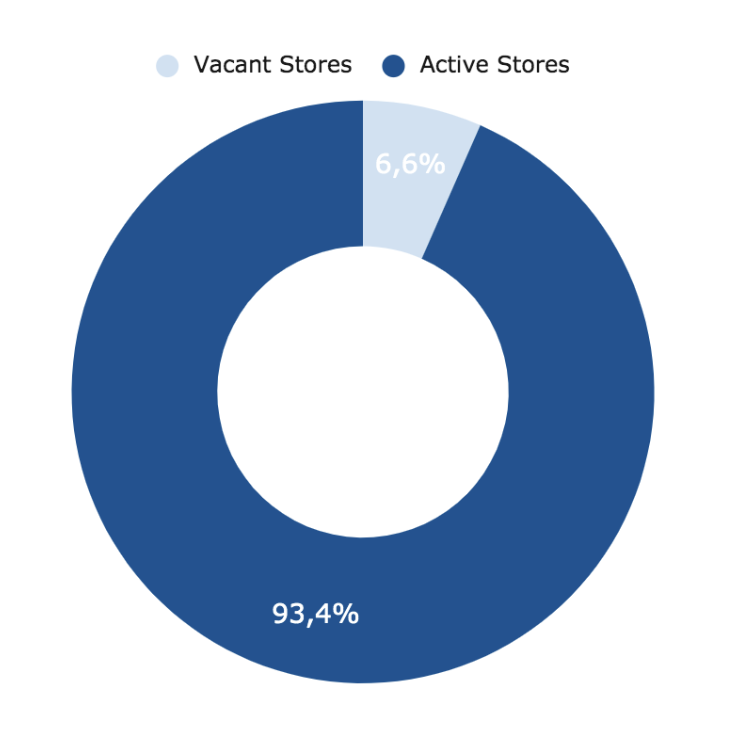
London Retail Occupancy
According to the EIXOS / MIT model, in a low impact hypothesis the average retail occupancy drops down to 70%.
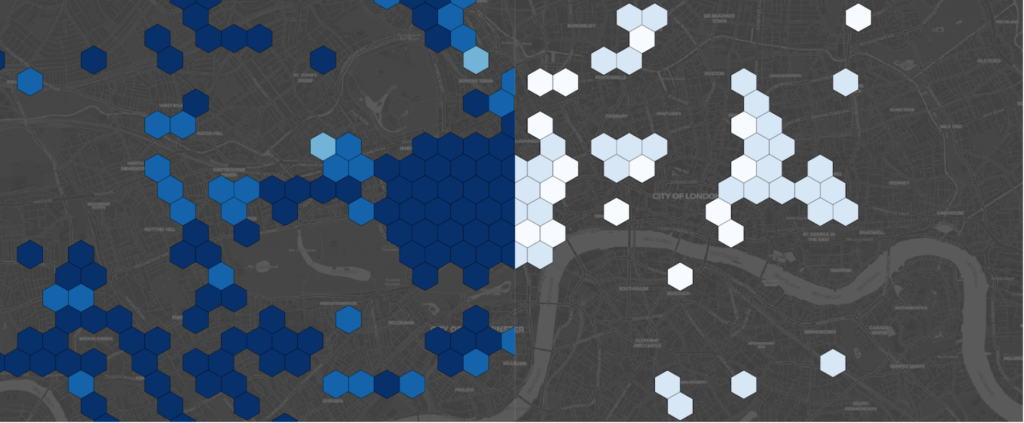
Left: Pre-covid19 Retail Occupancy Right: Post-covid Retail Occupancy The darker the blue, the higher the occupancy.
London Retail Recovery Strategy
Any retail recovery strategy must set the focus on protecting the vital areas. This implies guaranteeing the minimum viable commercial service all over the city.
Such a goal requires a great coordinated effort amongst all the stakeholders that have a key role in retail. Consumers, retailers, real estate agents, landlords, economic development agencies, business improvement districts do have a say in the new retail scenarios to come.
All efforts & resources must be put on preserving the key retail areas that are at risk. Specific 0,33 km2 hexagons identify those areas in a very precise way. In our full version report we provide a very accurate map of them.
We also propose a radical recovery strategy, based on regrouping the stores in order to hold the lines. It is what we call Retail Grid Optimization.
Basically, it consists of recombining the existing retail stores. The goal is to find the most optimal combination, in terms of commercial service to the city.
It could sound like a crazy solution, for it implies a lot of combined efforts. However, post-covid19 scenario will make it a reasonable one.
Related articles:
Covid19 Impact on Barcelona Retail
COVID-19 Impact on Manhattan Retail
Geomob video-conference: Covid19 impact on Manhattan & Barcelona
Bilbao: business location opportunity detection service.
Proceedings of the National Academy of Sciences of the United States of America: Rationing social contact during the COVID-19 pandemic: Transmission risk and social benefits of US locations
MIT News: “Which businesses should be open?”
