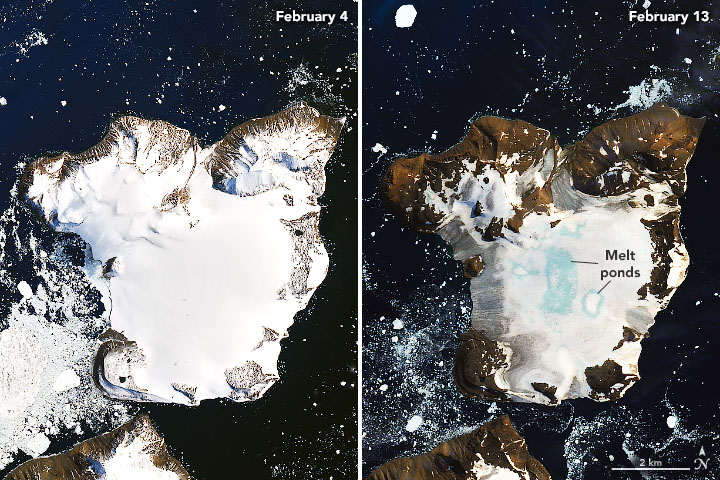
Antarctica may be the coldest place on Earth, but the continent has just witnessed the hottest temperature on record. On February 6, 2020, thermometers at a research station in Antarctica shot up to 18.4°C, beating the previous record of 17.5°C which was set on March 24, 2015. The warm winds, that arrived on Feb 5 and continued till Feb 13, resulted in widespread melting on nearby glaciers. So much so, an Antarctic island which was covered in snow until Feb 4 lost about 20% of its seasonal snow accumulation in just nine days.

NASA’s Earth Observatory has released the above images captured by Landsat 8 on Feb 4 and Feb 13. The side-by-side comparison clearly shows the melting on the ice cap of Eagle Island, a small island off Antarctica’s northwest tip. According to climate models, Eagle Island lost about 4 inches of snow in one week, leading to pools of meltwater opening up on its surface.
Glaciologist Mauri Pelto was shocked to see such rapid melting. “I haven’t seen melt ponds develop this quickly in Antarctica. You see these kinds of melt events in Alaska and Greenland, but not usually in Antarctica,” says Pelto, who has been a professor of environmental science at Massachusetts’ Nichols College and the director of the North Cascades Glacier Climate Project for more than 25 years.
Related: Is climate change responsible for heatwaves and wildfires?
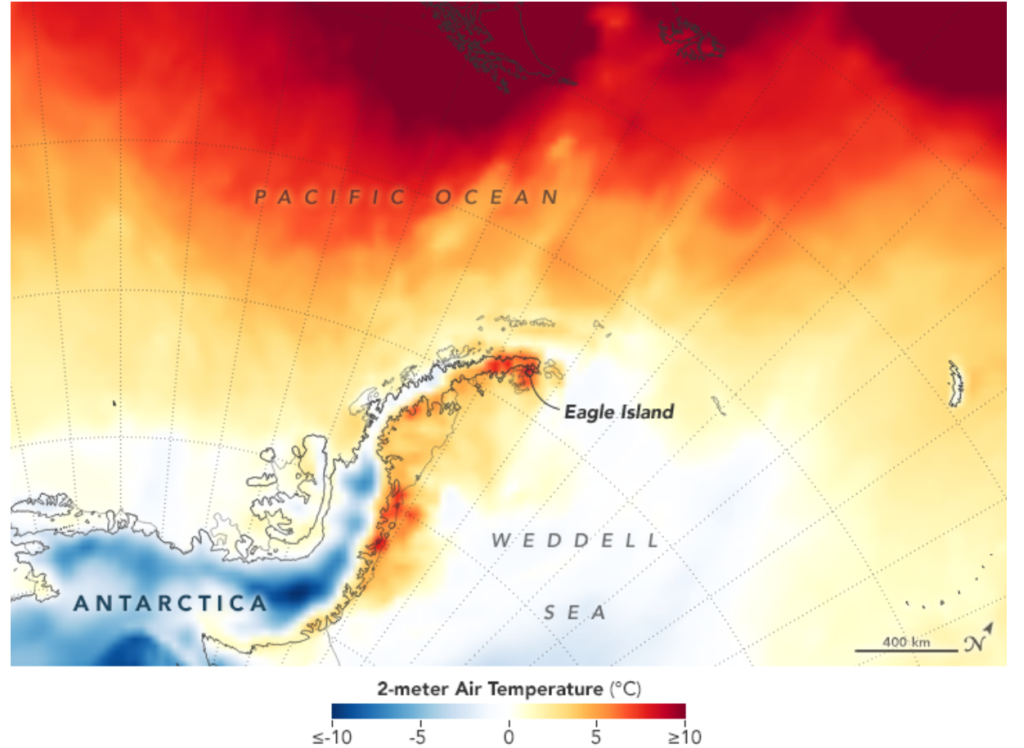
According to NASA, the heat wave was caused by a combination of meteorological elements. High pressure centered over Chile’s Cape Horn at the beginning of February allowed warm temperatures to build. Typically, a band of strong winds that circle the continent – the Southern Hemisphere westerlies – would have shielded the continent. But with the westerlies in a weakened state, the extra-tropical warm air could reach the ice sheet.

In the map above, you can see temperatures across the Antarctic Peninsula on February 9, 2020. The map was created using the Goddard Earth Observing System (GEOS) model, and showcases air temperatures at 2 meters above the ground. The darkest red areas are where the temperatures have crossed 10°C.
As NASA points out, the February heatwave was the third major melt event of the 2019-2020 summer, following warm spells in November 2019 and January 2020. “If you think about this one event in February, it isn’t that significant,” Pelto explains. “It’s more significant that these events are coming more frequently.”


 US Army Corps of Engineers: Cartographic Technician
 Bureau of Land Management: MLRS GIS Team Lead
 Tucson Electric Power: T&D Application Analyst (GIS Support)
 Amazon: Sr. Real Estate Research Manager
 Cesium: Software Project Manager
 GE Renewable Energy: Project Management Specialist