The human fingerprint in dramatic freshwater depletion around the world
“Holy cow, this is garbage!” That’s the reaction scientists gave back in 2002, when they first saw the data being sent by NASA’s just-launched Gravity Recovery and Climate Experiment (GRACE) mission – which was tasked to track freshwater in 34 regions around the world.
However, after a couple of years of solid data cleanup and processing, global trends started to reveal themselves: Ice sheet depletion of Greenland and Antarctica, frightening dip in the groundwater table in North India, the effect of El Niño and La Niña on sea levels… GRACE faithfully watched the Earth for 14 years, till its mission ended in October 2017, and armed the researchers with a trove of valuable data.

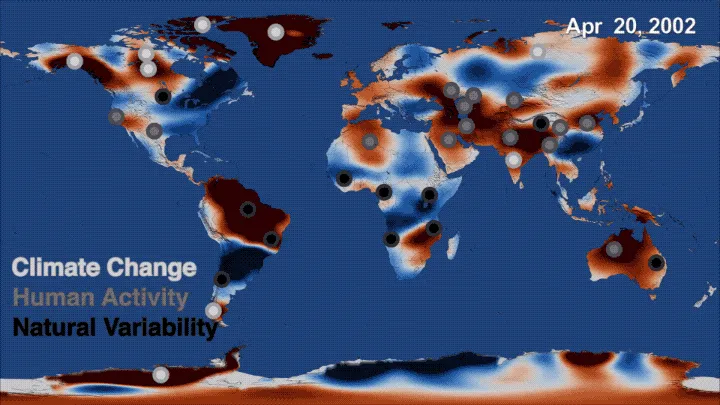
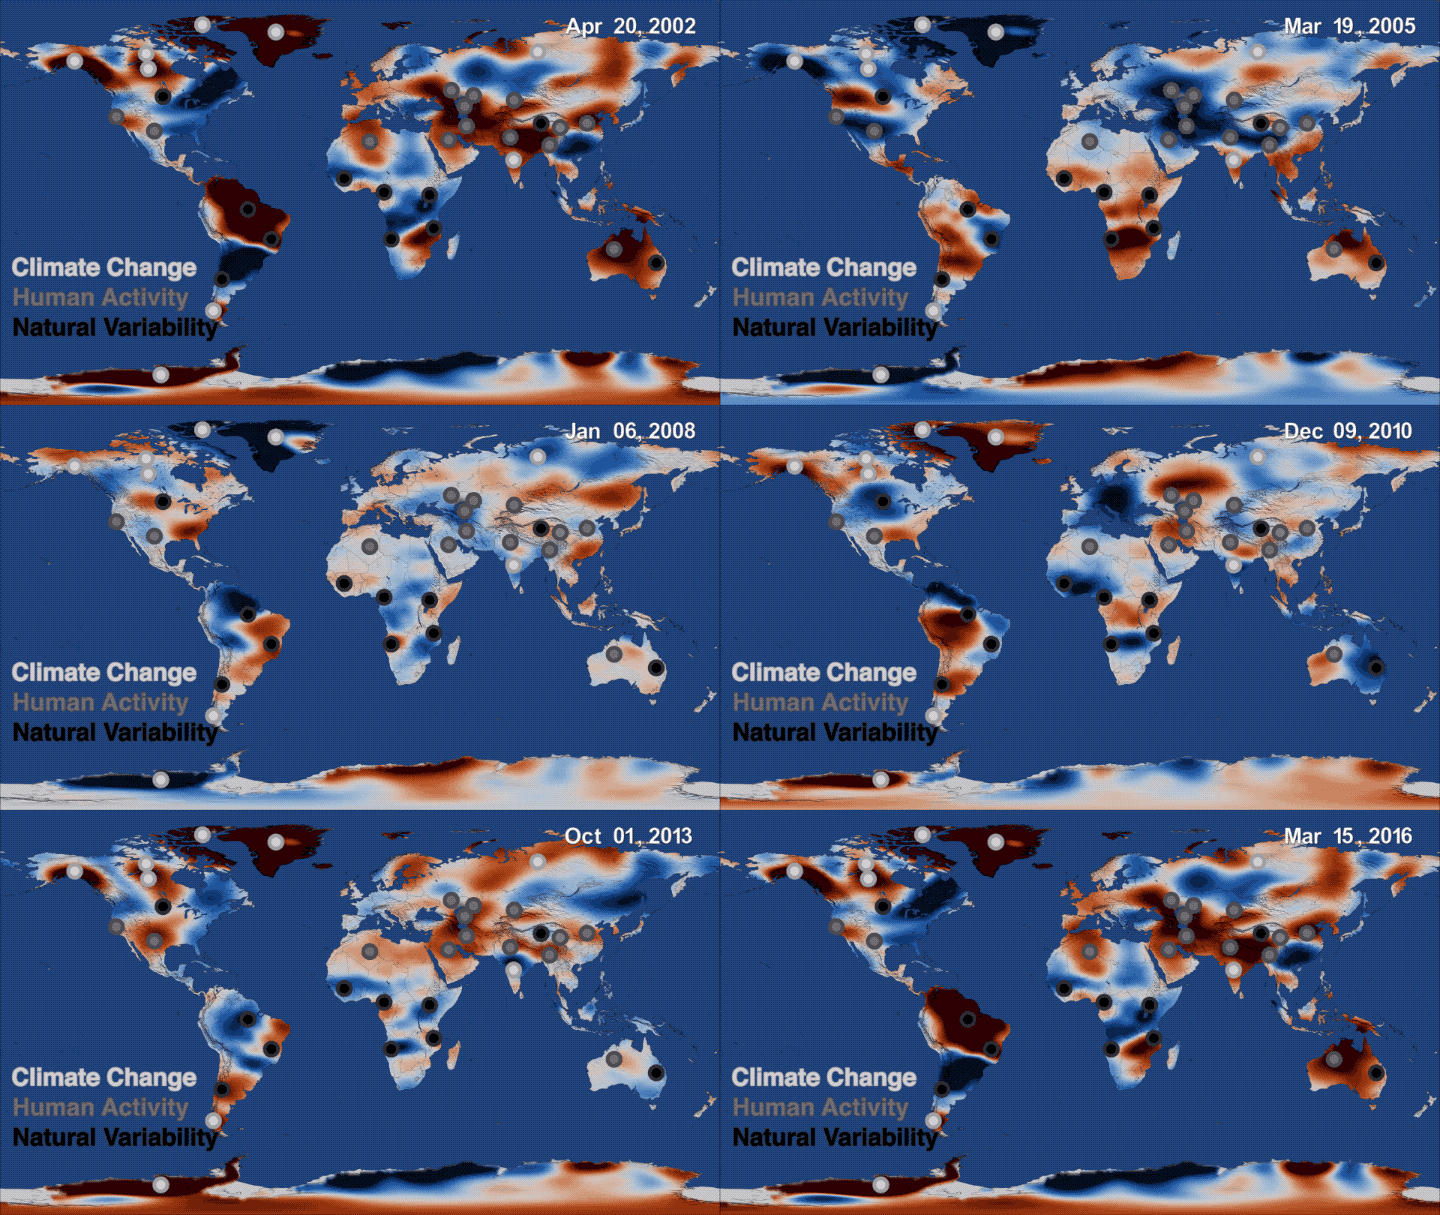
This map depicts a time series of data collected by NASA’s Gravity Recovery and Climate Experiment (GRACE) mission from 2002 to 2016, showing where freshwater storage was higher (blue) or lower (red) than the average for the 14-year study period. Courtesy: NASA
But, the question remained: What was causing these apparent trends?
This made NASA undertake a first-of-its-kind study that would combine GRACE’s data with global precipitation, satellite imagery, irrigation maps, and published reports of human activities related to agriculture, mining and reservoir operations.
Shocking redistribution of water
The results of this study, published earlier this month, concluded that Earth’s wetland areas are getting wetter and dry areas are getting drier because of overuse of water resources by humans, climate change, and natural cycles.
According to Jay Famiglietti, co-author of the research and senior water scientist at NASA’s Jet Propulsion Laboratory, “The human fingerprint is all over changing freshwater availability. We see it in large-scale overuse of groundwater. We see it as a driver of climate change. The study shows that humans have really drastically altered the global water landscape in a very profound way.”
For example, the depletion of freshwater in Saudi Arabia can be attributed to agricultural pressures. The region lost 6.1 gigatons per year of stored groundwater between 2002 and 2016 – a period of explosive growth of irrigated land confirmed by Landsat images.
Similarly, the likely cause of California’s groundwater depletion from 2007 to 2015 is the decreased groundwater replenishment from rain and snowfall combined with increased pumping for agriculture.
Why is this important?
Alarming groundwater decline in farming regions of the world is especially disturbing because it can lead to global food shortages. The study brings to the fore the daunting water-management decisions many nations will need to take in the near future, coupled with a comprehensive water conservation strategy.
NASA hopes that the GRACE data will provide “motivation for multilateral cooperation among nations, states and stakeholders, including the development of transboundary water-sharing agreements, to balance competing demands and defuse potential conflict.”
The mission continues
Now, that the GRACE mission has completed its lifecycle, it will be replaced by a Follow-On (GRACE-FO) mission so that NASA can continue to monitor changes in the world’s water cycle and surface mass. GRACE-FO was launched in May 22 from Vandenberg Air Force Base in Central California as payload on a SpaceX’s Falcon 9 rocket. When the mission begins after an 85-day, in-orbit checkout phase, it will provide data that will allow scientists to better distinguish short-term variability from longer-term climate change trends.


