#Business #GeoDev #Ideas #Science

Monitoring global ship traffic

Since ever oceans have been important for people as a means of transport. The containerization counts as greatest transportation revolution in the 20th century and boosted the marine cargo traffic. Today, around 80 percent of the global trade by volume and over 70 percent of the global trade by value are carried by ships (United Nations conference on Trade and Development). The implication is that dozens of thousands of ships cruise around the oceans and even rivers each day. With such great traffic it became important to track the ship movements in order to prevent from collisions, environmental damage and keep an overview of the maritime traffic situation.

The automatic identification system (AIS) is an automated tracking system on board of ships providing information such as a unique identification of the ship, position, course and speed allowing authorities to track and monitor vessel movements. It is also used for collision avoidance supplementing the marine radar. According to the International Convention for the Safety of Life at Sea (International Maritime Organization) all international voyaging ships with a gross tonnage of over 300 and all passenger ships regardless their size must be equipped by a AIS (Wikipeadia).

Public ship tracking platform

Just a few years ago, only ship owners, managers and authorities were capable of tracking AIS signals of vessels on their long voyages across the seas. It was research collaboration among global academics and development of existing Information & Communication Technology (ICT) that enabled the creation of improved tracking services available to a wider public, realized by the platform Marine Traffic.

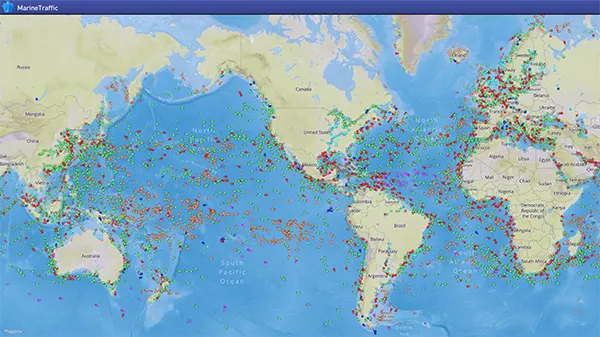
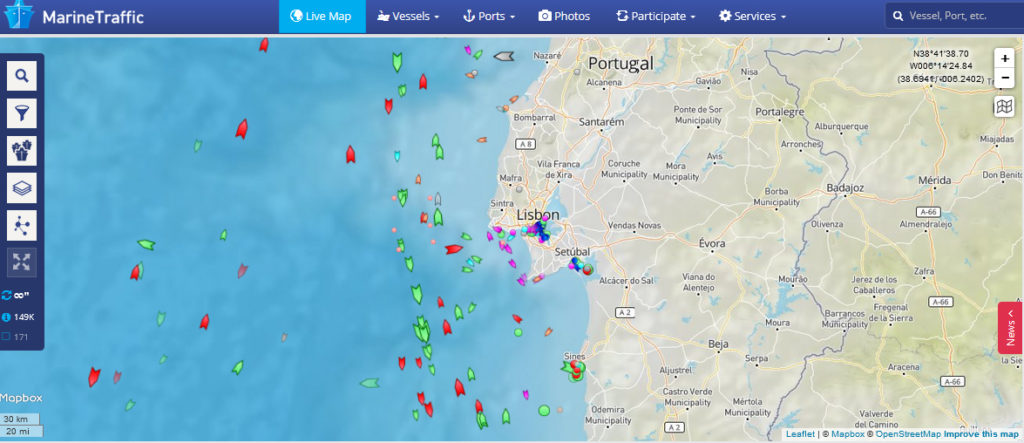
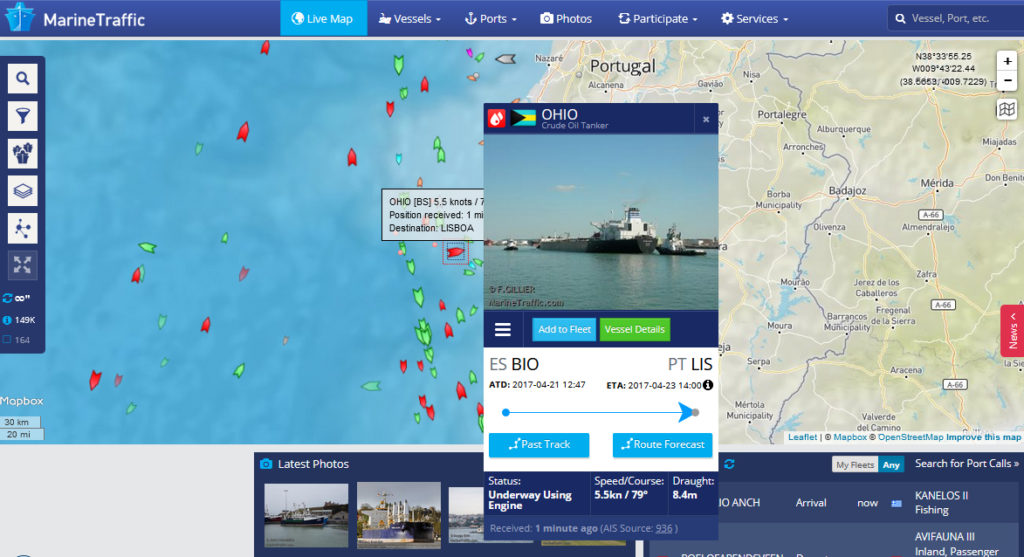
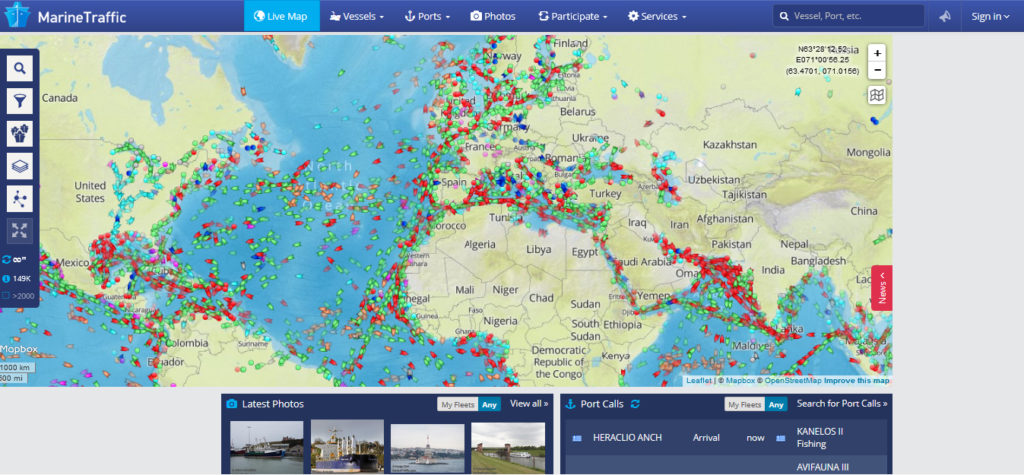
MarineTraffic is an open, community-based project, which provides real-time information on the movements of ships and current location of ships in harbours and ports. Its core part presents a map (Google Maps, Nautical Charts and Open Street Maps) indicating real time vessel information based on AIS signals. The map shows all globally tracked vessels, indicated by the ship icons. The colour of each icon refers to a different kind of ship (e.g. passenger ship, container Ship, cruid oil tanker, etc.). Clicking on a ship icon a window opens showing information about the corresponding ship such as its origin and destination (including the planned arrival time), speed, draught, the past track, a track forecast and mostly an image of the ship. Clicking on the vessel’s “details link” all ship details as stored in the vessel database are revealed. This basic marine traffic service can be used without cost. More advanced functions such as a detailed voyage info are only provided on cost. This includes particular data services such as historical vessel tracks, vessel positions, affiliation to a certain fleet, different AIP services and more. MarineTraffic was originally developed as an academic project at the University of the Aegean in Ermoupoli, Greece. For more information consult the website.

The function to download a vessel’s track as kml file was stopped in 2015 (reported on geoawesomeness in 2013).

For me www.marinetraffic.com constitutes a website where I can spent more time than I would like. The provision of information to the public is important to keep marine movements transparent.
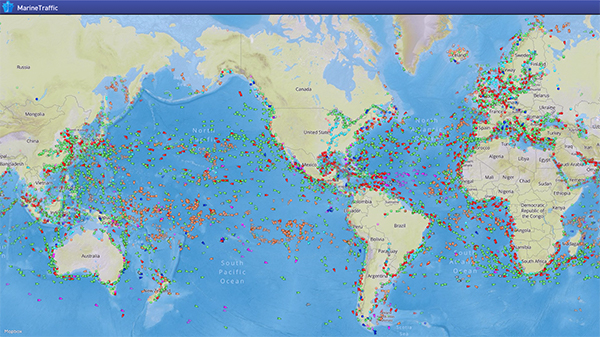
Global map overview of the marine ship traffic (Source: Marine Traffic Blog).
Map overview of Europe, Africa, the Atlantic and North/Central America (Marine Traffic).

Each ship icon can be clicked obtaining detailed information on the ship voyage. the colour of the icon refers to the kind of ship (e.g. passanger, cuide oil tanker, etc.).

The detailed information shows origin and destination of a ship, the current speed, draught, past track, track forecast and mostly an image of the ship if available in the database.

Say thanks for this article (0)
The community is supported by:
Become a sponsor
#Business
#Business #Events
SatSummit 2024 Reflections: The evolving landscape of Earth Observation
Avatar for Florian Fichtner
Florian Fichtner 05.22.2024
AWESOME 9
#Business #Featured
The Earth Observation Hub Report: 2024 Industry Trends and Analysis
Avatar for Muthukumar Kumar
Muthukumar Kumar 03.13.2024
AWESOME 4
#Business #Ideas
Urban Digital Twins in China: A Smart Gadget or a Decision Support Tool?
Nianhua Liu 03.28.2024
AWESOME 4
Next article
#GeoDev

Top 5 most interesting Esri DevSummit videos

The most recent Esri DevSummit took place from March 7-10 in Palm Springs. The DevSummit in general is geared at web developers who work with Esri technology and offers an overview of the most recent Esri technology. For those who couldn´t visit the event, Esri published a number of videos from the plenary session on its own website, while a playlist of 163 videos can be found on YouTube. Here are five great videos that caught my interest:

1. Getting Data Science with R and ArcGIS


Data science is a hot topic. This video discusses Esri´s involvement in the R community and support for R in the ArcGIS platform. If you want to know more about what R is and how it can enhance geospatial workflows, this is a great resource. It also compares the SciPy stack with R, features various demos on how to get started with the ArcGIS-R bridge and resources for writing custom R script tools.

2. Scientific Programming with the SciPy Stack


More data science, this time covering the Python programming language. A video dedicated exclusively to the SciPy stack and how it extends the ArcGIS platform. Features demos on NumPy, pandas, matplotlib, SymPy and SciPy, which is a separate package within the SciPy stack as a whole. After watching this video you will know what each package does and where to look for it. If you´re new to this stack, you´ll find a lot of resources on how to get started at the end of the video.

3. Git/GitHub for Geographers


Geographers and GIS analysts looking for an entry point to the world of Github don´t need to look any further as this video explains all about cloning, forking, branching, version control and much more.

4. JavaScript for Geographers


Another great introductory session for geographers, this time on JavaScript. Starting to learn JavaScript in 2017 can be intimidating as there are many tools out there to use. This video shows how to start from zero and get up to speed. Covers the language fundamentals, how build web apps with JS and the ArcGIS JavaScript API. Also available is a video called CSS for Geographers.

5. Choosing a Javascript Framework in 2017


Maybe not for beginners, but a must for intermediate and advanced JavaScript developers, this session covers the most popular JavaScript frameworks available at the moment. Topics covered are Ember, Angular2, the Dojo toolkit, React, ES6, Typescript and more. Presenter Dave Bouwman discusses the JS frameworks that are used within Esri and the options JS developers have for building their own GIS web apps in terms of frameworks, libraries and ecosystems.

Read on
Search