1. Ancient olympic games
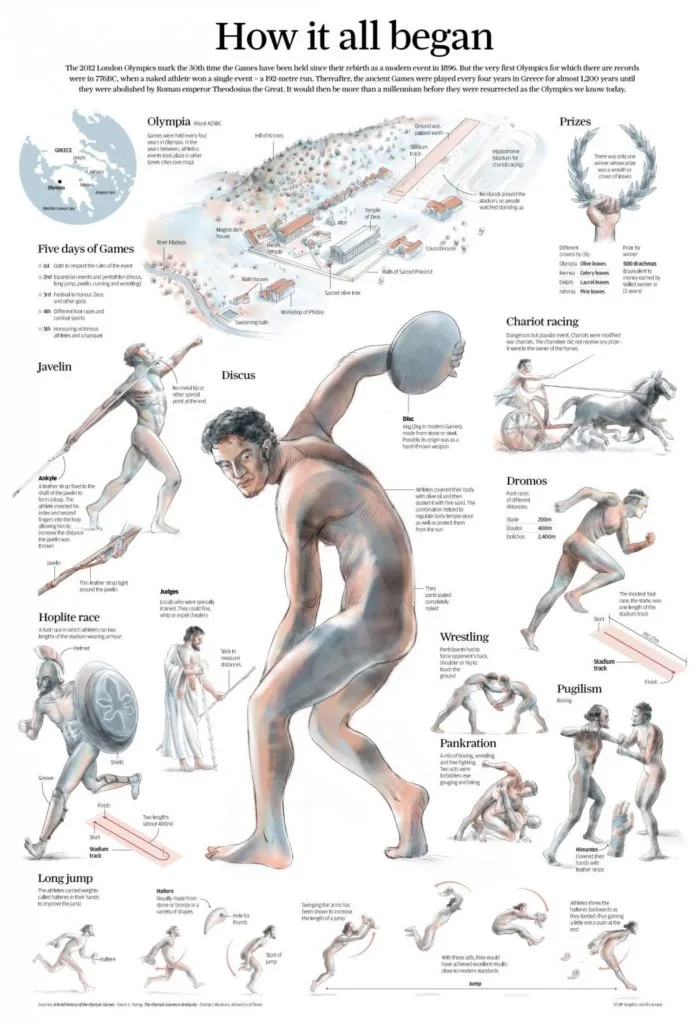
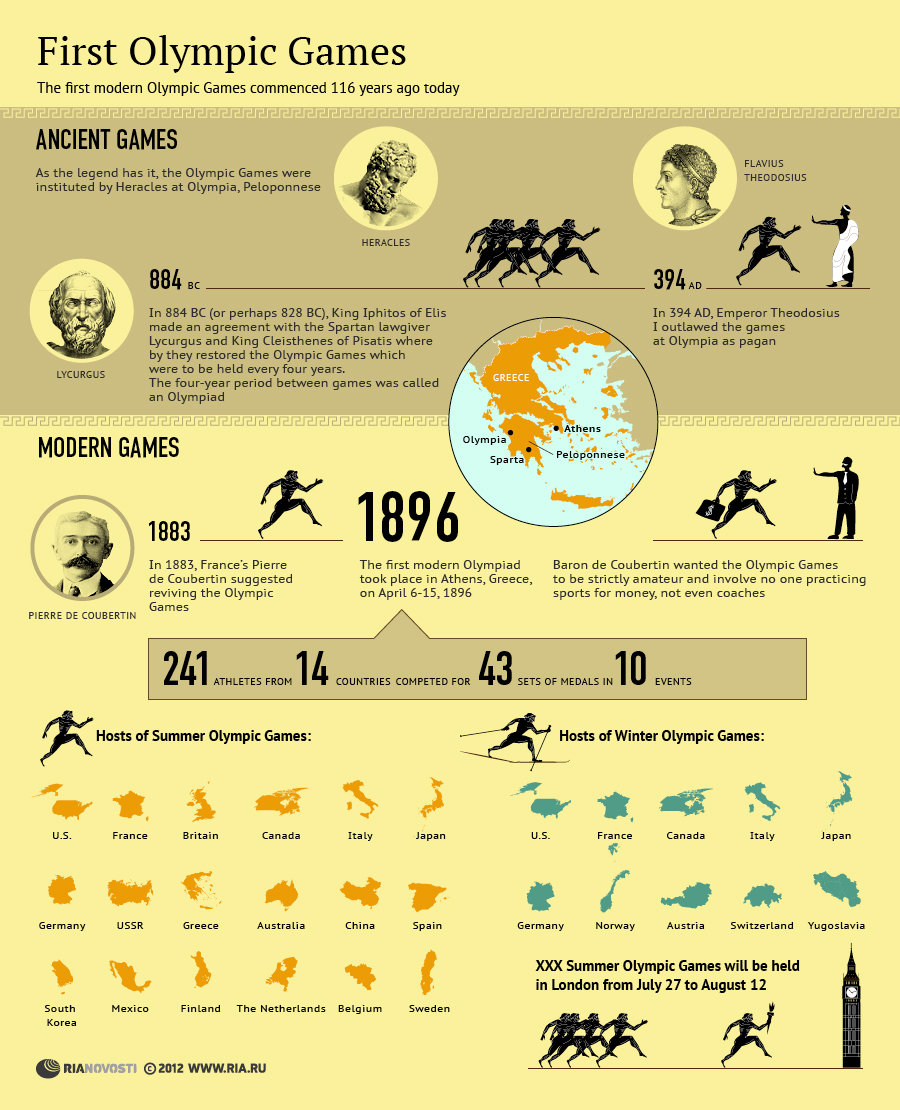
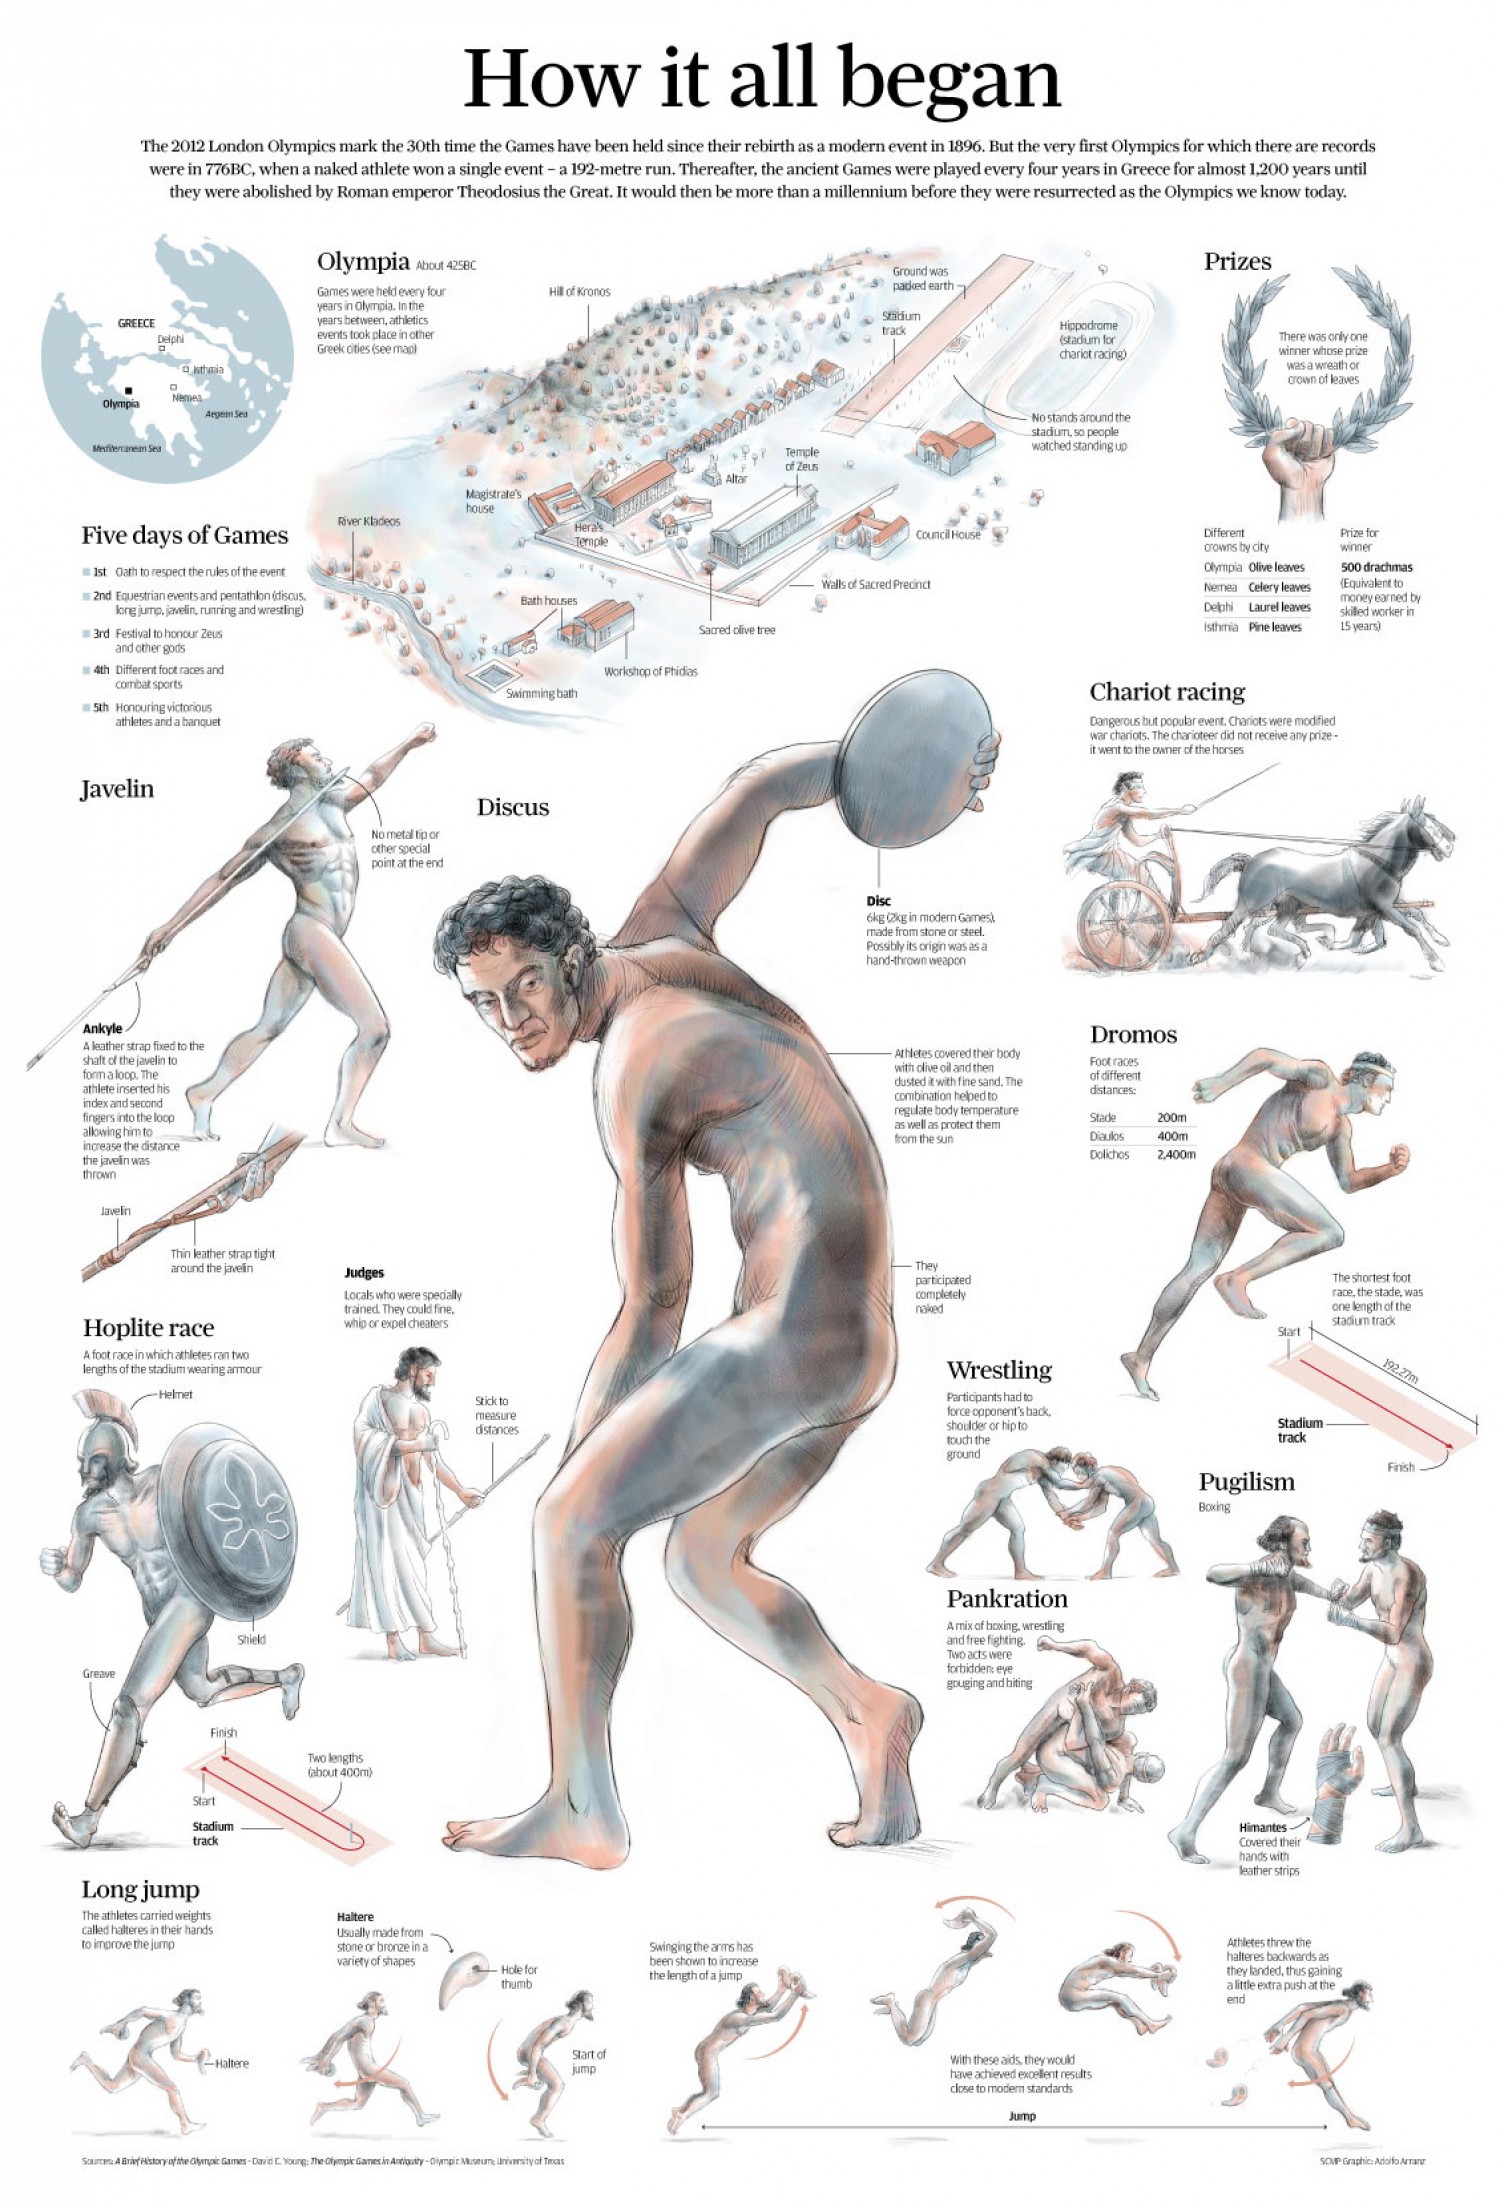
According to historical records, the first ancient Olympic Games can be traced back to 776 BC. They were dedicated to the Olympian gods and were staged on the ancient plains of Olympia. They continued for nearly 12 centuries, until Emperor Theodosius decreed in 393 A.D. that all such “pagan cults” be banned. The Games were placed in the city of Olympia in the western part of the Peloponnese. They were closely linked to the religious festivals of the cult of Zeus.
Project by: Adolfo Arranz
2. First modern olympics games in 1896
The first celebration of the modern Olympic Games took place in its ancient birthplace of Athens. The Games attracted athletes from 14 nations, with the largest delegations coming from Greece, Germany, France and Great Britain.
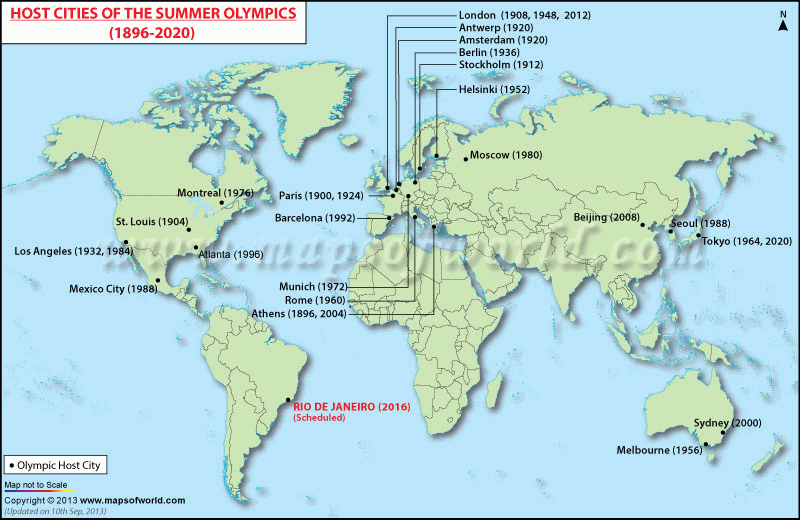
3. Host cities of The Summer Olympic Games (1896-2020)
Since 1896 The Summer Olympic Games were held 31 times (including Rio) every 4 years with an exception of 1916 when they were awarded to Berlin and cancelled due to World War I, as well as 1940 and 1944 when the games were cancelled due to World War II.
source: Maps of the world
4. Evolution of the number of nations participating in the games
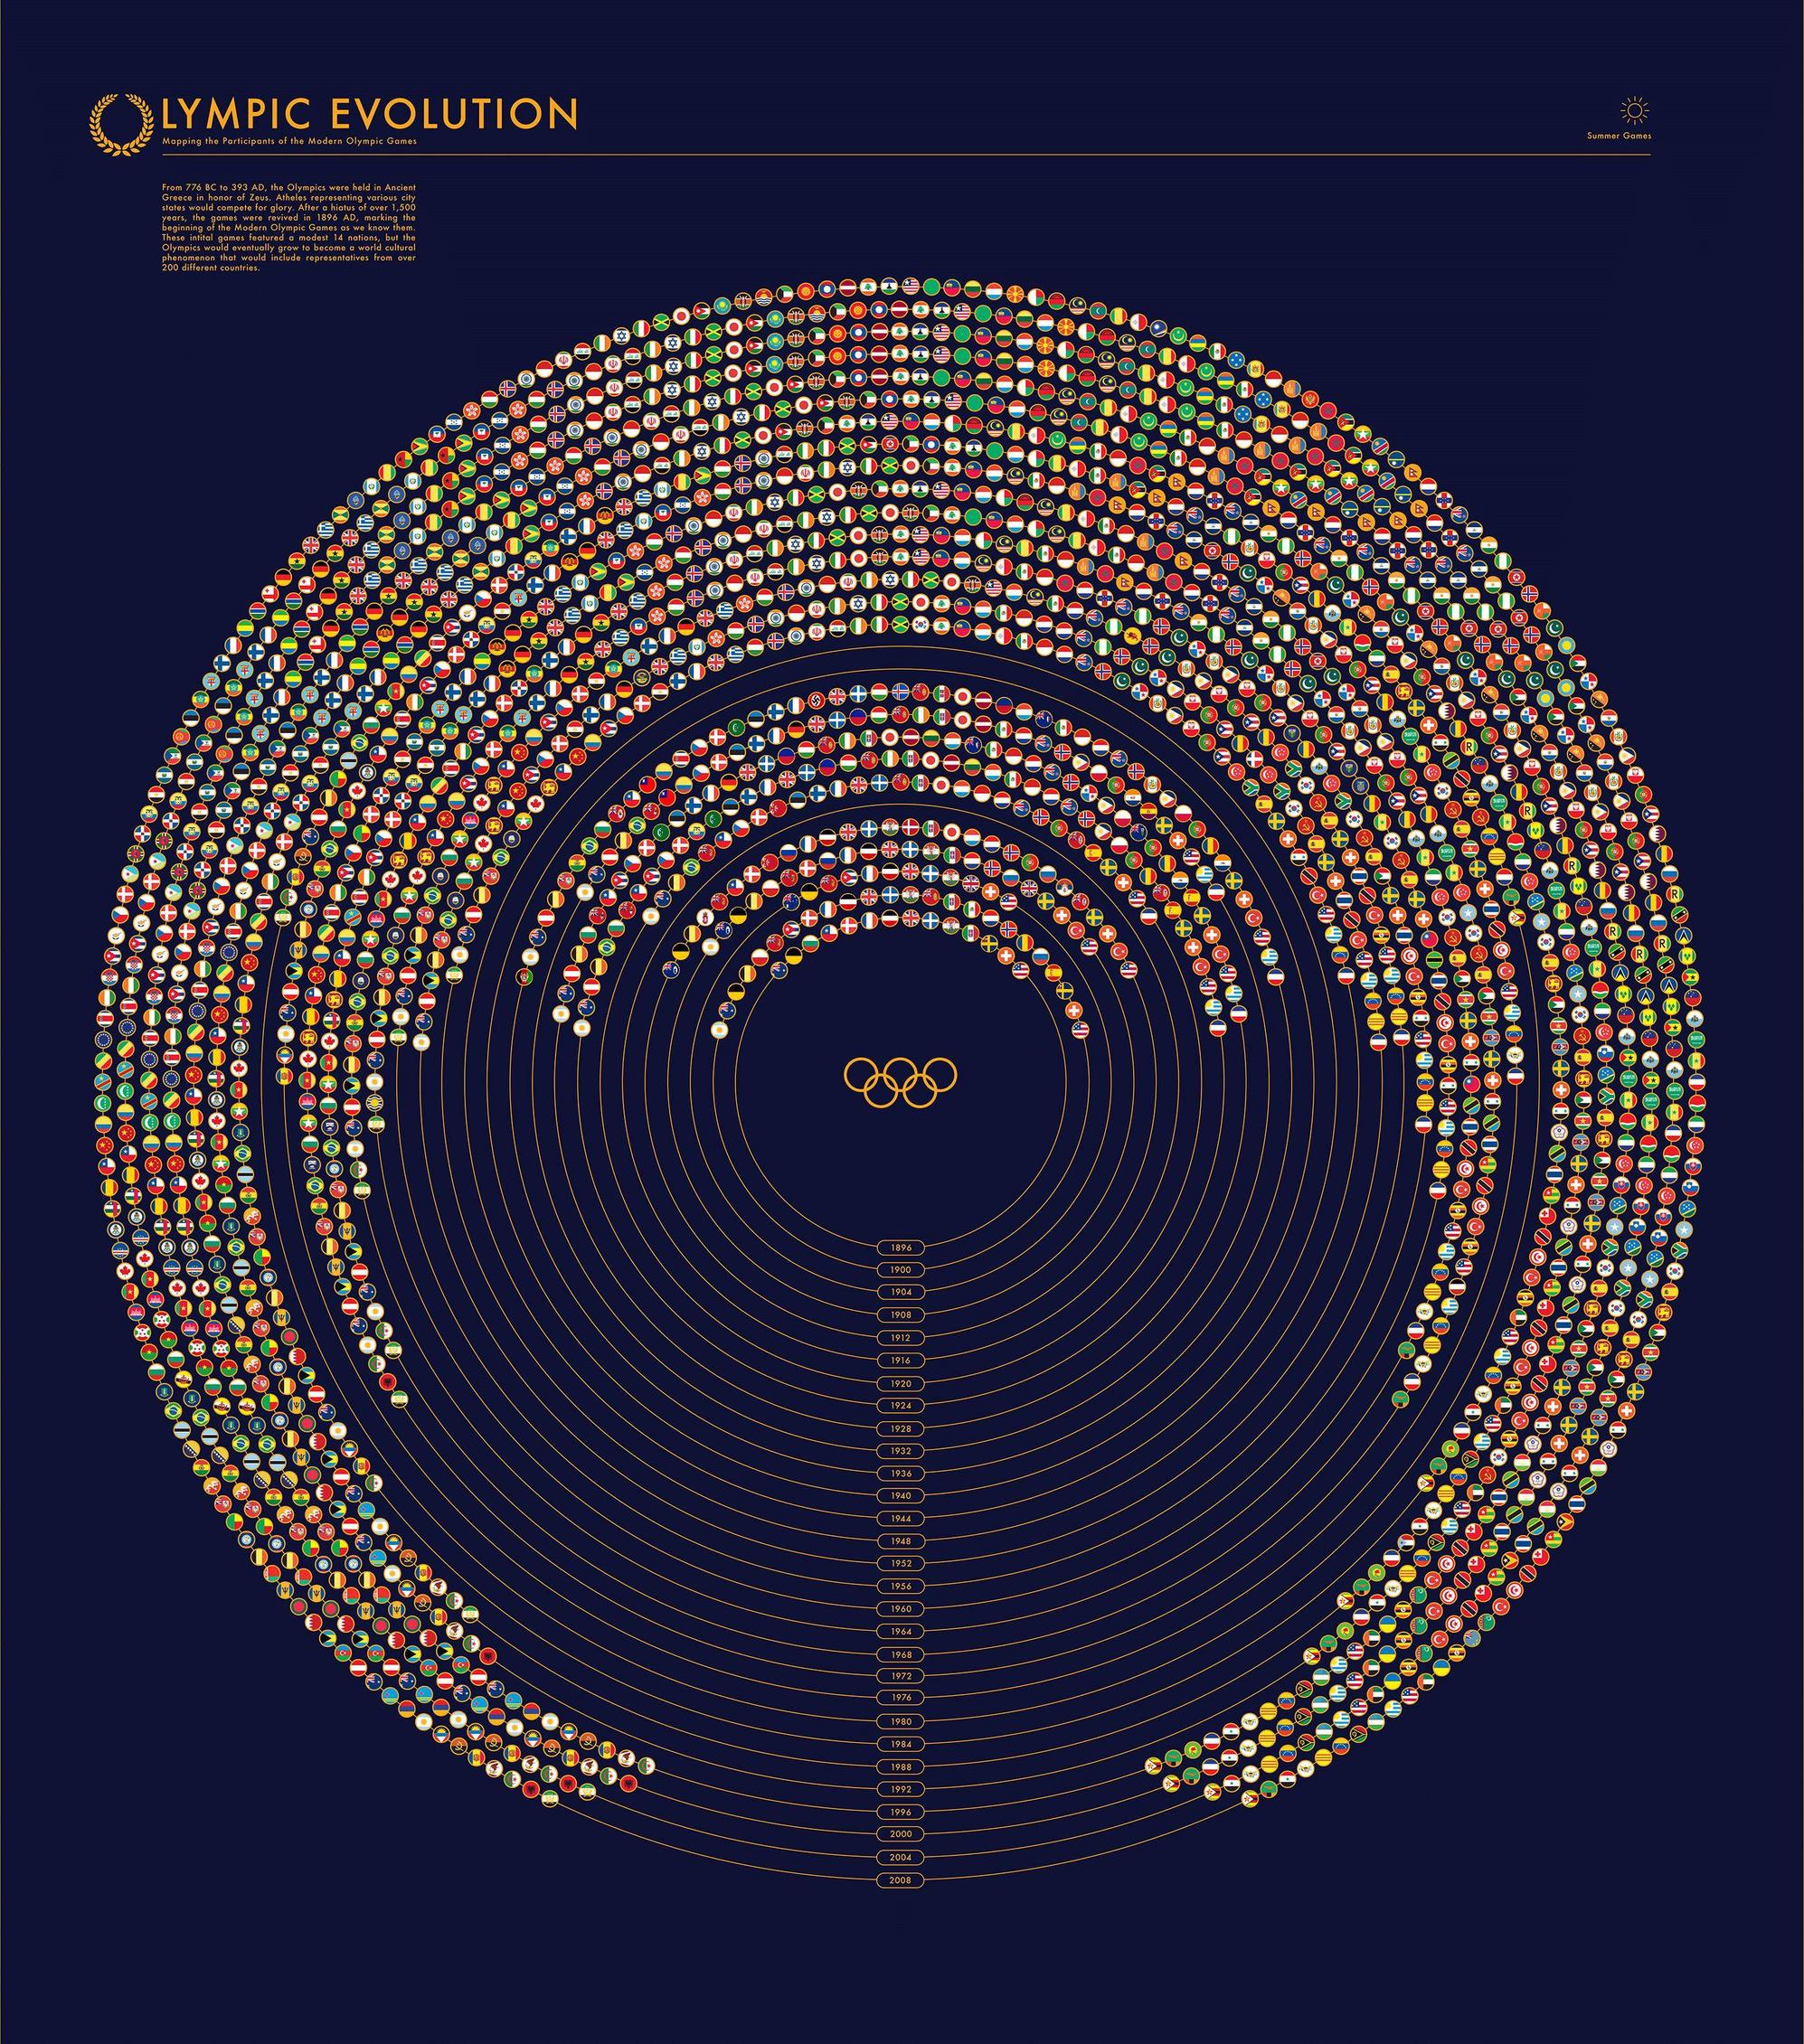
While in 1896 there were 241 participants (all men) representing 14 nations, the number grew with time. In Beijing in 2008 and London 2012 there were almost 11k representatives of 204 nations (60% men, 40% women).
5. How Olympic sports changed over time
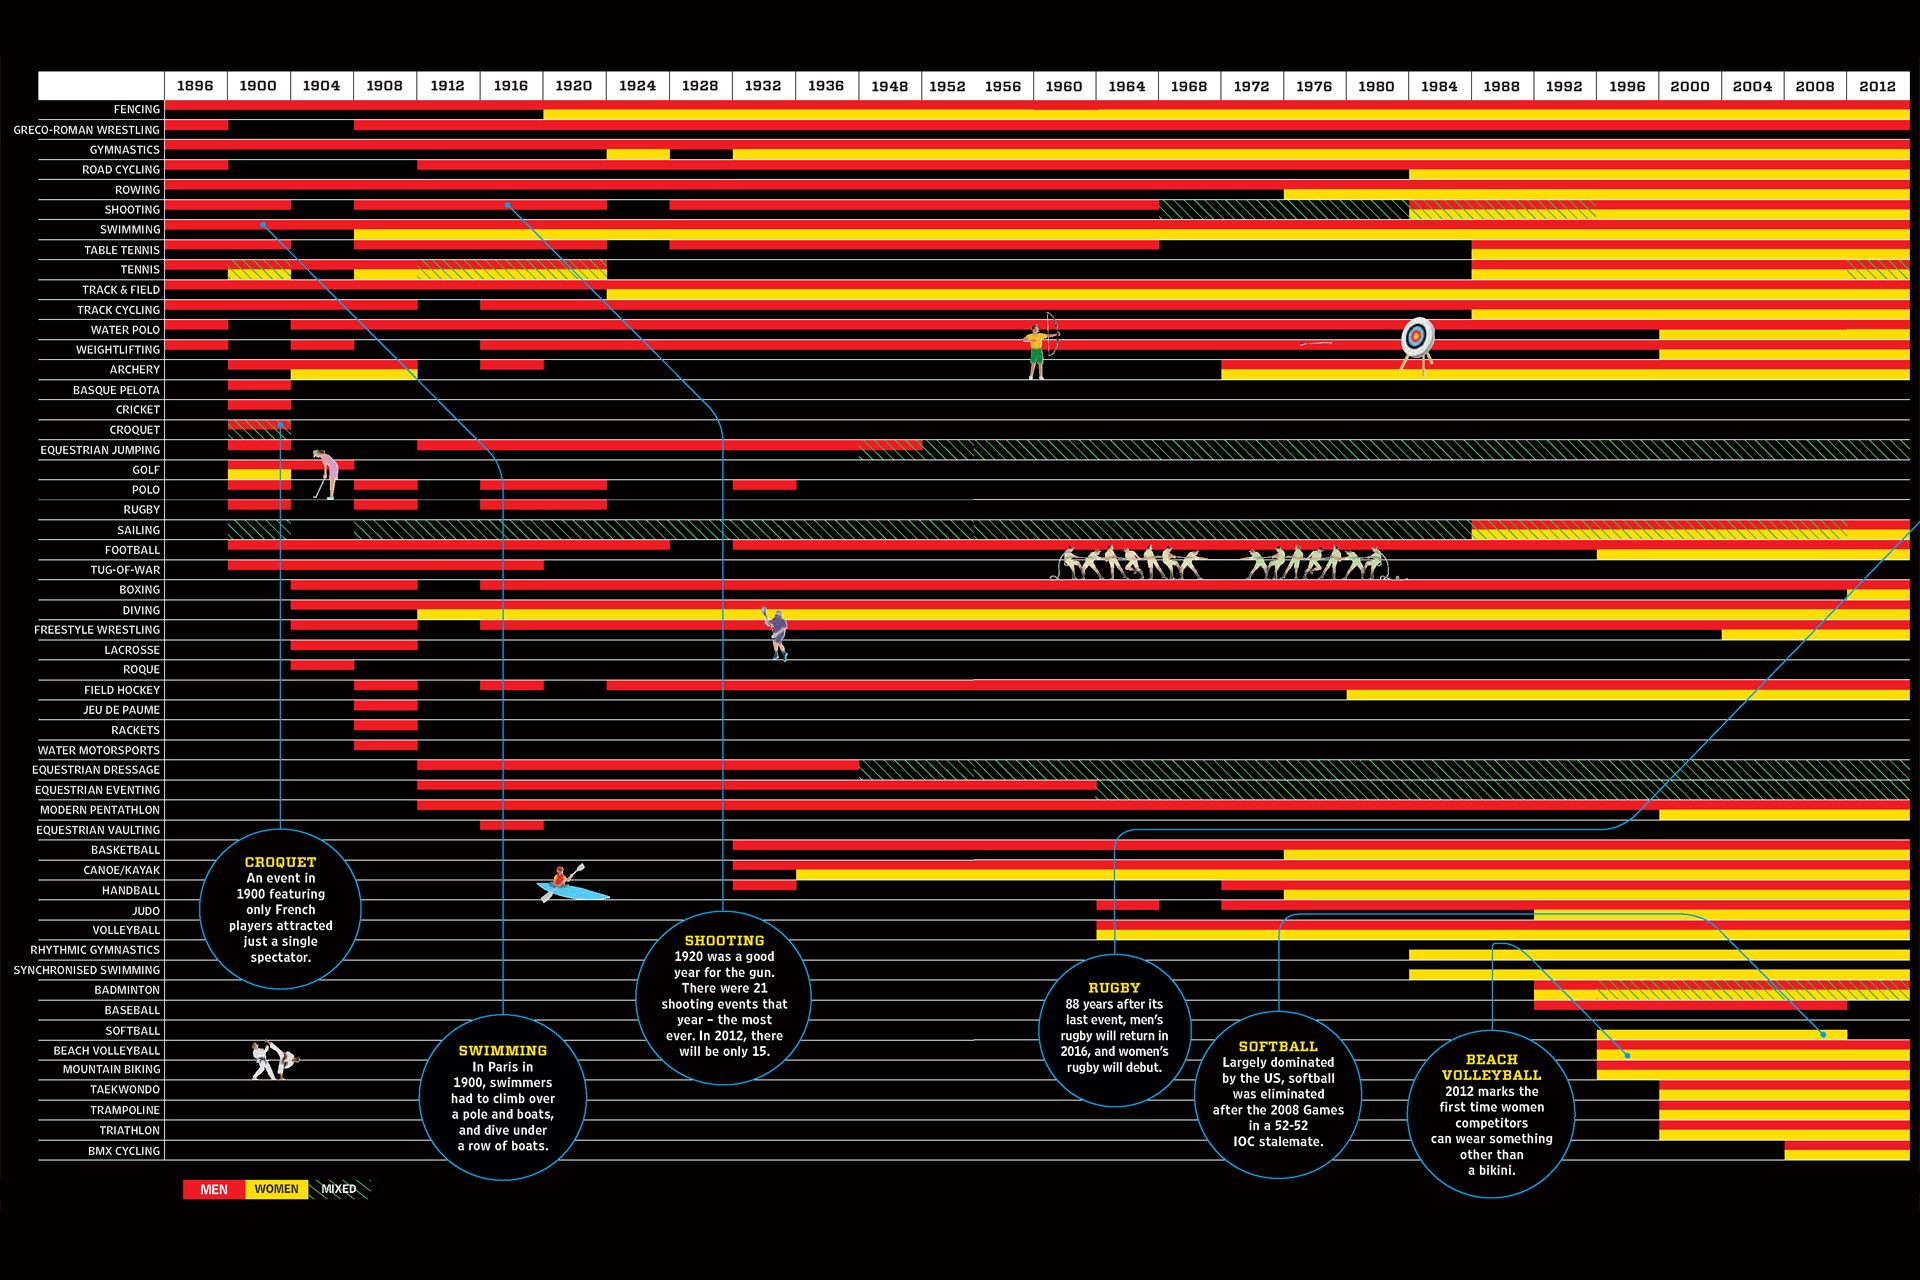
Not only the number of nations evolved over time. The Olympic sports were also changing a lot. Forty-two different sports, spanning 55 different disciplines, have been part of the Olympic program at one point or another. For example in 1900 a new hot event was introduced and lasted only one Olympiad – live pigeon shooting…
source: Wired
6. Olympic medals
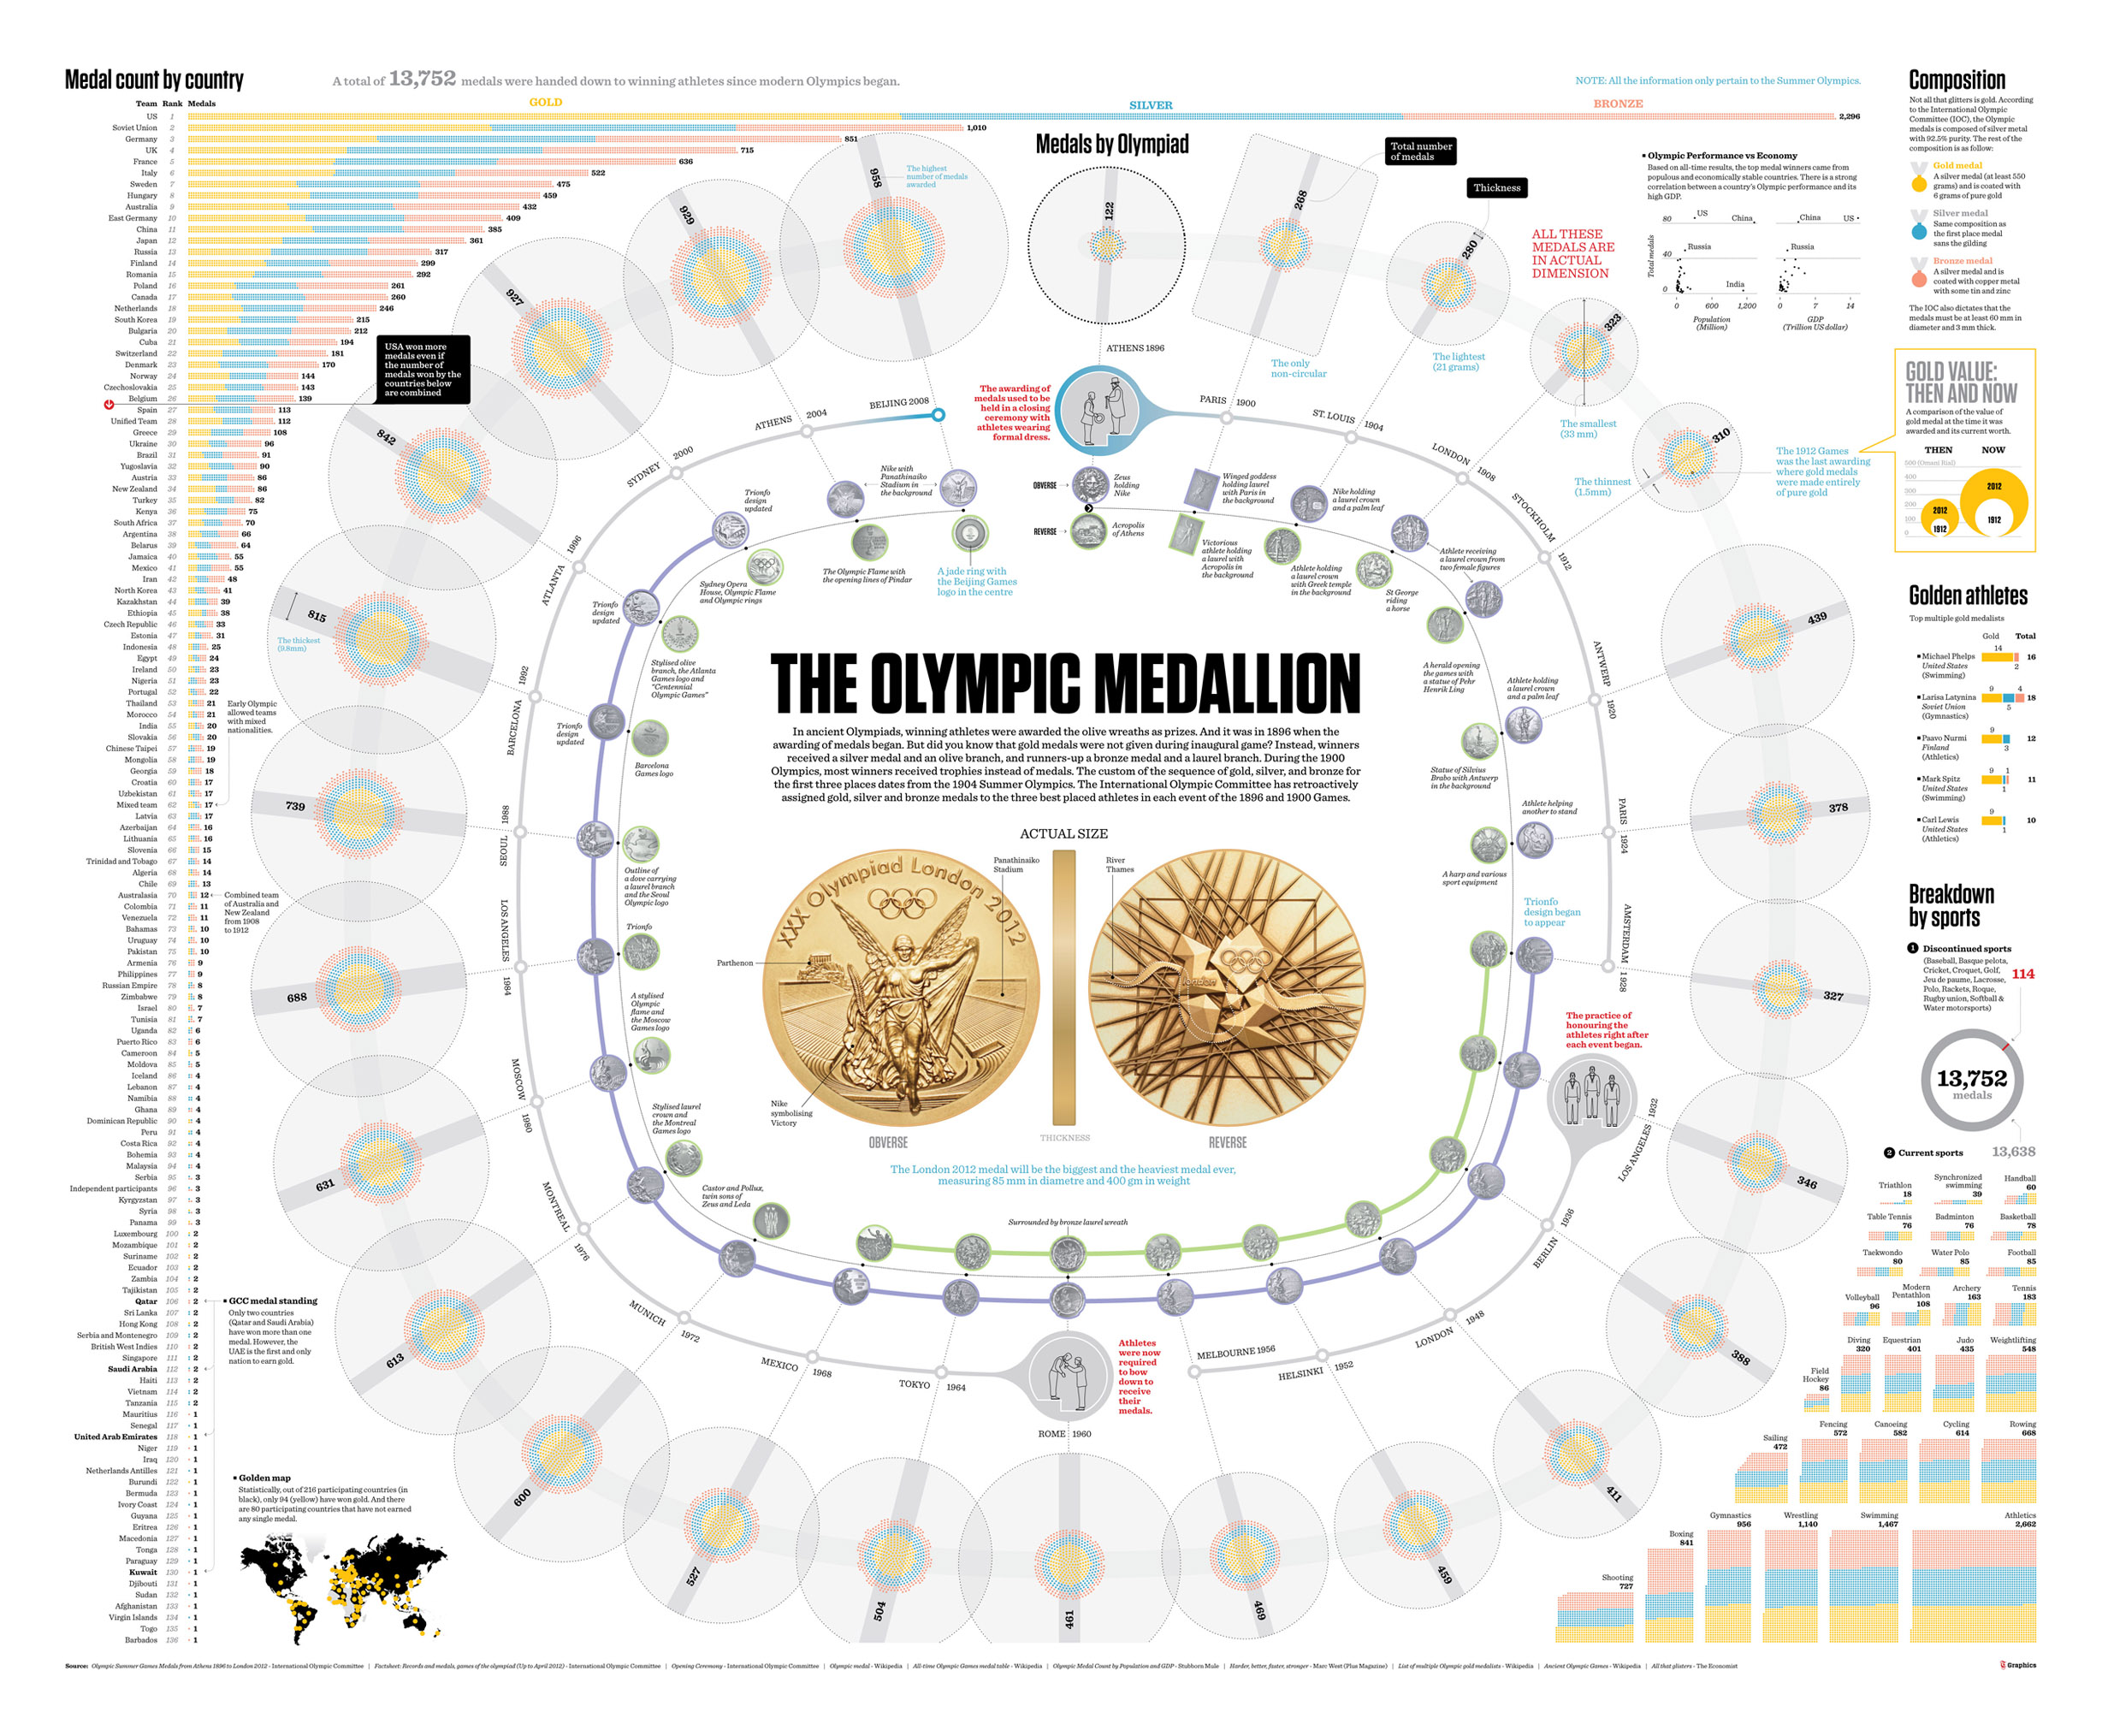
But what really matters is a gold medal. Actually the medal classification as we know it has been introduced in 1904. In 1896 winners received silver medals and an olive branch. In 1900 winners received a trophies instead of medals. Today the leaders in medal classification are the US with 2399 medals in total, Russia with 1405 and Germany with 1135.
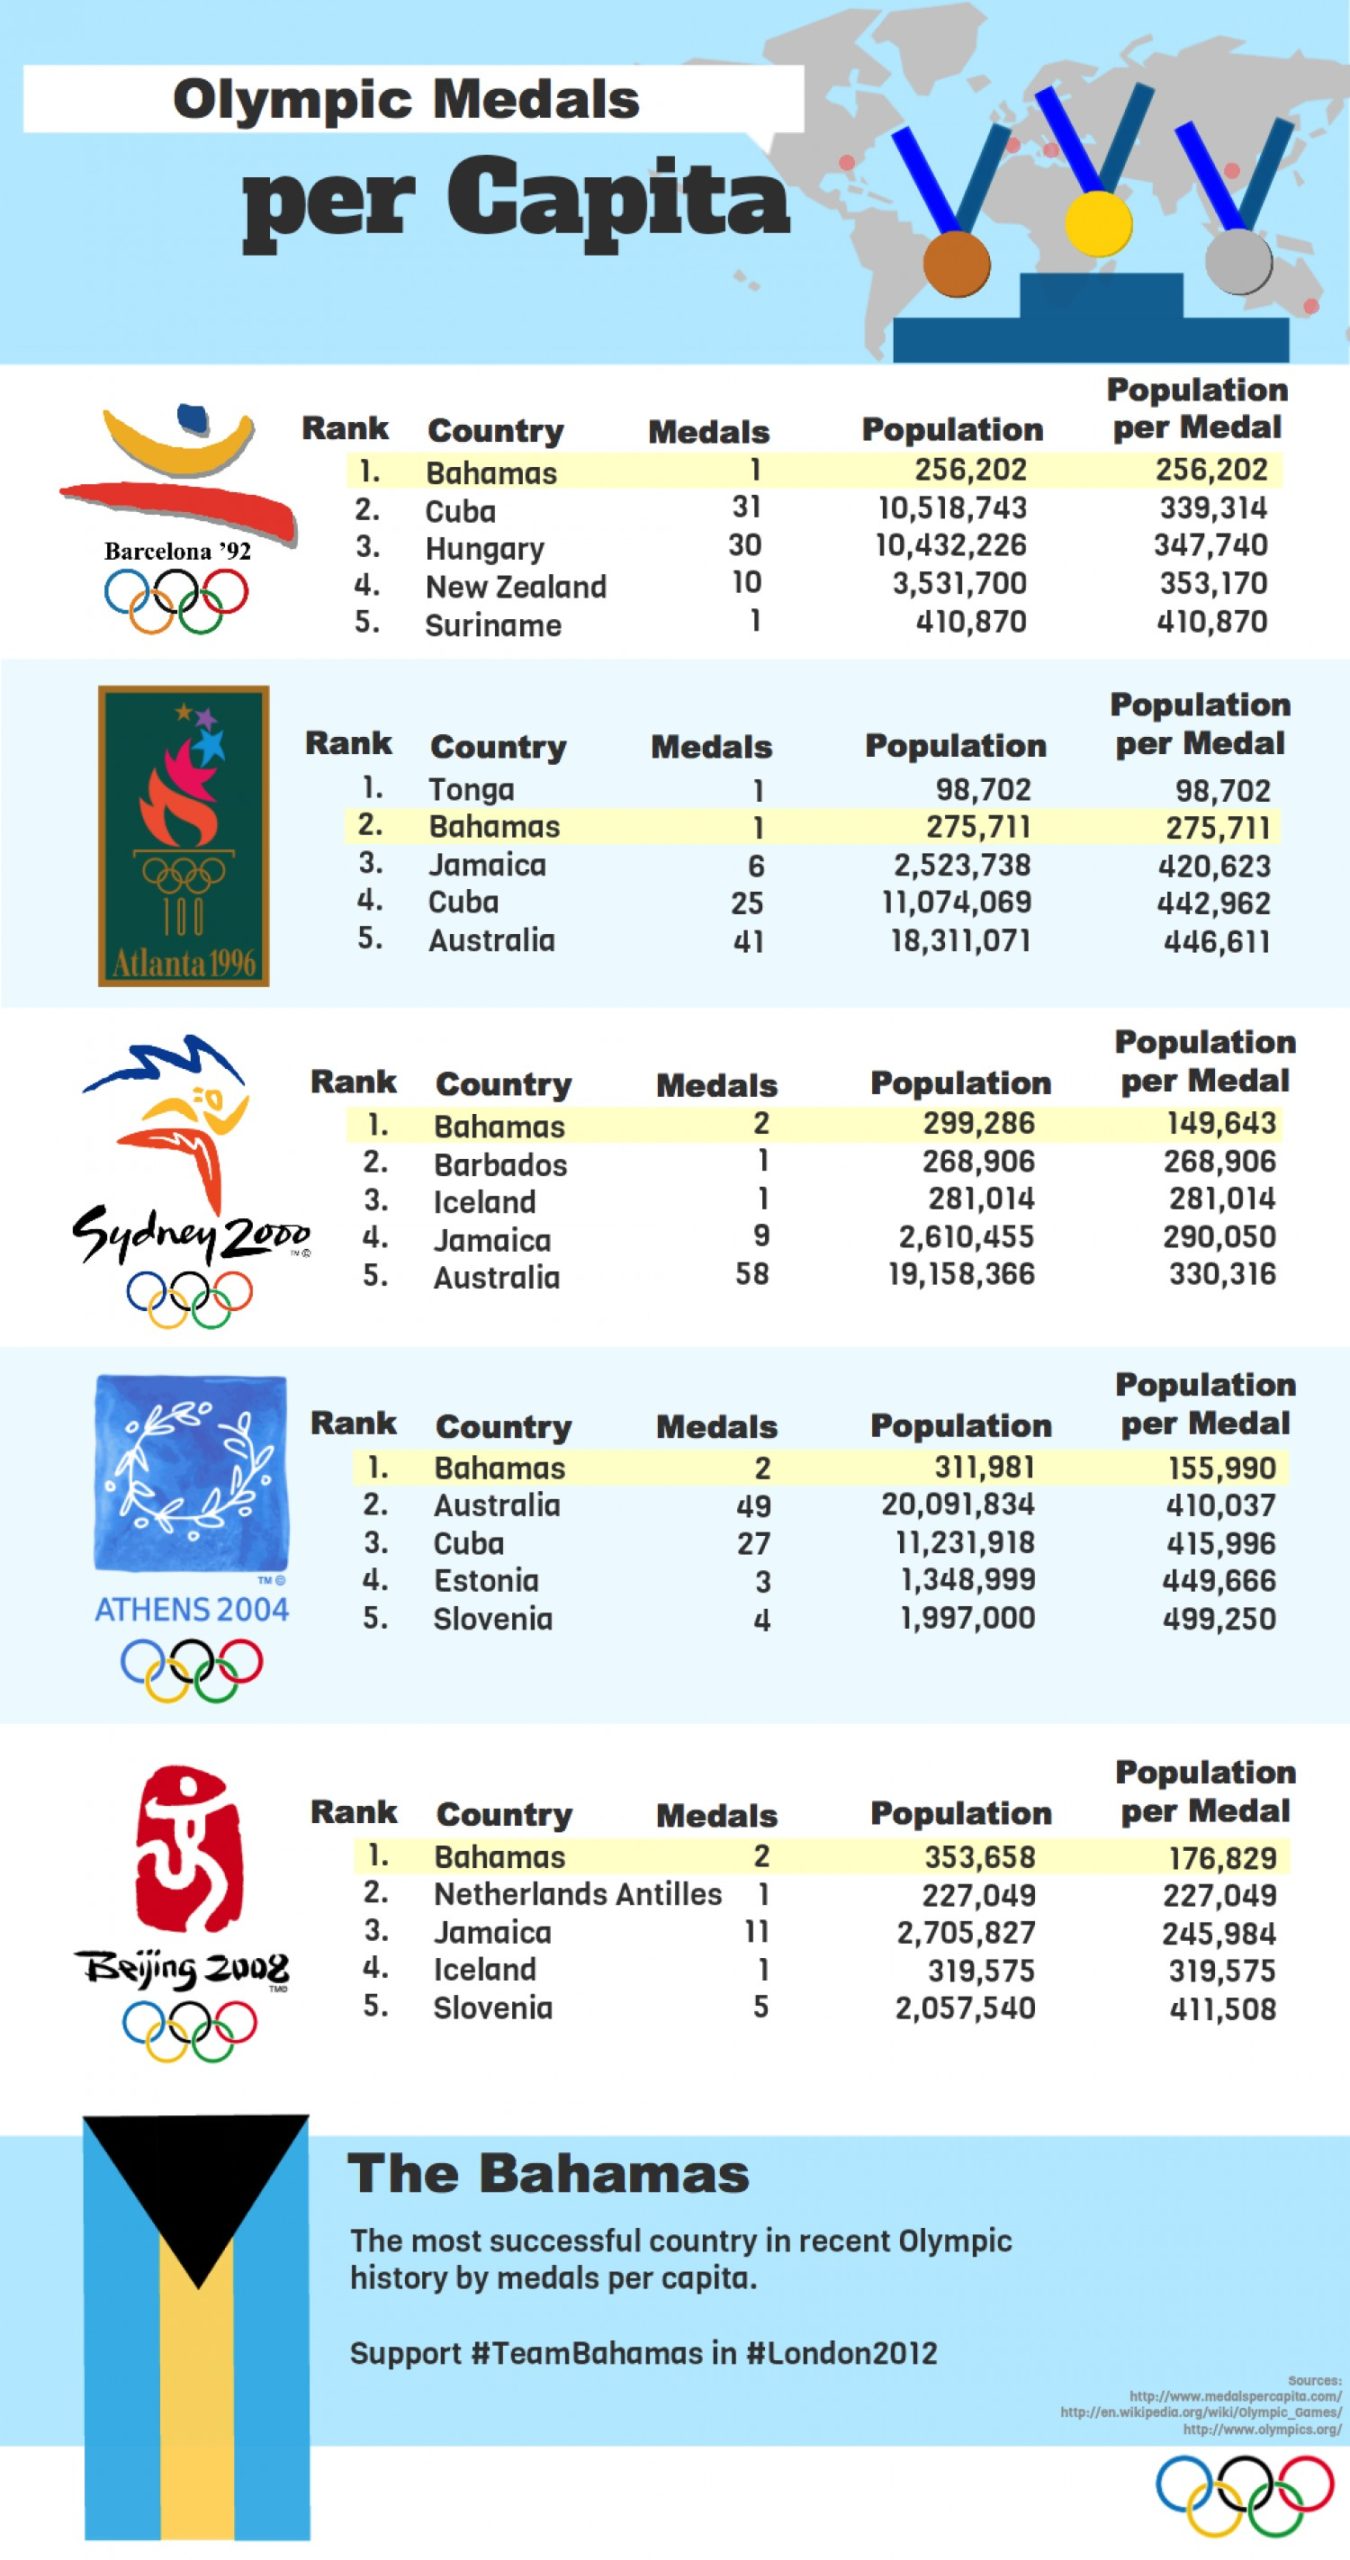
7. Olympic medals from another perspective
But you can look at olympic medals from another perspective… Bahamas is the most successful country in the recent history of Olympic Games… when you count it per capita.
8. Olympics and tech
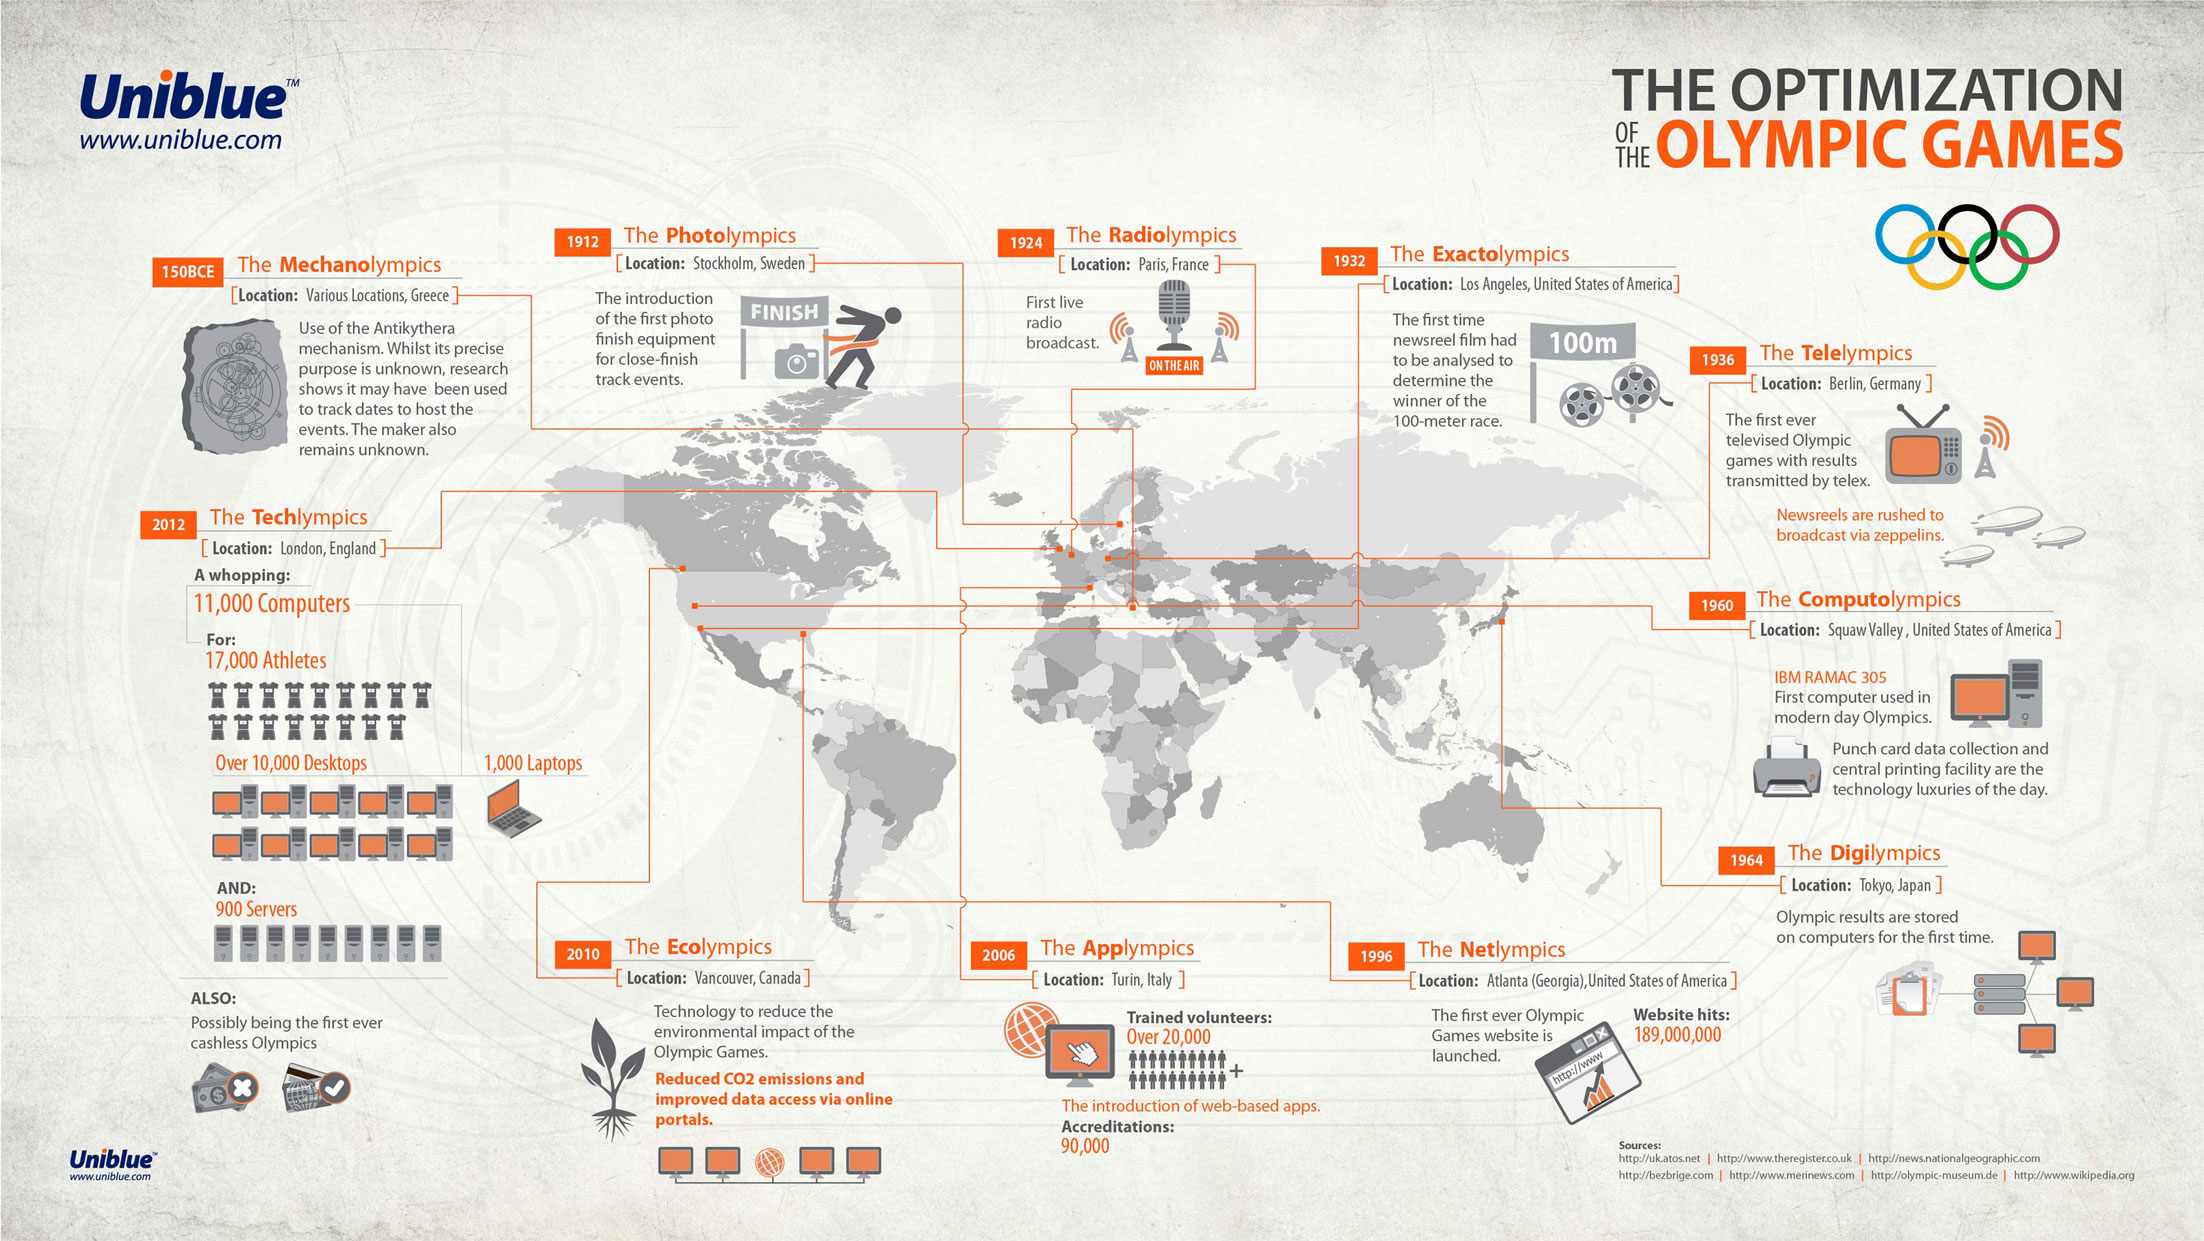
We GeoGeeks and TechGeeks know that sport is not all about physical challenges but also about Tech. And the technology behind the sport and huge events evolved a lot over the last century. Here are the most important technological milestones in the history of The Modern Olympic Games:
9. Olympic boycotts
Unfortunately Olympics are not only about the sport but also about the politics. The most common form of showing to the world that you don’t like the host of the games is a boycott. Most countries participated in at least one Olympic boycott. In fact only four countries—Australia, France, Great Britain, and Switzerland—have been represented at every modern Olympic Games since 1896 (besides countries that had no participants at all).
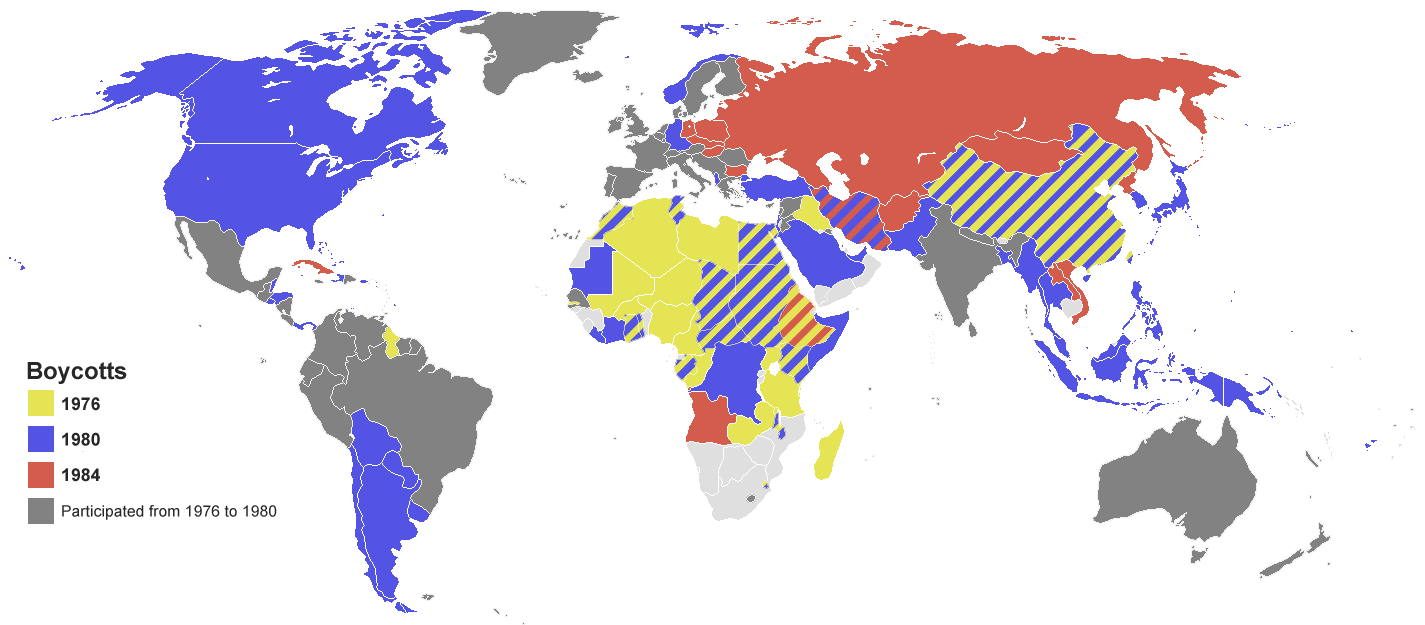
source: Languages of the world
10. Olympics and money
When there are a lot of emotions there is a lot of money. 2012 Olympic Games in London costs are estimated at $14 billion, which are peanuts compared to Beijing in 2008 ($44 billion) and Winter games in Sochi two years ago ($51 billion). Here are some numbers about the Olympic money:


