#Business

Google expands project Sunroof to more states in the USA

The COP21 conference came to a successful end earlier this week, with 195 countries agreeing to converge on a deal to reduce carbon emissions and limit the effects of industrialization on the planet’s health.

OK Google “Should I go solar?”

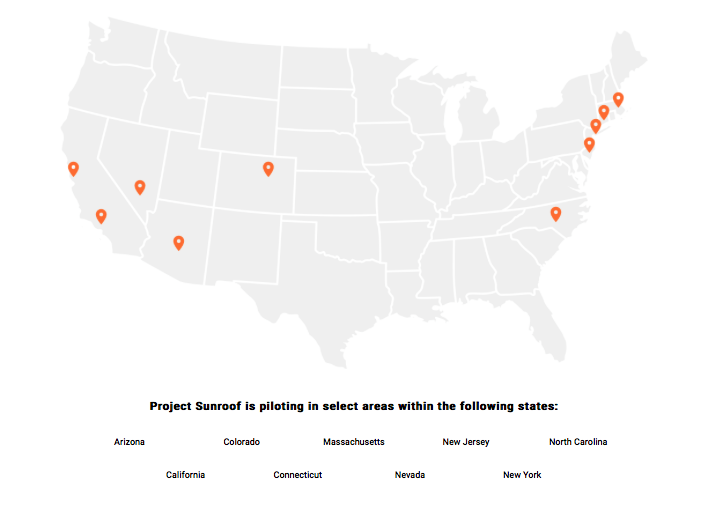
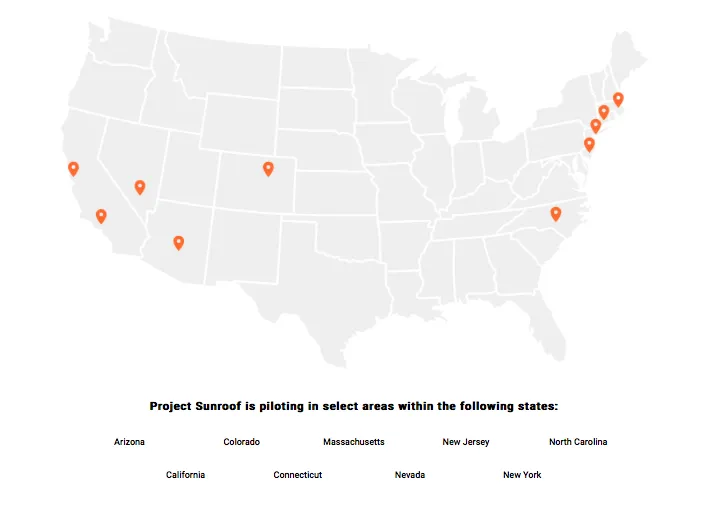
The answer to that question is Google’s project Sunroof that was launched earlier in August this year. It was simple spatial analysis tool that lets one calculate the savings in energy costs if you go solar, but it was only available in Boston, San Francisco and a few other areas in the US. In a blog post “Should you go solar? Just ask Project Sunroof.” earlier this week, Google announced that they are expanding the program to more states in the US.

Google Sunroof coverage

Google Sunroof coverage

Doing our bit for planet

The COP21 agreement cannot be successfully enforced with each citizen also agreeing to limit their carbon footprint, with Project Sunroof its easier to see how our actions can help save the planet, one Watt at a time! Hopefully, Google expands the project to other nations as well.

Say thanks for this article (0)
The community is supported by:
Become a sponsor
#Business
#Business #Featured #Ideas
Why Have Scientific Datasets Been So Widely Adopted in Earth Observation and What Role Does Data Quality Play?
GeoawesomeTeam 07.17.2024
AWESOME 4
#Business #Featured
How 15 Centimeter Satellite Imagery is Changing the Mapping Game
Aleks Buczkowski 12.2.2024
AWESOME 5
#Business #Featured
Call for nominations: Global Top 100 Geospatial Companies 2025 Edition
Avatar for Muthukumar Kumar
Muthukumar Kumar 10.1.2024
AWESOME 1
Next article
#Featured #Ideas

Global Urban Transformation Map: Visualize the unprecedented urbanization of the world

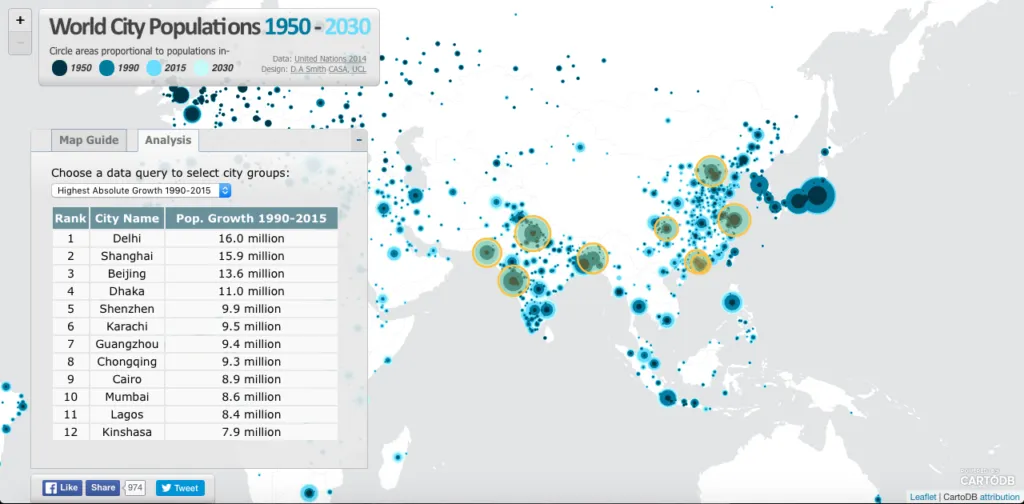
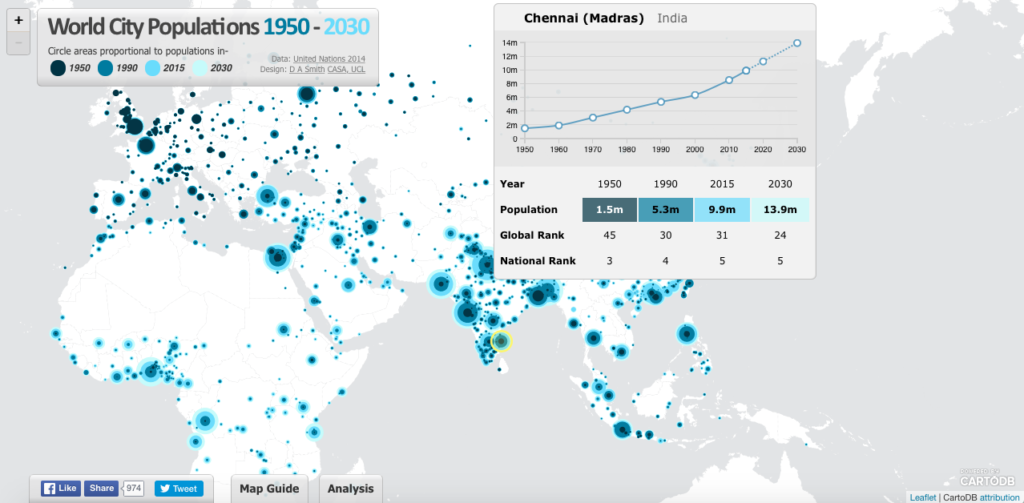
The world is undergoing a rapid urban transformation and by 2050, two-thirds of the world population is predicted to live in urban areas compared to 54% today. The rate of transformation is phenomenal and this new visualization from Duncan Smith from the University College London is yet another great example of the power of visualizing data using maps – the Global Urban Transformation map!

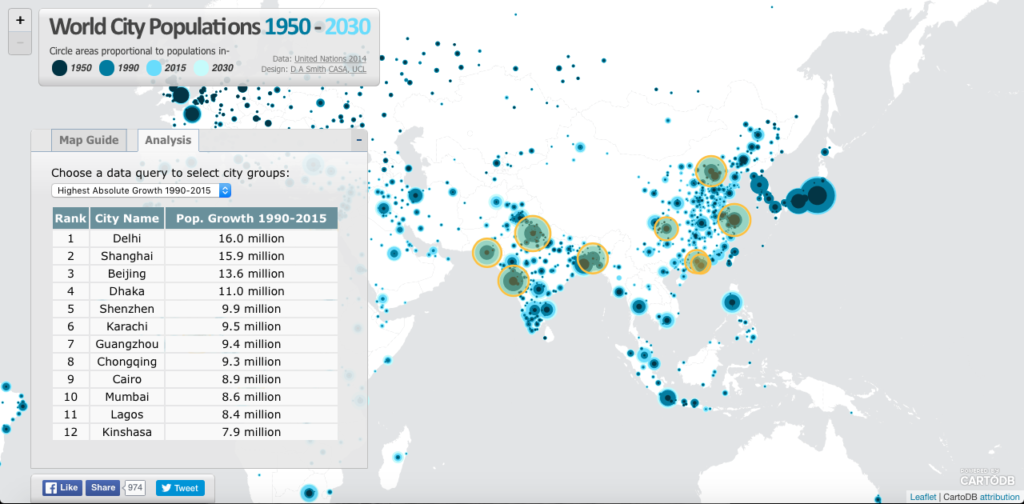
World City Populations 1950 - 2030 (2)The map uses data from the UN World Urban Propospects and the tools from CartoDB. For detailed information – have a look at this page. In addition to visualizing the urbanization trends from 1950 till date, the map also has some simple SQL queries that can be used to get a better idea of the urbanization e.g. “Highest absolute growth 2015-2030“.

World City Populations 1950 - 2030

The pace of recent change at the city level is unprecedented in human history. Shanghai (click on the city link to focus the map) gained 16 million people between 1990 and 2015, Beijing 13.6 million, Dhaka 11 million. Delhi gained 16 million residents between 1990-2015 and is now the world’s second largest city of 26m. Delhi will likely overtake Tokyo to become the world’s largest city in the 2030s with nearly 40m residents. – Luminocity.com

Read on
Search