

We are thrilled to announce that Geoawesome is expanding its collaboration with Montgomery Group, the organizers of Geo Connect Asia (GCA).
Building on the success of last year’s partnership, where we covered the event as official media partners and launched the Asian Leadership Series, we’re taking things to greater heights in 2025!
For the first time ever, Geoawesome is directly involved in shaping a conference agenda. At this year’s Geo Connect Asia 2025, we’ll be debuting the APAC Earth Observation (EO) Forum— a dedicated platform exploring the future of EO in Asia.
Rupert Owen on the partnership with Geoawesome – “I am delighted to be working with Geoawesome in broadening the reach, understanding and potential of geospatial based solutions in new markets. The true value of partnership is in exploring new ways of building communities through co-operation and establishing new platforms, starting with the launch APAC EO Forum this year. We value the expertise and drive that Geoawesome brings to Geo Connect Asia and especially welcome partners who can bring alive conversations in tune with the ambitions of the communities we are embracing.”
Introducing the APAC EO Forum
Scheduled for April 10, 2025, the APAC EO Forum will be one of several co-located events at Geo Connect Asia 2025, alongside Digital Construction Asia, Drones & Uncrewed Asia, and Marine & Hydro Asia. This forum will bring together industry leaders, researchers, startups, and policymakers to discuss how EO technologies are transforming industries, including insurance, climate resilience, disaster response, and sustainable development.
Key Highlights
- Expert-led panel discussions and keynotes from leading EO professionals
Real-world case studies showcasing the impact of EO across multiple sectors
Networking opportunities with key industry stakeholders
Members of the Geoawesome team, Muthu and Aleks, will be attending in person and look forward to connecting with geospatial professionals from across the region.

Exclusive Discount for Geoawesome Readers
We are delighted to offer our readers a exclusive 15% discount on a 2 Days Conference Pass for Geo Connect Asia 2025. If you are interested in attending, make sure to secure your spot soon.
Register here: Geo Connect Asia Registration
Sponsorship & Speaking Opportunities
A limited number of sponsorship and sponsored speaking opportunities are still available. Are you looking to position your brand at the forefront of the geospatial and Earth Observation industry? Then this is an excellent opportunity to engage with a highly relevant audience.
For event and media inquiries, please contact:
Rupert Owen
Co-founder & Director, Montgomery Group
Rupert.Owen@montgomerygroup.com
We look forward to welcoming you to Geo Connect Asia 2025 and delving into insightful discussions at the APAC Earth Observation Forum.


#Events

Next article
In the ever-changing world of geospatial technology, being able to analyze and visualize synthetic aperture radar (SAR) data is crucial for understanding surface deformations and structural movements.
That’s where InSAR Explorer comes in. It’s a cool QGIS plugin that makes analyzing interferometric SAR (InSAR) time series data a breeze. With its set of features and simple interface, this plugin is useful for researchers and engineers as it allows users to dynamically visualize and analyze time series data from InSAR, making it easier to monitor ground displacement over time.
Dynamic Visualization of Time Series Data
InSAR Explorer Origins
InSAR Explorer’s main strength is its ability to show time series data dynamically for any selected InSAR point on the map. The author of this tool, Mahmud Haghighi, is a prominent figure in the field of remote sensing and geoinformation. He is particularly known for his contributions to SAR technology. As the author of InSAR, Haghighi’s commitment to enhancing the accessibility and usability of advanced geospatial analysis techniques has helped the scientific community better understand Earth’s dynamic processes.
Using InSAR Explorer
Once you’ve loaded an InSAR vector layer in QGIS, you can interactively select specific points and check out the area’s deformation history over time. This feature is key for keeping an eye on gradual surface displacements caused by natural or human-made processes, like tectonic activity, mining subsidence, or urban infrastructure settling.
The time series visualization feature lets users quickly spot patterns, anomalies, and trends, making it easier to figure out the extent and nature of surface deformations. It’s a pretty intuitive way to explore how SAR data changes over time, so you can get meaningful insights without having to do a lot of coding or data manipulation.
By simplifying the process of interpreting InSAR data, InSAR Explorer encourages creative applications in fields such as disaster management, urban development, and environmental monitoring – from users of all backgrounds.
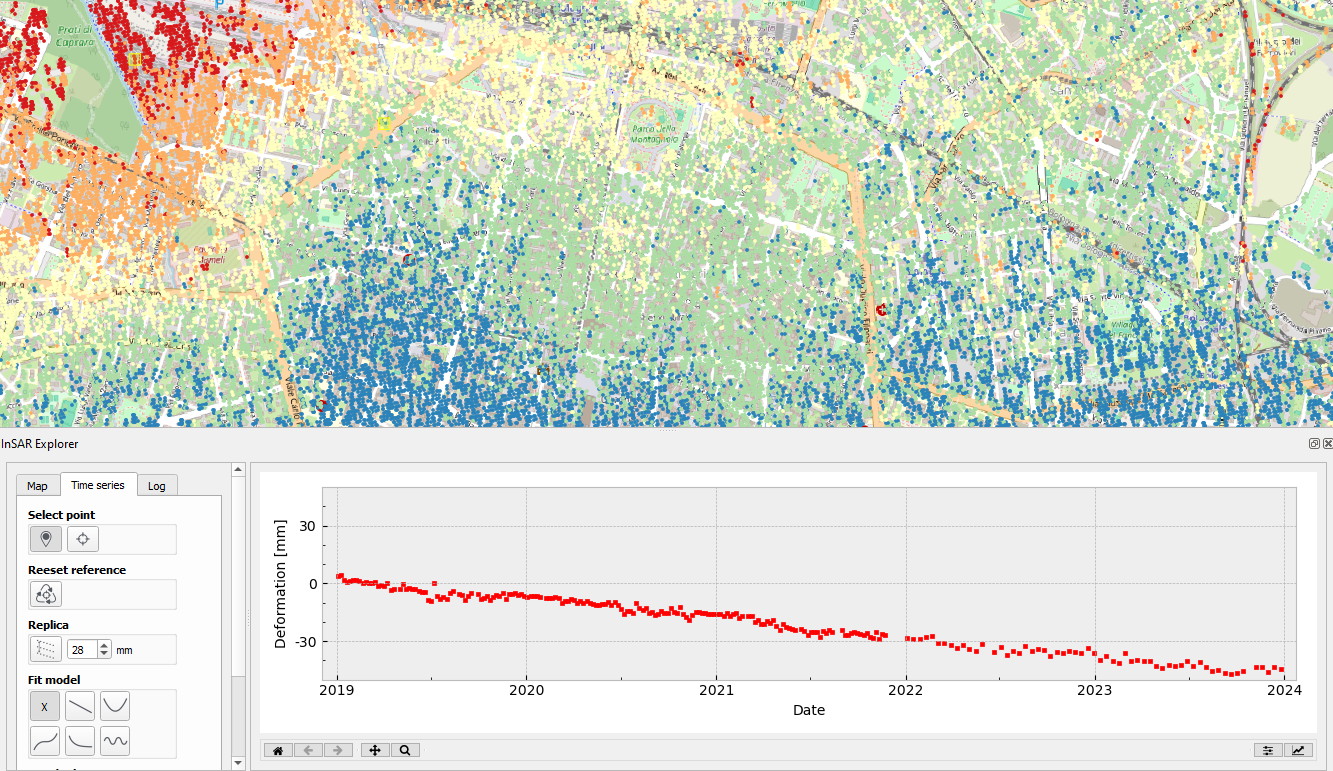
Visualization of Time Series Data with InSAR Explorer
Setting a Referencing Point: A Key to Accurate Analysis
One of the best things about InSAR Explorer is that it lets you set a referencing point for the analysis.
In InSAR studies, picking an appropriate reference point is key because it acts as the baseline against which all the other measurements are compared. The reference point usually shows a stable spot that’s thought to be free of deformation, which makes sure that the measurements of relative movement are on point and meaningful.
For example, in a case study involving urban subsidence monitoring, it’s possible to select a stable building foundation as the reference point. By comparing deformation measurements relative to this fixed location, we can accurately assess areas of sinking ground and estimate its severity. InSAR Explorer streamlines this process, allowing usto set and modify the reference point with ease, thereby improving the precision of our analysis.
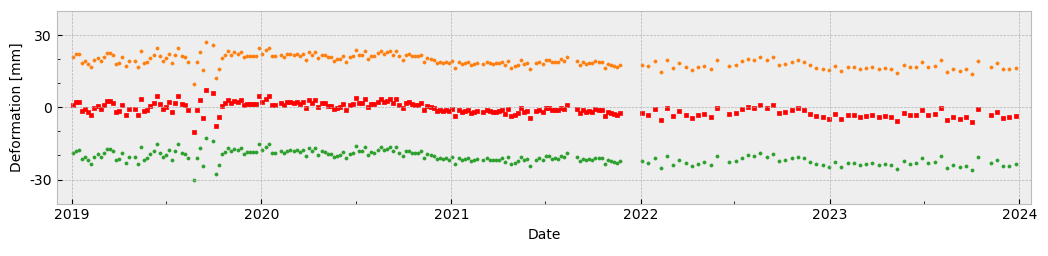
Plotting Replicas: Enhancing Data Comparison
InSAR Explorer allows users to plot replicas of time series data for comparative analysis. This feature is really useful when you need to evaluate multiple points or datasets at the same time. By plotting replicas, users can compare deformation patterns across different regions, identify correlations, and detect potential causative factors.
For example, in a landslide risk assessment project, researchers could select multiple points along the landslide-prone area and plot their time series replicas. This comparison helps us understand how far the displacement is and how it’s changing over time, which is essential for devising effective disaster risk reduction strategies. By making this complex analysis straightfoward and accessible, InSAR Explorer empowers individuals and organizations to proactively address environmental challenges and enhance community safety.
Model Fitting: Interpreting Deformation Trends
InSAR Explorer’s model fitting feature is a pretty powerful analytical tool.
It allows users to fit mathematical models to the observed time series data. You can use models like linear, polynomial, or seasonal fits to interpret underlying trends and predict future deformations.
For example, in a dam monitoring project, engineers can use model fitting to determine whether observed subsidence follows a linear pattern due to long-term settlement or exhibits seasonal variations linked to water levels.
The model fitting feature provides a clear visualization of the relationship between time and displacement, making it easier to identify deviations from expected behavior and assess the stability of the structure.
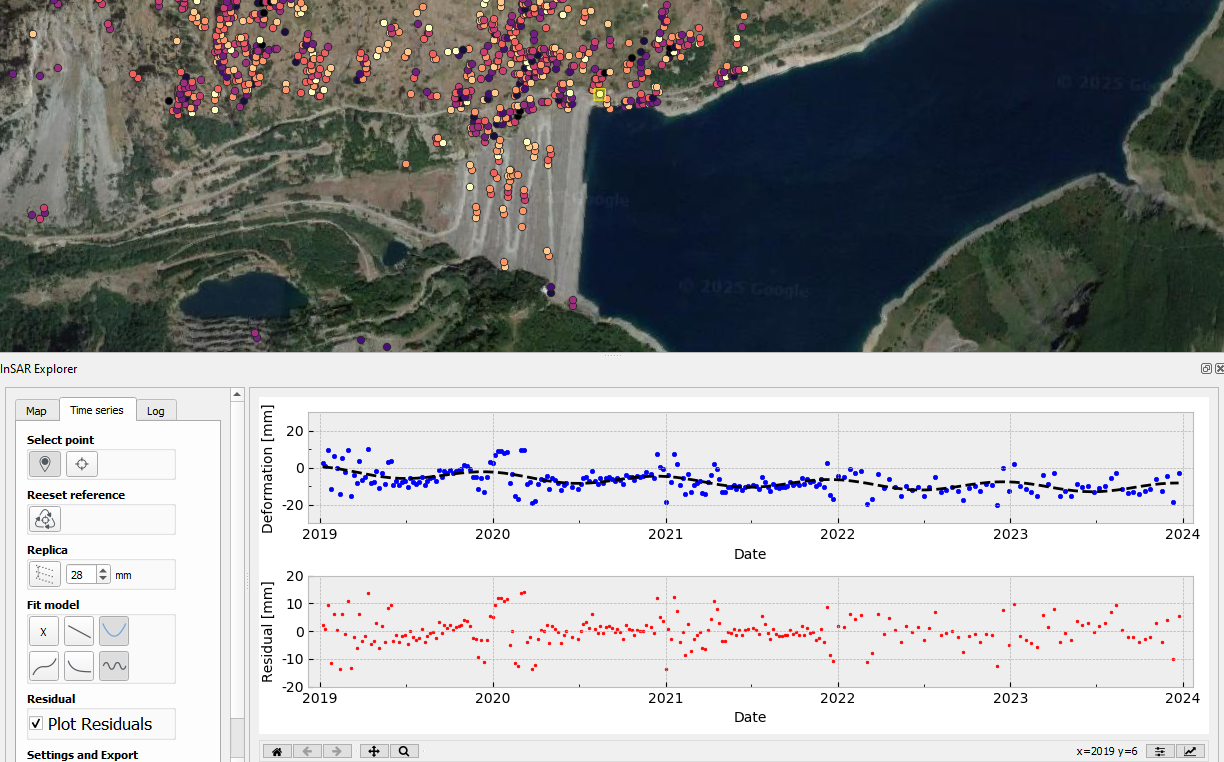
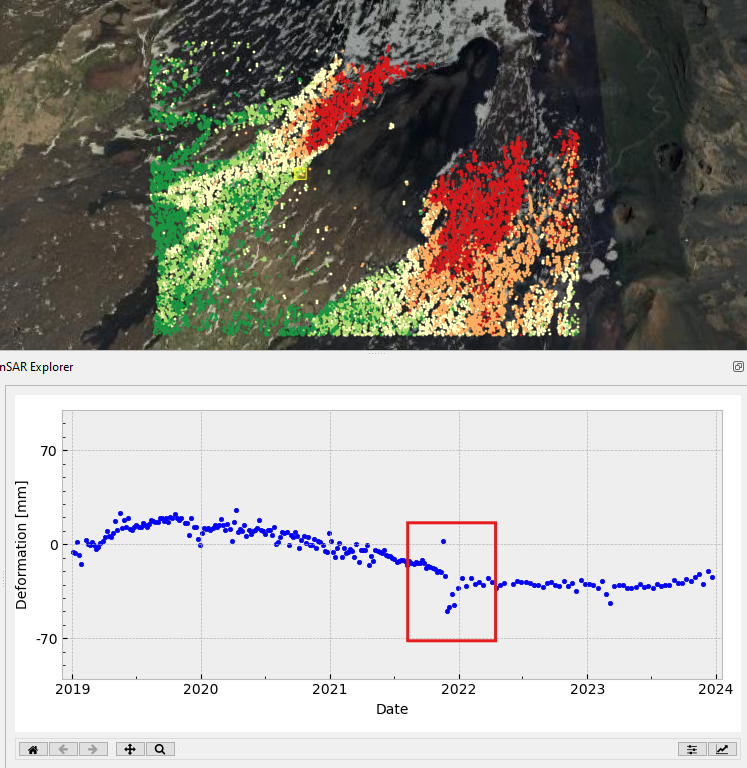
Plotting Residuals: Detecting Anomalies
InSAR Explorer offers another great feature that allows you to plot residuals, which represent the differences between the observed time series data and the fitted model.
This analysis is crucial for detecting anomalies in the data, which could mean there’s something unexpected occurring or there is a mistake in the data.
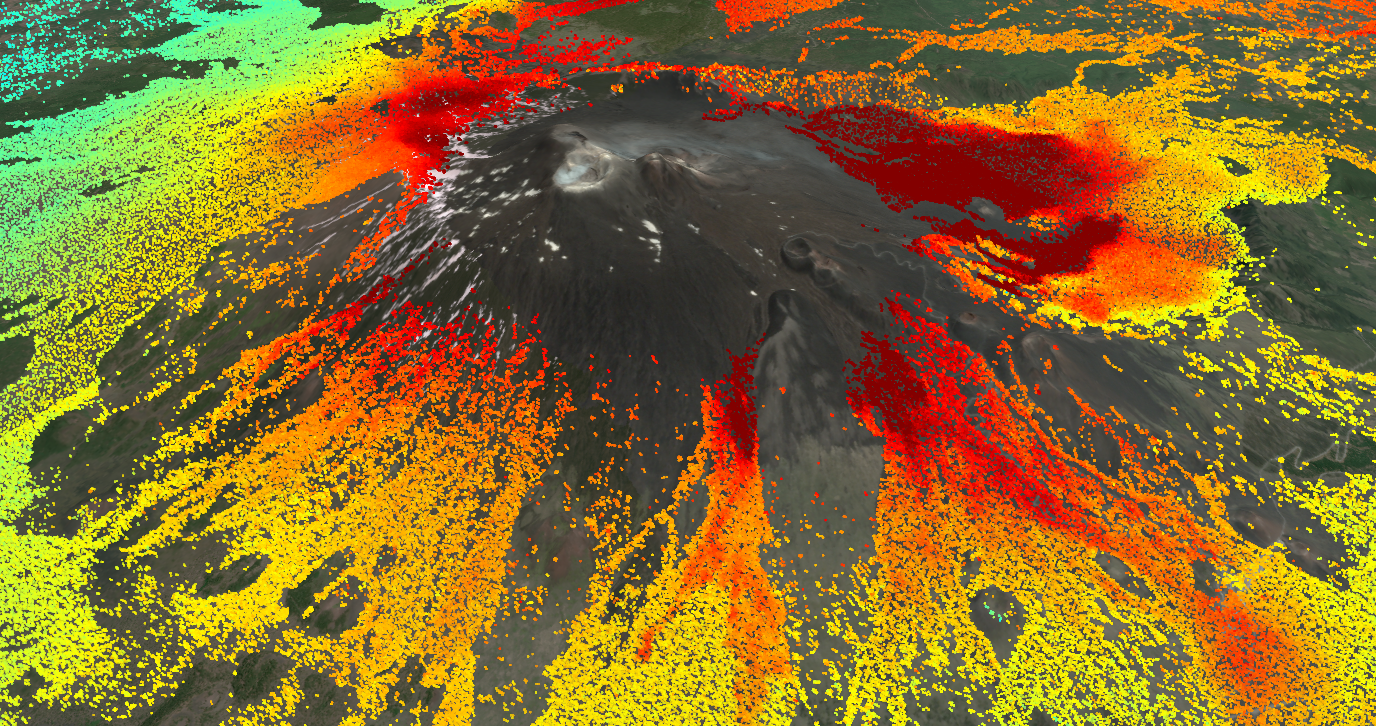
Let’s look at a case study on volcanic monitoring. By plotting residuals, scientists can easily spot sudden spikes in deformation that deviate from the expected trend. These spikes could signal increased volcanic activity or magma movement. This early warning system is essential for assessing risks and preparing for potential disasters.
Seamless Integration with Popular SAR Tools
InSAR Explorer is designed to work well with leading InSAR data processing tools, including SARvey, MintPy, MiaplPy, GMTSAR, and EGMS. This makes it easy to import time series data from different sources and formats, which makes the workflow smoother and reduces the need for manual data conversion.
The plugin supports both vector and raster data structures, so you can work with shapefiles, geopackages, or grd files, depending on the output format of your chosen processing tool. This flexibility makes InSAR Explorer a valuable asset for projects of all sizes and complexities.
Conclusion: Empowering InSAR Analysis with Intuitive Tools
InSAR Explorer is more than just a visualization tool—it is a comprehensive solution for exploring and interpreting InSAR time series data. By offering dynamic visualization, reference point setting, model fitting, and residual analysis, the plugin empowers users to uncover valuable insights into surface deformations and structural changes.
Whether monitoring urban infrastructure, assessing landslide risks, or studying environmental phenomena, InSAR Explorer is an indispensable tool for geospatial professionals. With its seamless integration into QGIS and compatibility with major SAR processing tools, it is set to play a pivotal role in advancing InSAR analysis and promoting data-driven decision-making in diverse applications.
If you’re ready to elevate your InSAR analysis capabilities, give InSAR Explorer a try – and unlock the full potential of SAR data in your projects.
Read more and subscribe to our monthly newsletter!

