Maps have long been more than just tools for navigation; they are windows into the world’s history, culture, and artistic expression. From the meticulously crafted maps of the Renaissance to contemporary digital masterpieces, maps offer a unique blend of utility and beauty. This article explores the aesthetic elements that make maps captivating, showcasing a curated selection of historical, artistic, and modern digital maps.
Historical Maps Considered as Works of Art
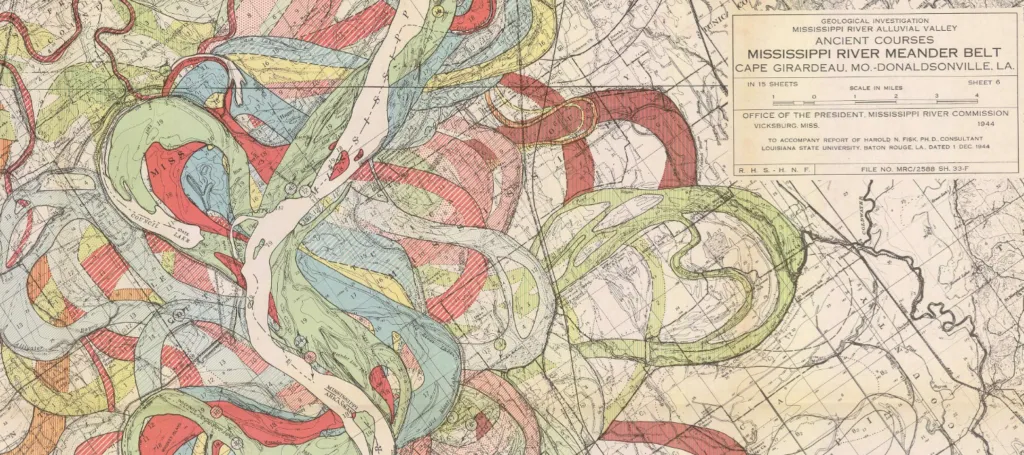
Historical maps are a testament to the craftsmanship and artistry of past cartographers. The David Rumsey Historical Map Collection is a treasure trove of over 132,000 maps, including rare and beautifully detailed works from the 16th to the 21st century. These maps not only chart geographical knowledge but also reflect their times’ artistic styles and cultural contexts.
Browsing through collections of Old World maps reveals the extraordinary craftsmanship of early cartographers. Additionally, interactive globes featuring old-style maps offer a glimpse into historical geography in a dynamic way.
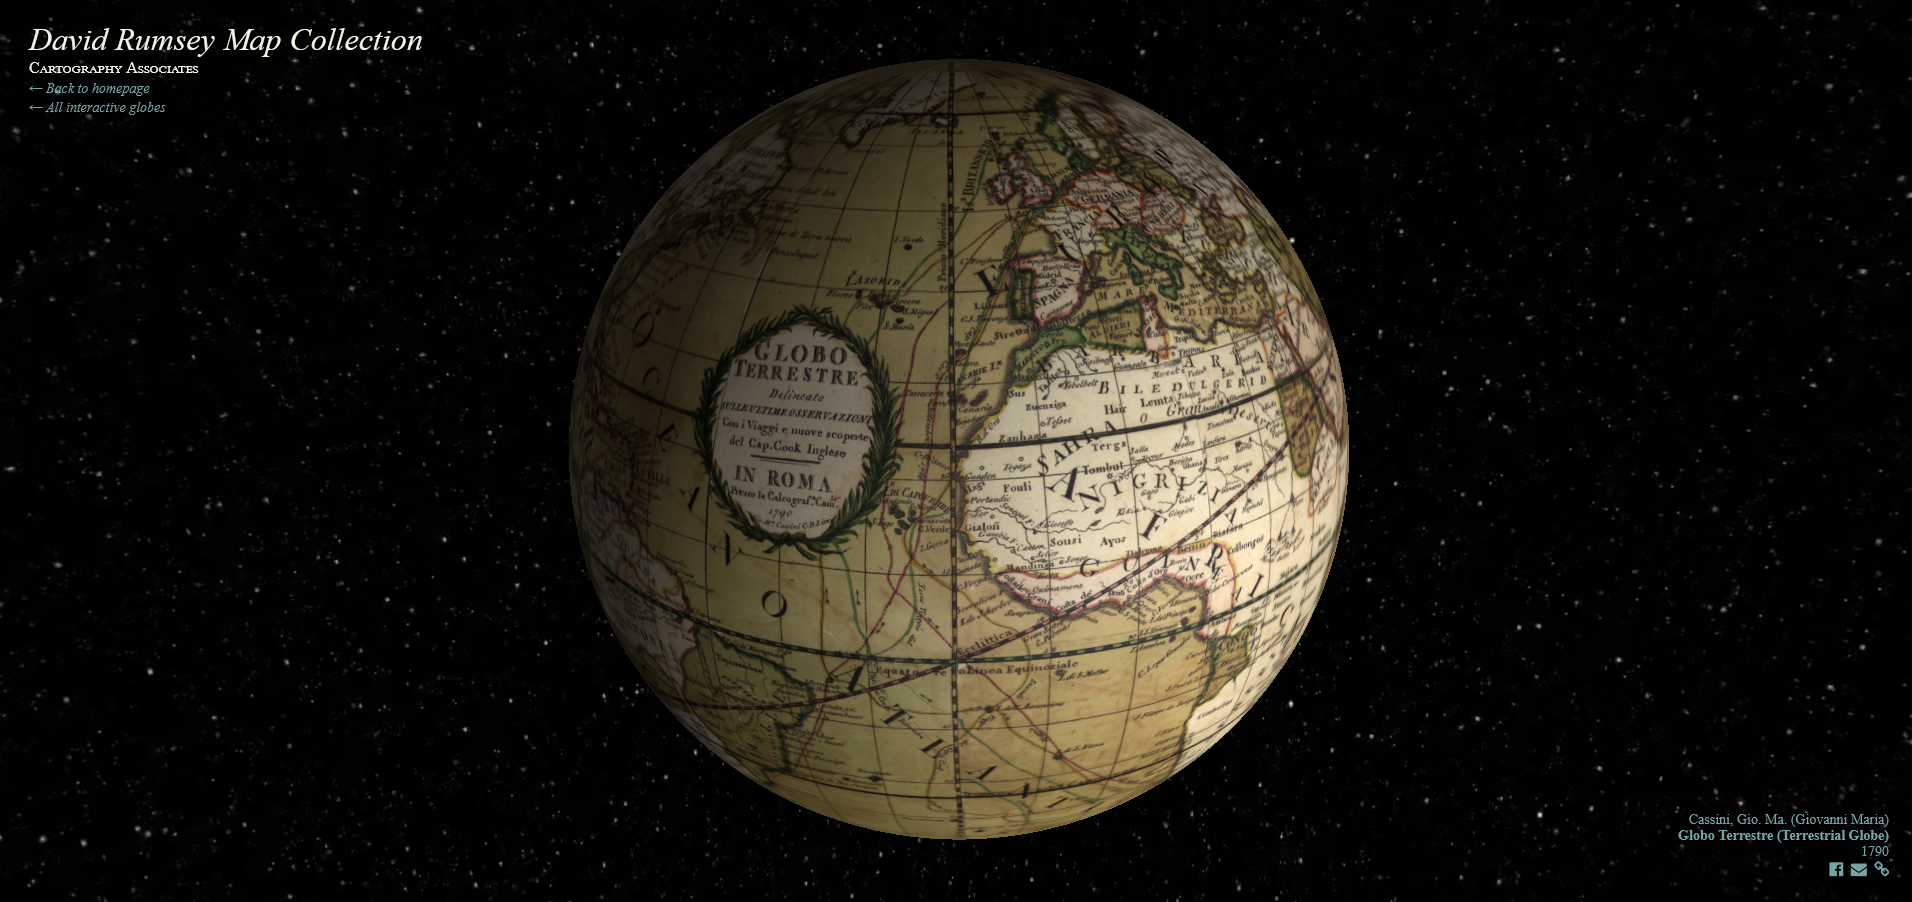
Source: David Rumsey Map Collection
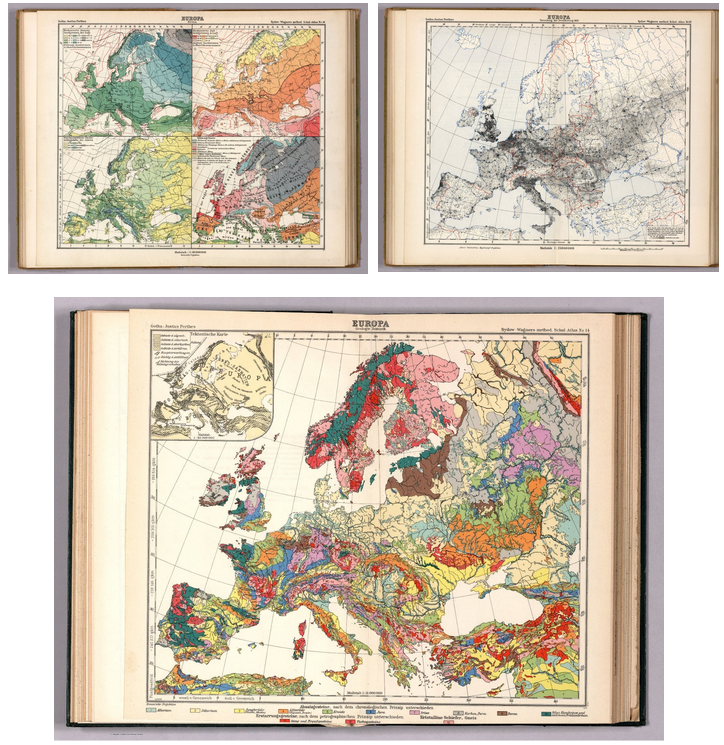
Atlas Map of Europe, 1940. Source: David Rumsey Map Collection
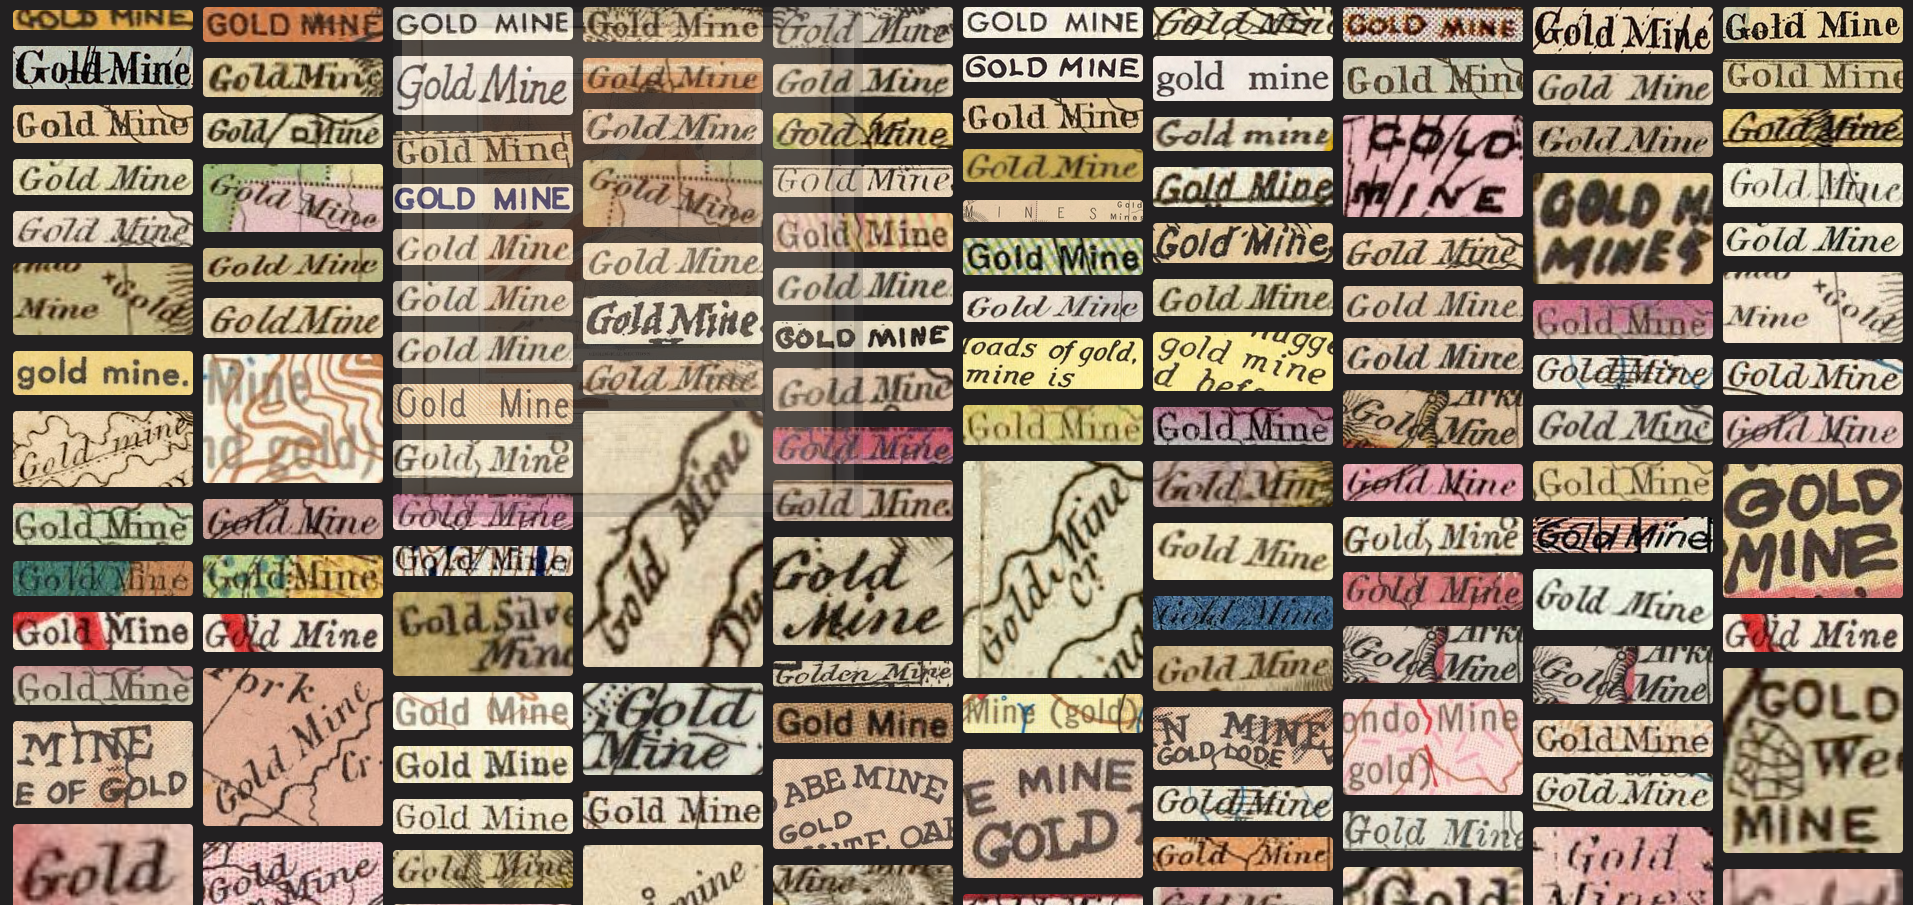
The mozaic of labels. Source: David Rumsey Map Collection
Map of the canton of Zurich completed in 1667. Source: David Rumsey Map Collection
The Timeless Artistry of Historical Cartography
Cartographic designs in the past were often considered works of art, celebrated for their intricate details, aesthetic beauty, and the skilled craftsmanship of the cartographers.
The advent of digital technology has ushered in a new era for these cartographic treasures. Today, these masterpieces can be preserved in digital form, ensuring their longevity and accessibility for future generations. This digital conservation effort safeguards not only the physical integrity of these maps but also the rich historical and cultural heritage they embody.
Thanks to the internet, anyone can now browse through these stunning historical maps, appreciating their artistic value from anywhere in the world. From the comfort of their homes, enthusiasts and scholars alike can explore intricate details and peer through a window into the geography of bygone eras.
Map of Algérie, Cap de Fer, 1928. Source: http://igrek.amzp.pl/
Lativian map of Daugavpils, 1924. Source: http://igrek.amzp.pl/
The Evolution of Cartography: Works of Art to Modern Precision
The art of mapmaking has undergone a remarkable transformation, transitioning from ornate works of art to accurate digital representations. This evolution reflects the changing needs of society and the advancements in technology that have revolutionized the field of cartography.
In centuries past, mapmakers were as much artists as they were geographers. Historical cartographers like Blaeu and de Wit were not only skilled craftsmen but also artists who infused their work with creativity and attention to detail.
The creation of beautiful maps requires a blend of technical skill, artistic talent, and a deep understanding of geography. Mapmakers, or cartographers, are often driven by a passion for exploration and a desire to convey complex information in a visually appealing way.
As technology advanced, the focus of cartography shifted from artistic expression to precision and functionalism. Modern cartography embraces digital tools and techniques that prioritize accuracy and accessibility.
Geographic Information Systems (GIS), Global Positioning Systems (GPS), and satellite imaging have become integral to the mapmaking process, allowing for unprecedented levels of digital and real-time updates.
City Atlas De Wit Haarlem, 1698. Source: kb.nl
Today, cartographers continue to push the boundaries of the field, using digital tools to create maps that are both functional and beautiful.
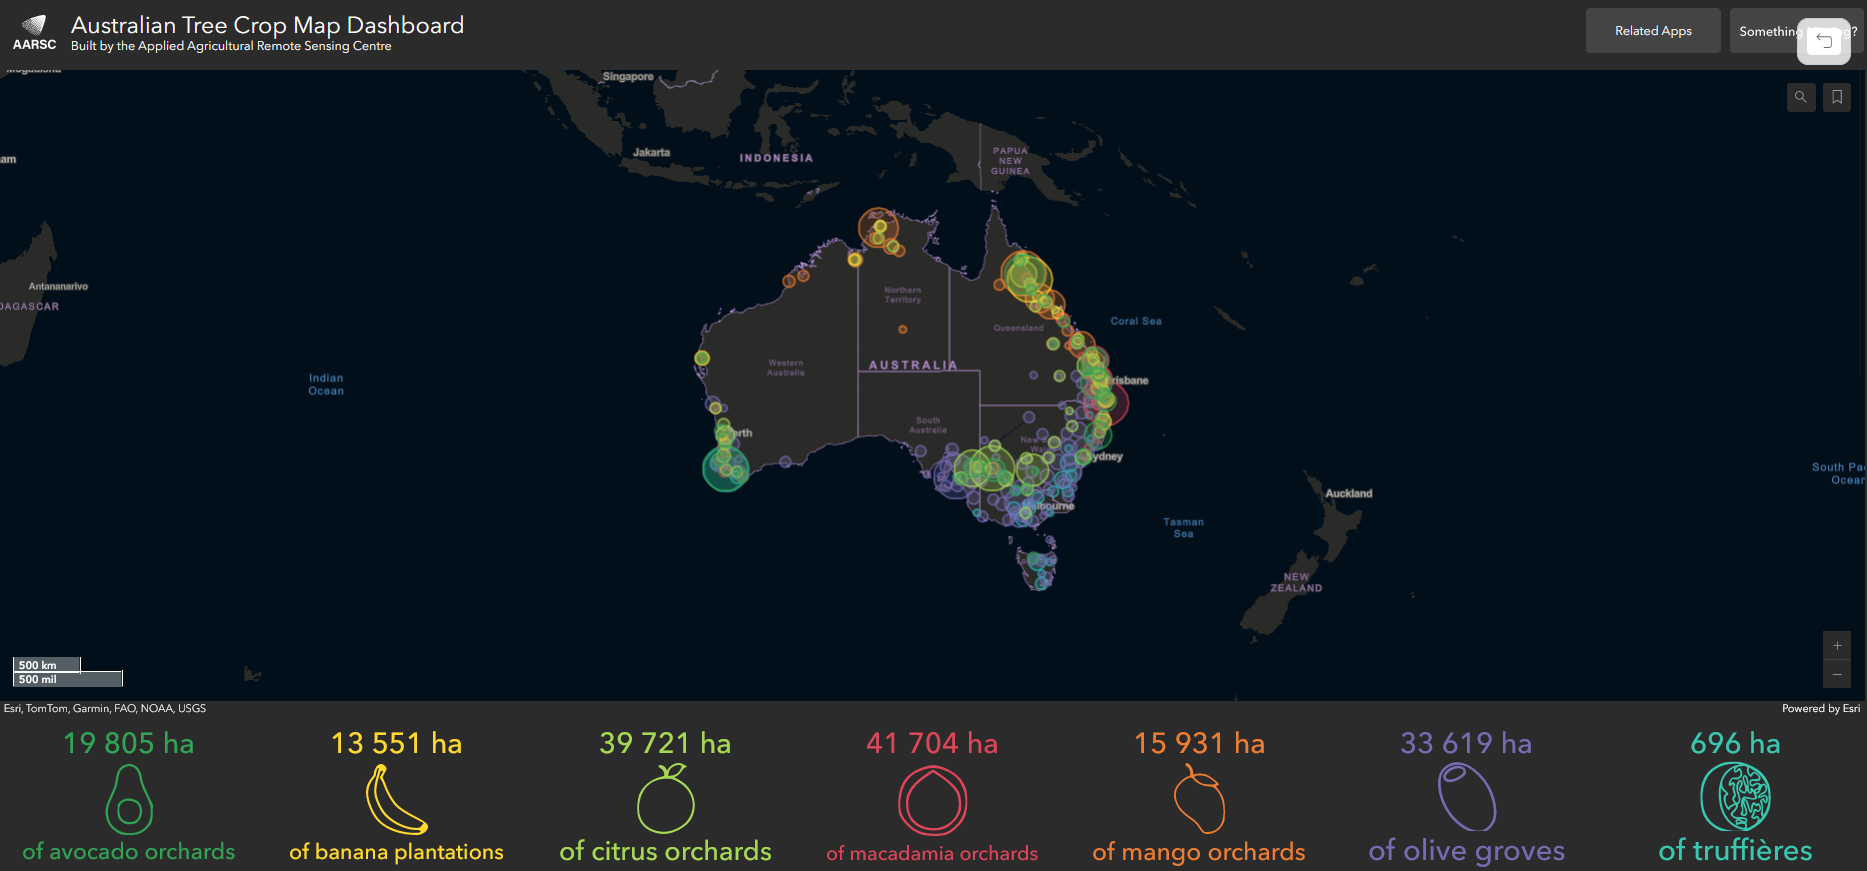
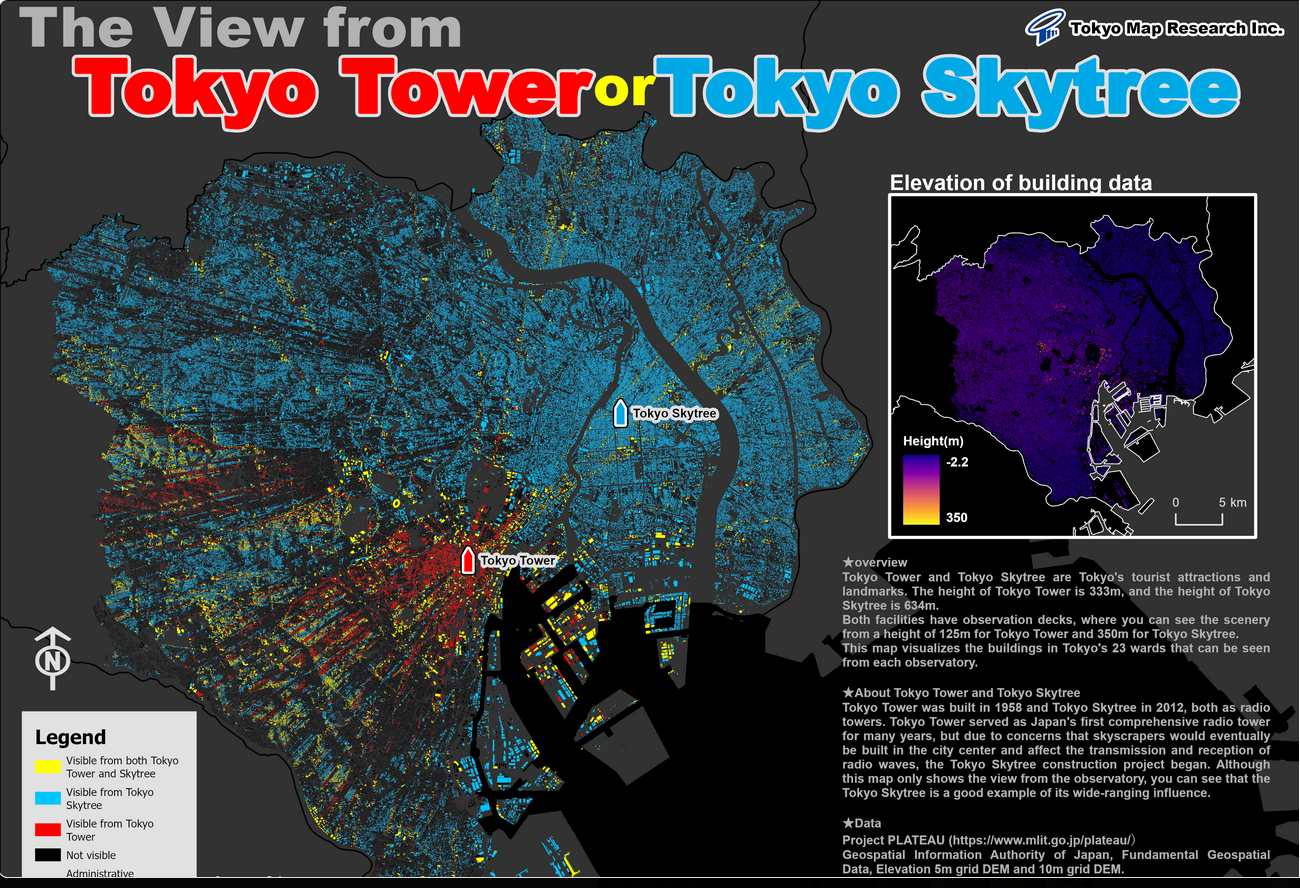
The Esri Map Gallery stands as a testament to this evolution, showcasing innovative maps created by a global community of GIS professionals. These maps leverage advanced technology to produce visually stunning and informative data representations, making complex information accessible and engaging.
The gallery features a diverse array of thematic maps covering topics such as climate change, urban development, and population demographics. Each map not only conveys essential data but does so with a high degree of aesthetic appeal, demonstrating that modern cartography can be both informative and visually captivating.
The dedication to preserving and advancing the art of mapmaking is evident in collections, where cartographers and historians work together to digitize and share rare maps with the public. This passion ensures that maps remain a vital part of our cultural heritage and a source of inspiration for future generations.
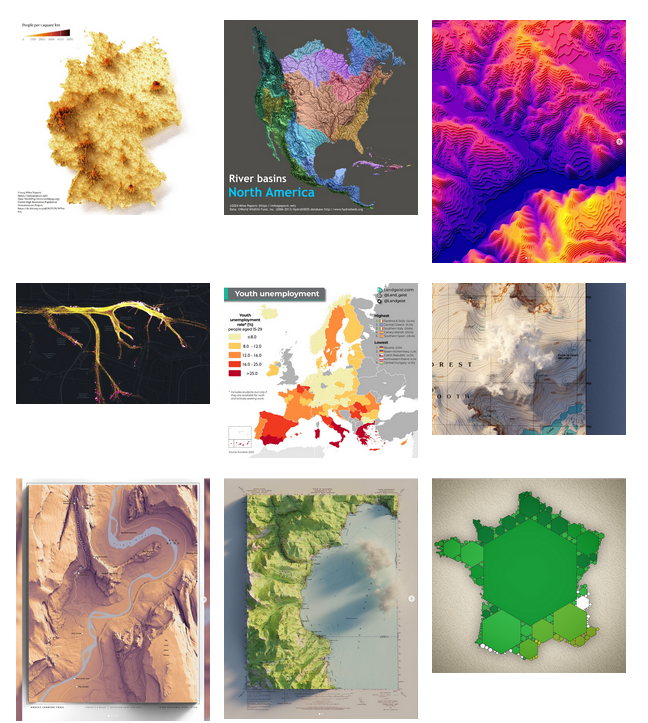
Source: Esri Map Gallery
Source: Esri Map Gallery
Maps are going viral!
Maps are gaining significant popularity on social media platforms, particularly Instagram.
The visual nature of cartography lends itself well to Instragram’s image-centric platform, allowing map enthusiasts and creators to share visuals with a wide audience.
We had a browse and discovered beautifully designed maps and cartographic designs. Here are the most active Instagram profiles that are worth following if you’re interested in the beauty of maps.
Most active Instagram profiles focused on cartography
Modern cartography
Maps are more than just tools for navigation; they are artistic expressions that capture the imagination and convey rich stories about our world.
From the details of historical maps to the innovative designs of modern digital creations, maps continue to fascinate and inspire. Historical maps offer a window into the past. Each map tells a story of exploration, discovery, and artistic expression.
These cartographic designs, once solely available in paper form, have transformed into digital formats, allowing for broader accessibility and preservation.
Today, thanks to digital technology, these maps can be recorded and browsed online, ensuring their beauty and historical significance are appreciated by future generations. As we move further into the digital age, the art of mapmaking will continue to adapt and thrive, promising new ways to visualize and understand our world.
Did you like the article? Read more and subscribe to our monthly newsletter!


#Contributing Writers


Next article
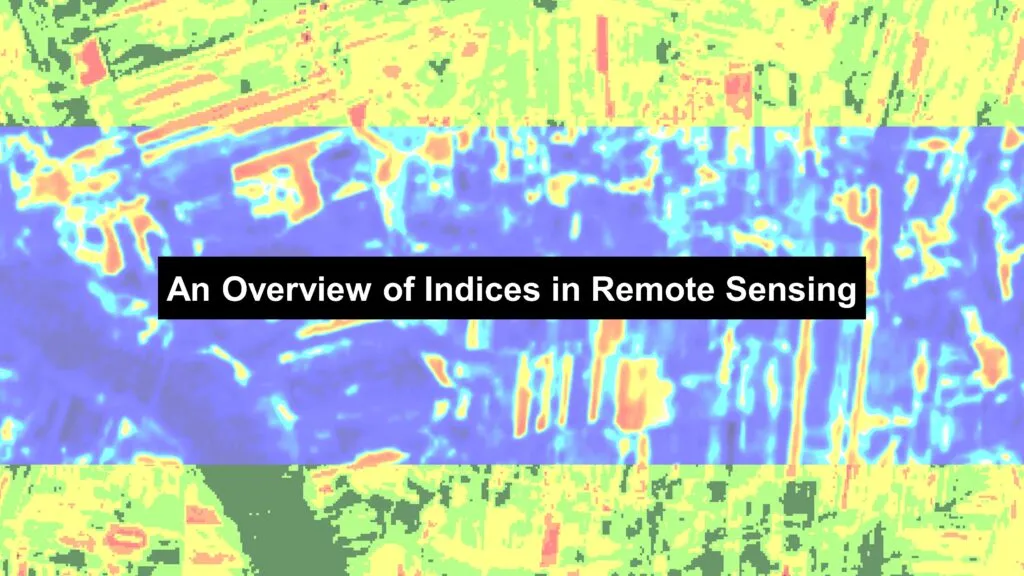
Remote sensing has revolutionized the way we monitor and analyze the Earth’s surface. One of the key tools in this field is the use of spectral indices. These indices enhance the contrast between different types of land cover and are crucial in monitoring environmental health, agriculture, and forestry.
What are Spectral Indices?
Spectral indices are formulas that combine reflectance data from two or more spectral bands to highlight specific features or conditions on the Earth’s surface. These carefully crafted equations serve to amplify the distinctions between various types of land cover, providing us with valuable insights.
Environmental Monitoring: A Multifaceted Approach
Spectral indices have become indispensable in monitoring a wide array of environmental parameters:
– Vegetation Health: Indices like NDVI and Enhanced Vegetation Index (EVI) are used to assess plant health and productivity. EVI refines NDVI’s approach, offering improved sensitivity in densely vegetated areas while minimizing atmospheric influences.
– Water Content: The Normalized Difference Water Index (NDWI) detects water bodies, tracking changes and trends over time with remarkable precision.
– Soil Properties: The Soil-Adjusted Vegetation Index (SAVI) is a vegetation index designed to minimize the influence of soil brightness when assessing vegetation cover, especially in areas with low vegetation density.
The Power of Normalization
At the heart of many spectral indices lies the concept of normalization. This process involves adjusting values measured on different scales to a common scale. By doing so, normalization:
- Mitigates the effects of varying measurement conditions.
- Enhances data comparability across diverse datasets.
- Produces dimensionless indices, allowing for consistent interpretation.
This process involves mathematical operations that standardize the data, often using ratios or differences, to ensure that the indices are dimensionless and comparable across different datasets and conditions. For example, the Normalized Difference Vegetation Index (NDVI) normalizes the difference between near-infrared and red reflectance values to highlight vegetation health consistently across different environments. That’s why NDVI index values are between -1 and 1.
Applications in Various Fields
Transforming Agriculture
In agriculture, spectral indices have emerged as essential tools for precision farming.
- Crop Health Monitoring: Indices like NDVI and EVI can serve as early warning systems, identifying stressed crops due to water scarcity or pest invasions.
- Disease detection: For instance, the timely identification of wheat rust through spectral analysis allows farmers to intervene promptly, significantly reducing potential yield loss.
- Resource Management: Spectral indices aid in optimizing water usage and other agricultural inputs, promoting sustainable farming practices.
Advancing Forestry Management
The forestry sector has witnessed a paradigm shift with the adoption of spectral indices:
- Fire Impact Assessment: The Normalized Burn Ratio (NBR) has become crucial in evaluating forest fire severity and monitoring post-fire recovery.
- Reforestation Planning: By combining NBR with high-resolution satellite data from Landsat and Sentinel-2, studies have shown that detailed insights into both the impact of forest fires and the effectiveness of recovery efforts can be gleaned. Forestry experts can now develop more effective reforestation strategies as a result.
- Ecosystem Health Tracking: These indices provide a comprehensive view of forest health, enabling proactive management and conservation efforts.
Enhancing Climate Science
Spectral indices are enhancing our understanding of complex environmental systems and empowering decision-makers to implement more effective and sustainable strategies.
- Land Cover Dynamics: In climate science, spectral indices are used to monitor changes in land cover and vegetation cover, providing crucial data on global environmental shifts.
- Snow Cover Monitoring: The Normalized Difference Snow Index (NDSI) offers invaluable insights into seasonal snow cover variations, a key indicator of climate change impacts.
- Pollution Impact Studies: Innovative indices like the Aerosol Free Vegetation Index allow us to assess vegetation health in areas affected by atmospheric aerosols, providing insights into the effects of pollution on vegetation.
Spectral Bands and Formulas
Spectral indices are calculated using specific spectral bands. Here are some common indices and their formulas:
– NDVI:
![]()
– EVI:
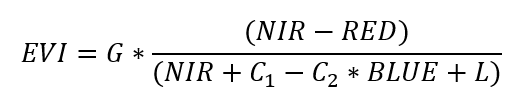
G = Gain factor (typically 2.5),
C1 and C2 = Coefficients for atmospheric correction (typically 6 and 7.5),
L = Canopy background adjustment (typically 1).
– SAVI:
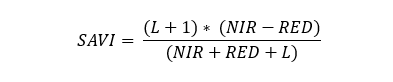
where L is a canopy background adjustment factor.
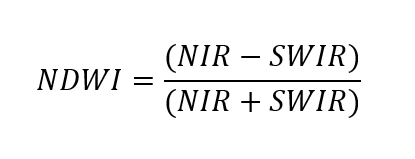
– Normalized Difference Water Index (NDWI) is used to monitor changes in water content of vegetation and soil:
– Vegetation Condition Index (VCI) measures the relative greenness:
![]()
– Normalized Difference Drought Index (NDDI) combines NDVI and NDWI to better capture drought conditions.
![]()
These formulas use reflectance values from specific spectral bands (e.g., red, NIR, blue, SWIR) captured by remote sensing instruments on satellites like Landsat and Sentinel.
Case Study: Detecting Drought’s Impact on Crops in Central Poland
Let’s explore the application of spectral indices to detect drought impact on crops in central Poland. Recent satellite imagery on Google Earth (from 24 May 2024) showcased noticeable color changes in agricultural fields, indicating the severe effects of a prolonged drought period due to low groundwater levels.
First, we downloaded Sentinel-2 imagery from SentinelHub, and then used additional features on the SentinelHub Browser to visualize various spectral indices.
Case study: Visualization on SentinelHub
The primary analysis was conducted using QGIS software, where several indexes, including NDVI, NDWI, EVI, and NDDI, were calculated to assess vegetation health and moisture content.
Each raster was individually styled to highlight different aspects of the drought’s impact. Vector layers of rivers were added to the analysis to compare areas at risk of drought with the proximity to water bodies.
This comparison provided insights into how low groundwater levels and drought conditions are affecting agricultural fields relative to their distance from rivers. The analysis successfully identified areas at risk of drought, demonstrating the utility of remote sensing and spectral indexes in agricultural monitoring and drought management.
Case study: Area of interest
Case study: Indexes comparison: NDVI vs. EVI
Case study: Indexes comparison: NDWI vs. NDDI
Case study: Indexes comparison: SAVI vs. VCI
Databases of Spectral Indices
Several databases compile spectral indices, providing valuable resources for researchers and practitioners:
– Index Database (IDB): This detailed database lists various spectral indices and the sensors suitable for calculating them. It also links indices to specific applications, making it easier to find the right index for a particular need.
– Awesome Spectral Indices on GitHub: This list includes a wide range of spectral indices used in remote sensing applications. It is continuously updated and includes contributions from researchers worldwide.
– USGS Landsat Surface Reflectance-Derived Spectral Indices: This database provides indices derived from Landsat data, available on demand for various applications.
As we look to the future of environmental monitoring and management, spectral indices are essential tools in remote sensing methods of understanding and protecting our impact on the planet.
By enhancing the contrast between different land cover types, these indices help to monitor and manage the Earth’s resources more effectively. The availability of extensive databases and continuous advancements in remote sensing technology ensure that spectral indices will remain at the forefront of environmental monitoring and management.
Did you like the article? Read more and subscribe to our monthly newsletter!

