Faster than Maps: How SAR Satellites Expose the Blind Spots of Commercial Cartography

Why commercial maps are falling behind global urbanization, and how multi-modal AI pipelines are the real solution?
If you drop a pin at coordinates 29.96, 31.73 on a standard commercial web map in 2026, you will find a fragmented picture. You might see a skeletal network of roads and scattered clusters of building polygons, but they are surrounded by vast, unexplained gaps of empty beige space. However, switch your view to a recent satellite image, and the missing puzzle pieces immediately appear: a highly dense, fully constructed urban fabric—complete with paved streets and residential blocks—filling every one of those gaps.
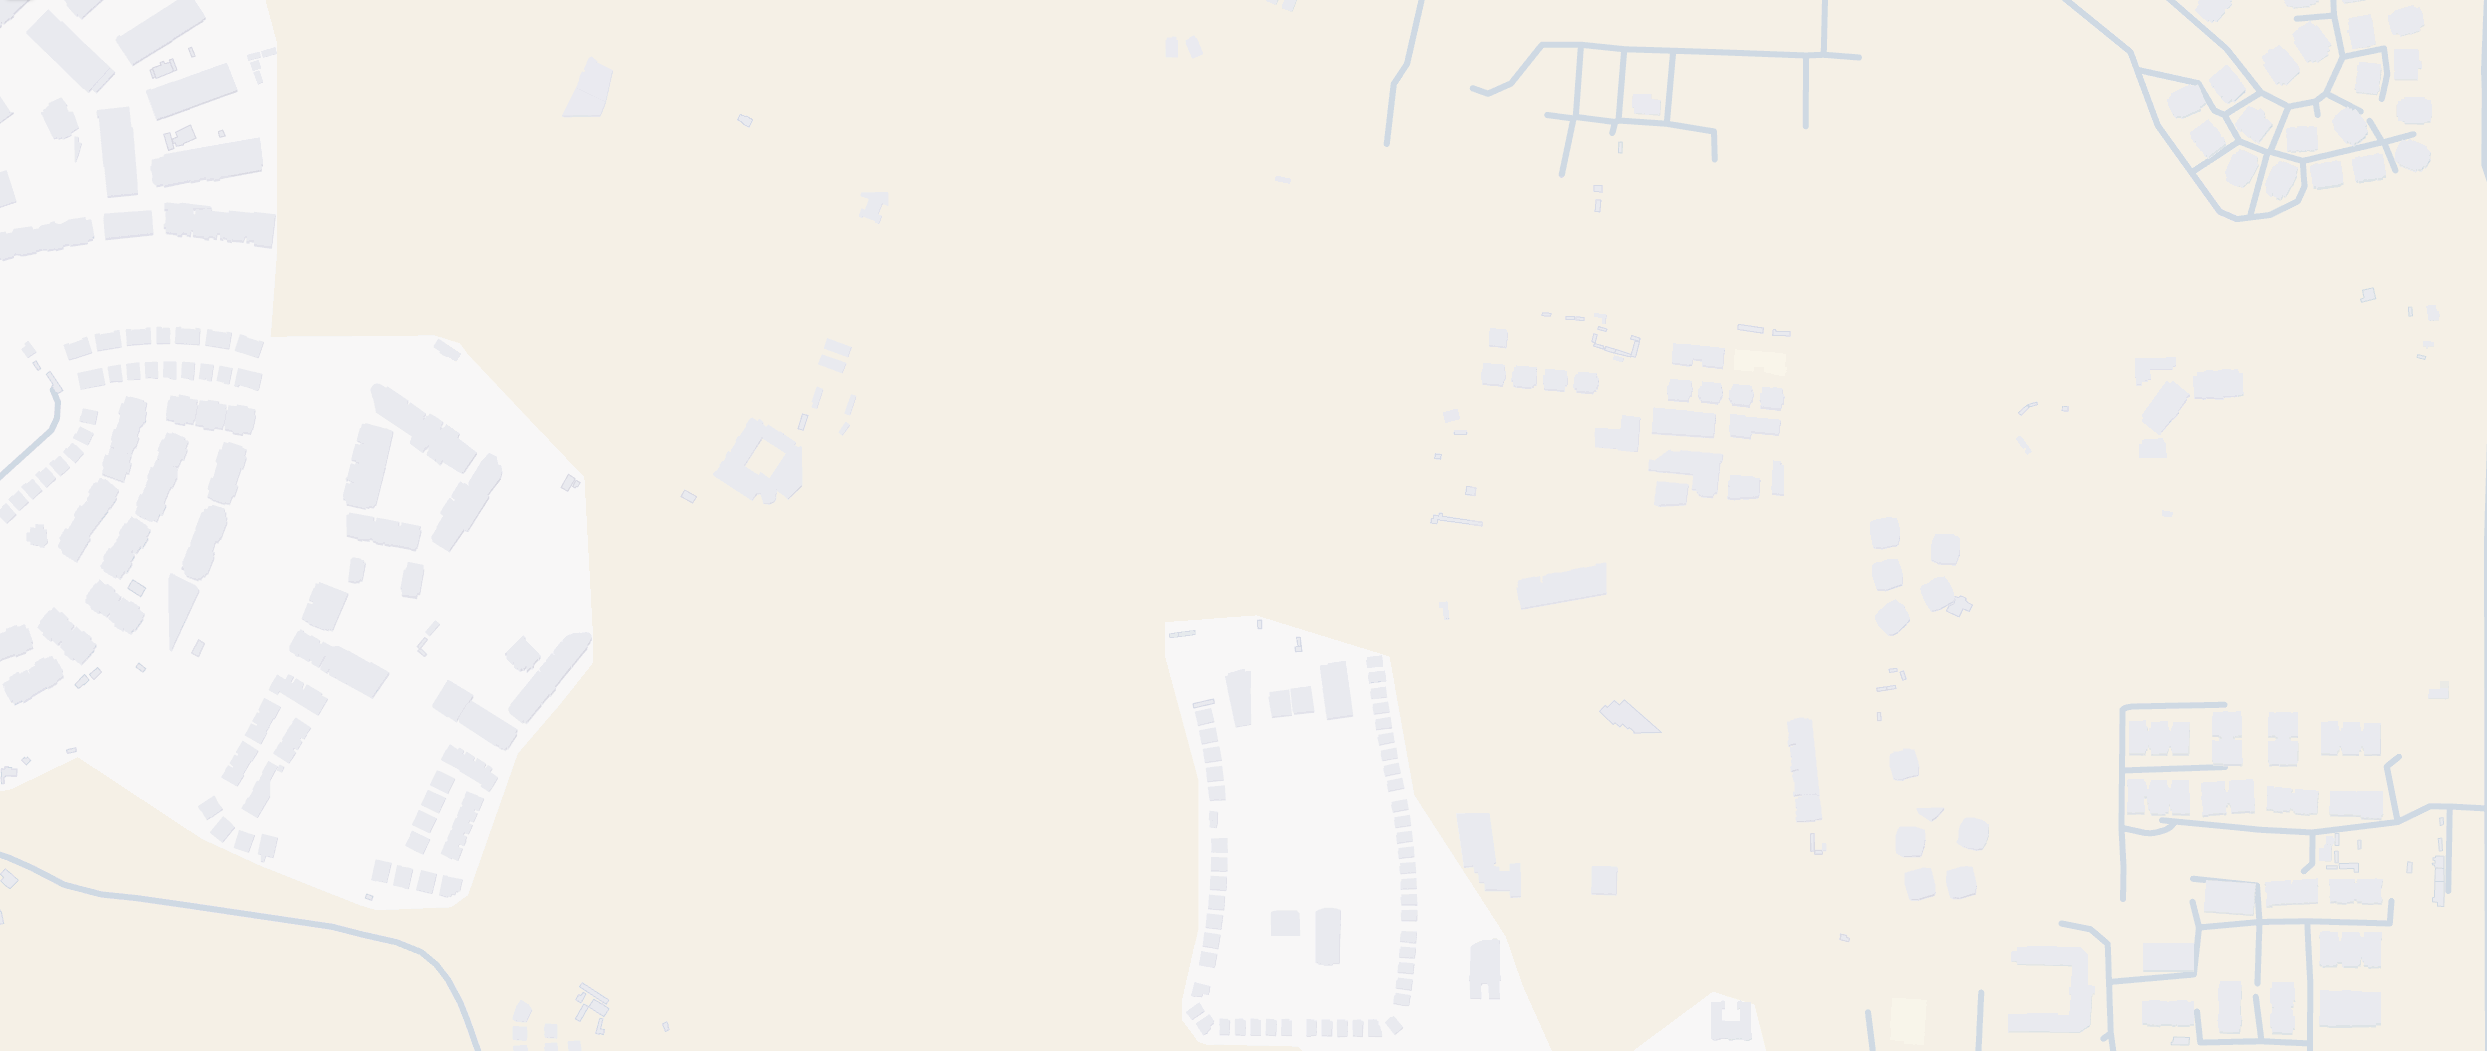
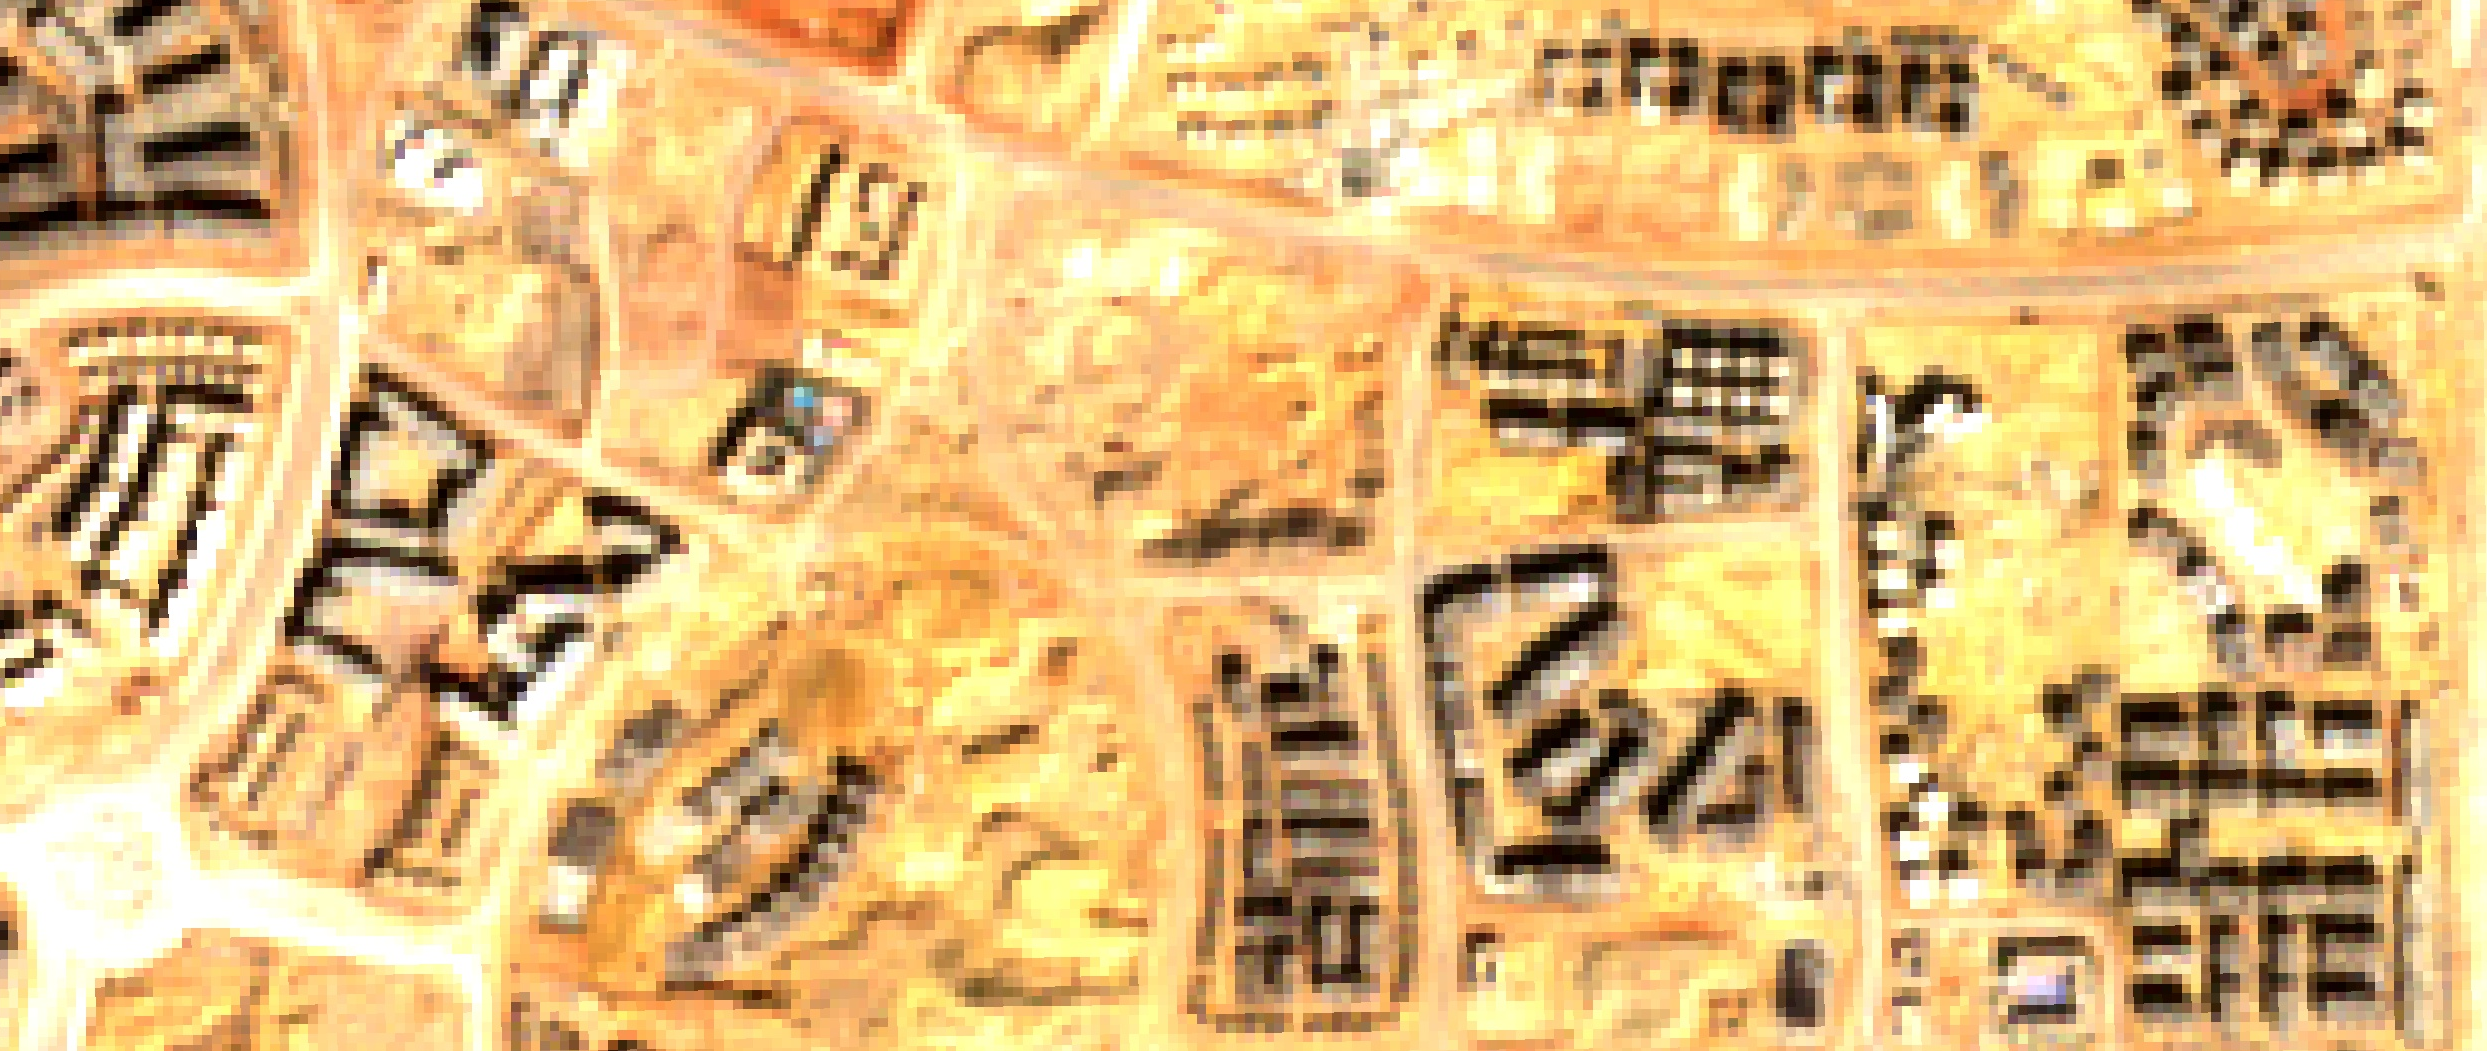
Figure 1: The Cartographic Lag in action (March 2026). Top: Commercial vector maps show an empty desert. Bottom: Sentinel-2 optical imagery reveals the true urban density in the exact same location
This is part of Egypt’s New Administrative Capital. Announced in 2015 with construction beginning in 2016, this megaproject has been growing in the desert for a decade. Yet, what we are witnessing on our screens is the ‘Cartographic Lag‘—a growing phenomenon where concrete is poured significantly faster than human mapmakers, traditional algorithms or new AI methods can update the vectors. When commercial cartography leaves entire neighborhoods invisible, how do we monitor the world’s rapid urban expansion? The answer doesn’t lie in drawing better maps, but in teaching machines to read the planet’s physical structure.
Why does this happen? Traditional map-making, even when assisted by modern Artificial Intelligence, relies heavily on optical satellite imagery. To update a vector map, an algorithm or a human contributor needs a perfectly clear, cloud-free photo to trace the outline of a new building and convert it into a neat polygon. However, commercial high-resolution satellites only revisit the same location occasionally, and the sheer scale of modern megaprojects quickly overwhelms this step-by-step approach. The result is a fragmented spatial database where the map becomes obsolete the moment the concrete dries—a problem that disproportionately affects the Global South—from the megaprojects of the Middle East to the rapidly expanding informal settlements of Latin America—, where rapid urbanization outpaces the commercial priorities of tech giants. Relying solely on optical extraction means we are always looking at the past.
To bypass this cartographic bottleneck, we must stop looking at colors and start measuring geometry. This is where Synthetic Aperture Radar (SAR) from satellites like Copernicus Sentinel-1 becomes a game-changer. Unlike optical cameras, radar sensors don’t care about clouds, weather, or daylight; they emit microwaves that bounce back strongly when hitting solid, human-made structures like steel and concrete.
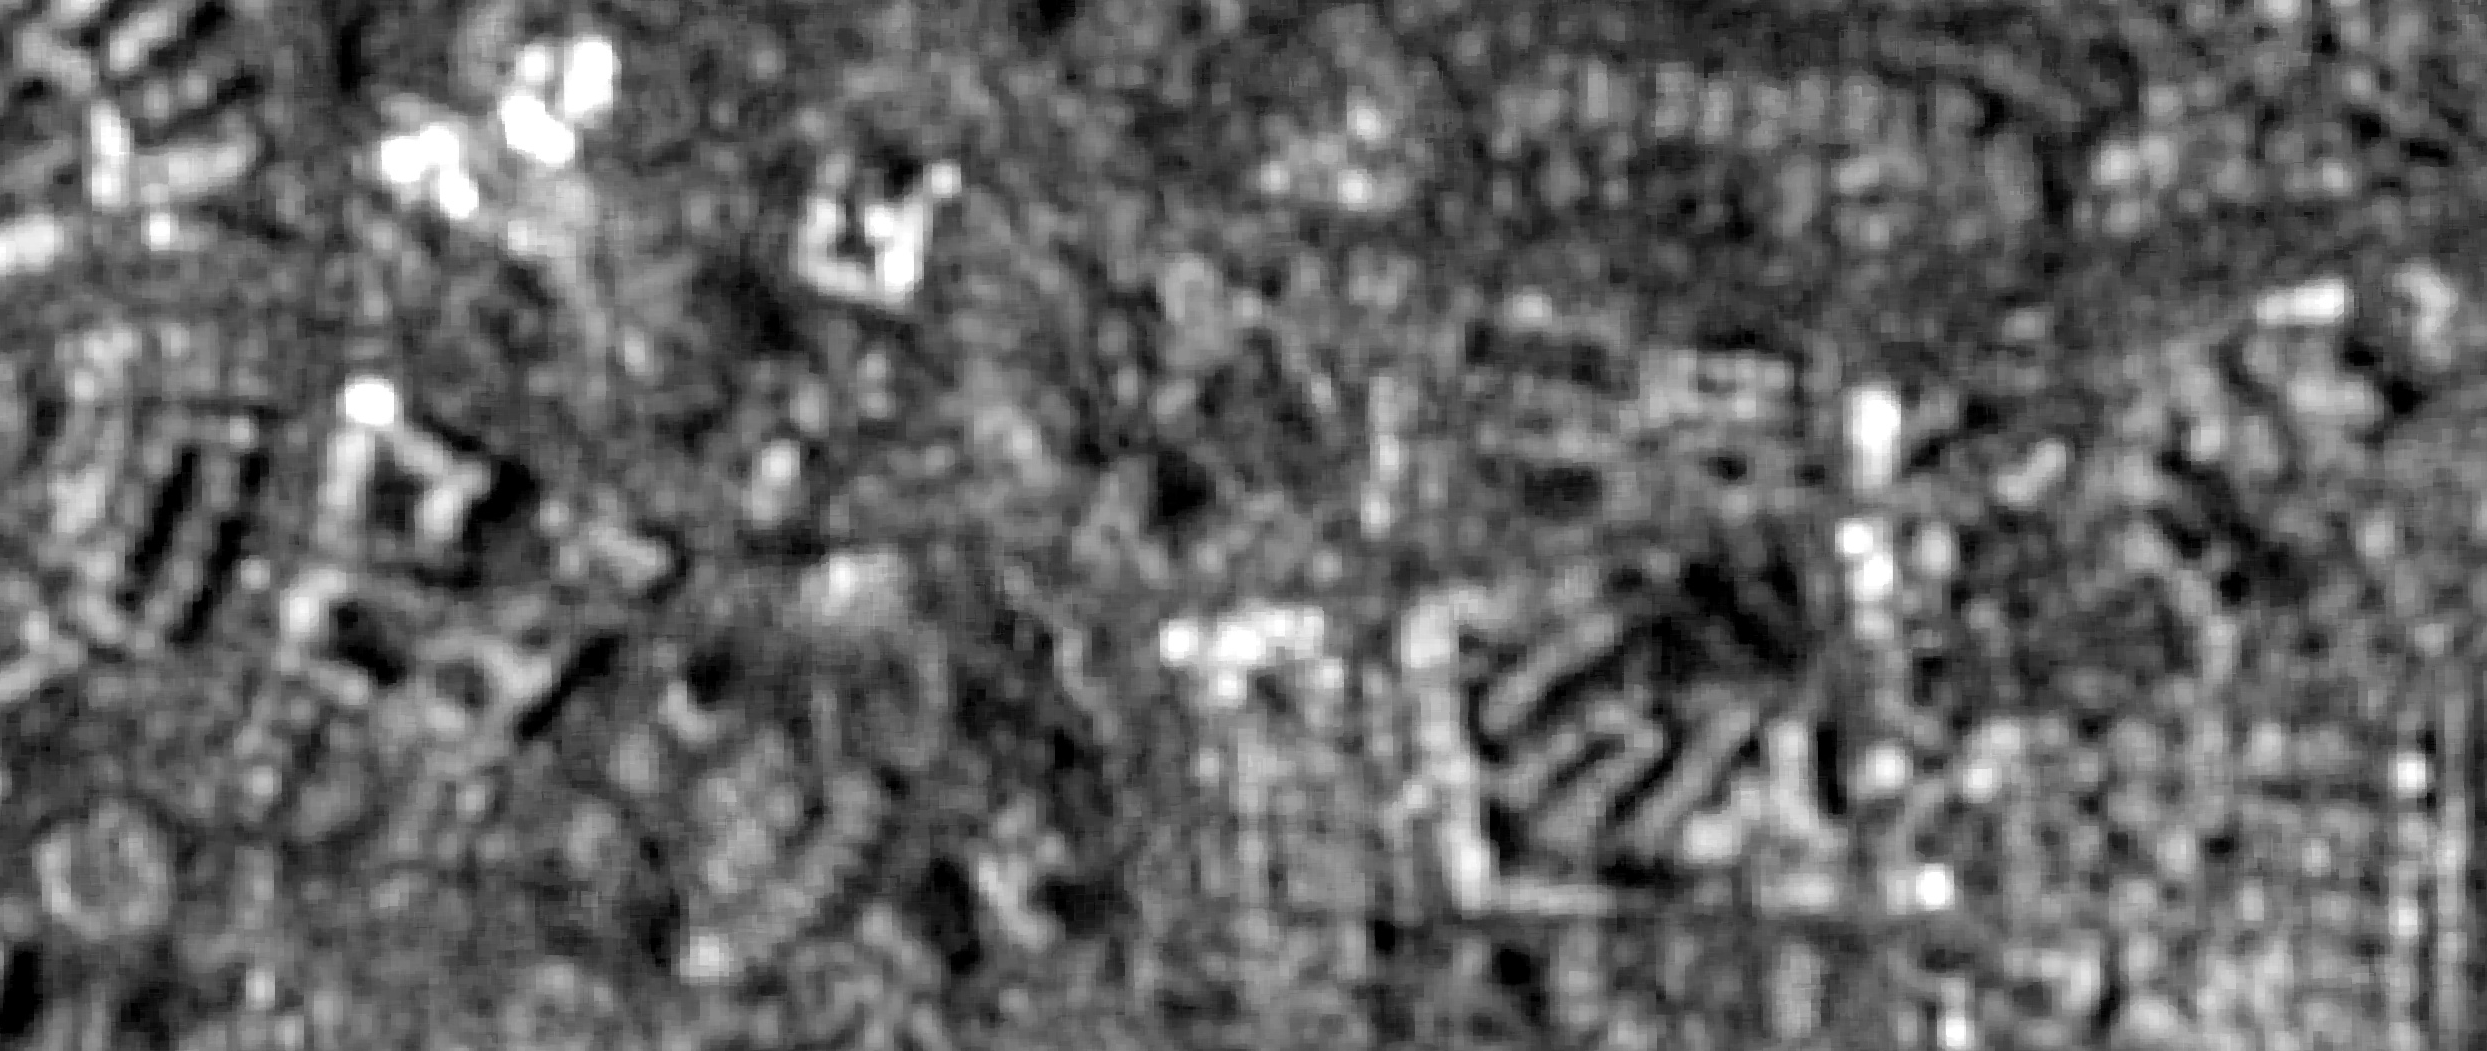
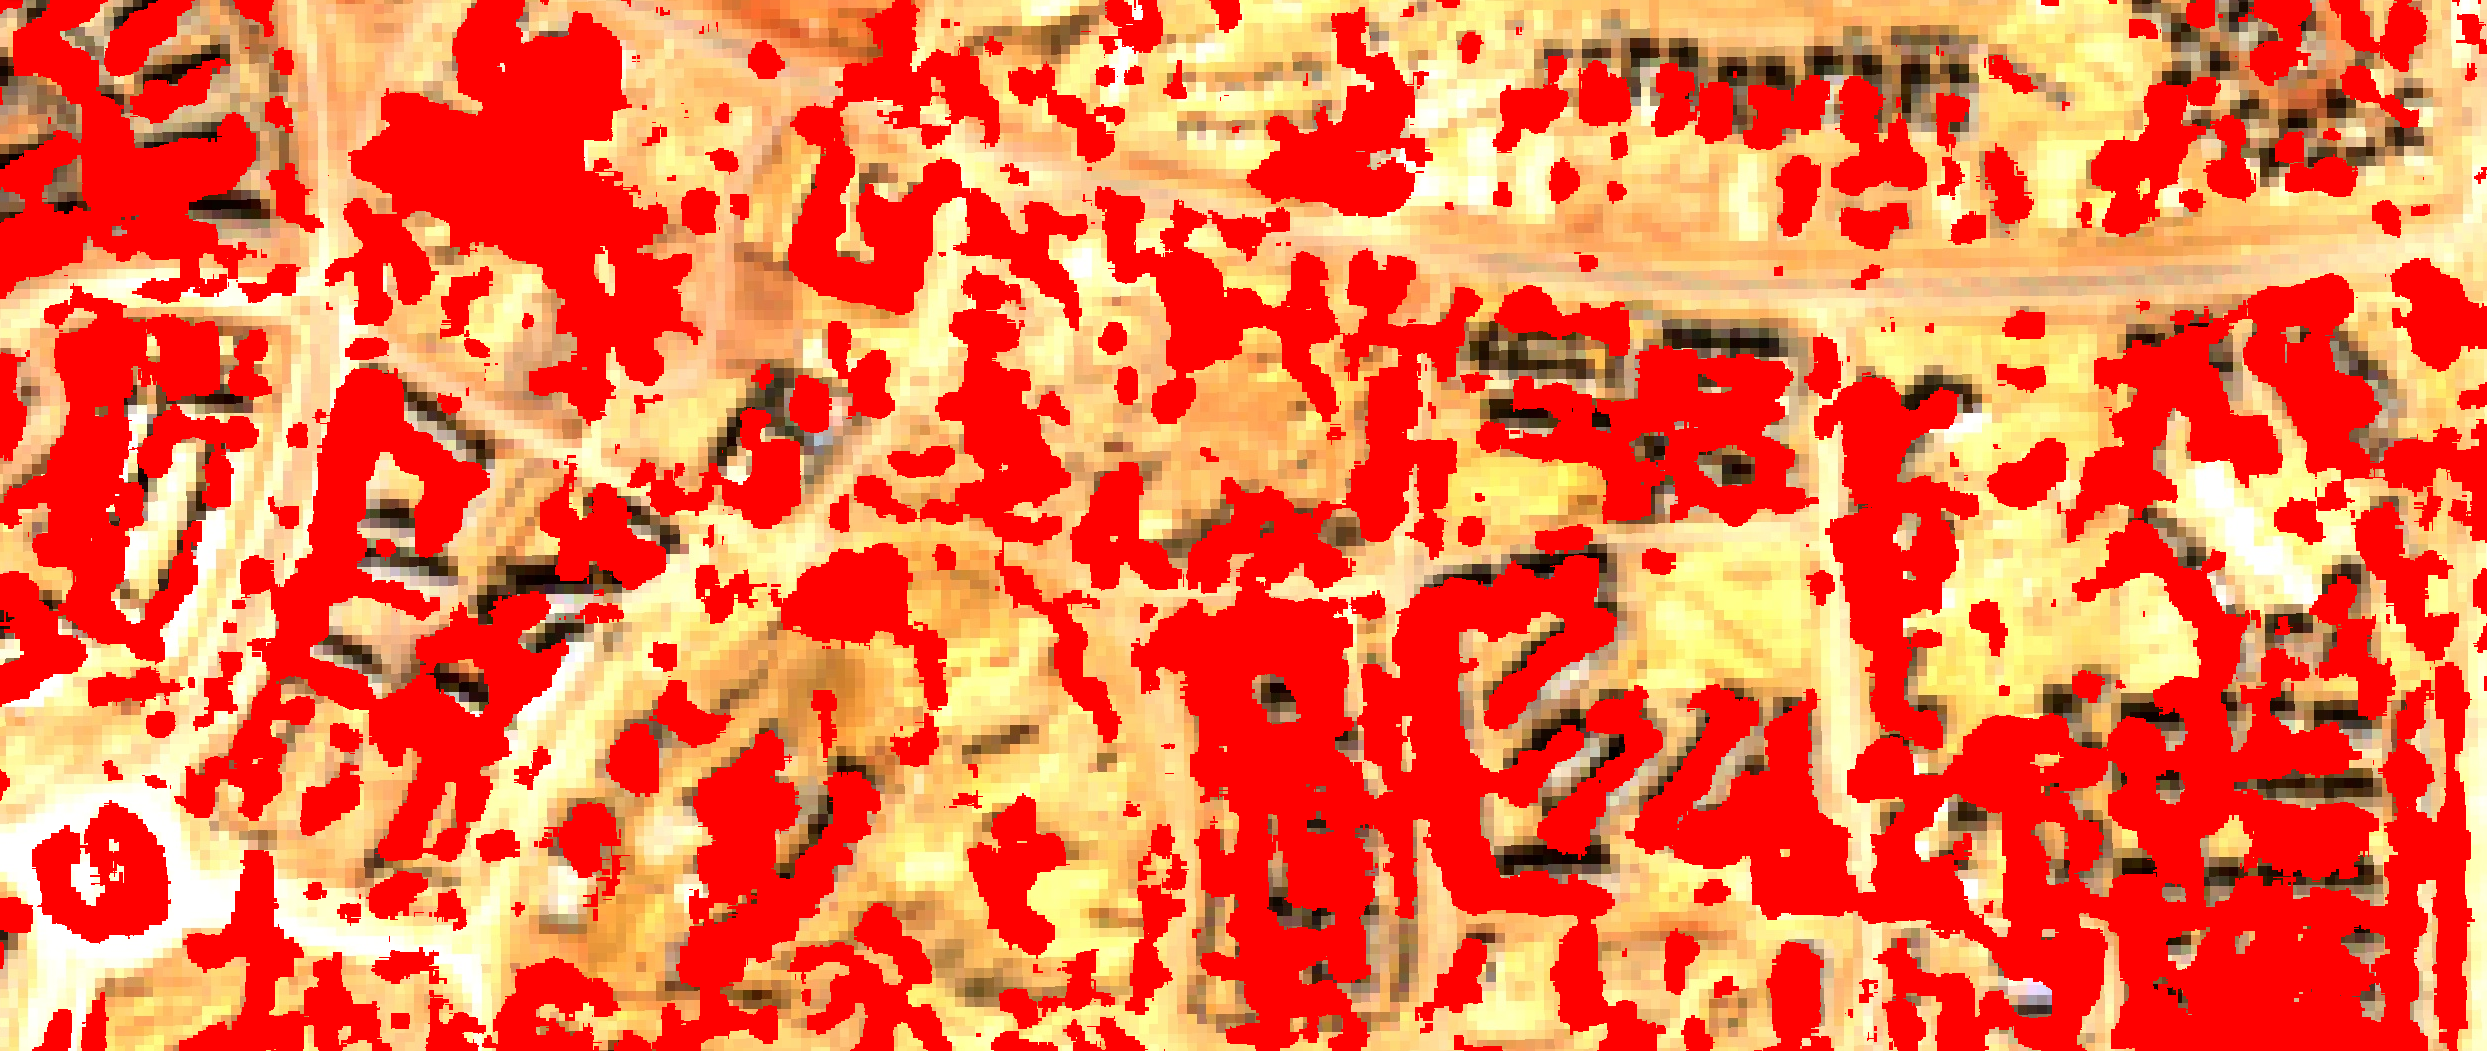
Figure 2: Real-time physical detection. Top: Raw Sentinel-1 SAR imagery capturing structural backscatter. Bottom: Simple thresholding (> -12 dB) isolated in red, instantly capturing human-made structures regardless of cloud cover or daylight but with many false positives.
Is this raw radar extraction a perfect, ready-to-use map? No. As seen in the red overlay, simple thresholding can pick up false positives like construction cranes, temporary scaffolding, or rocky terrain.
One might ask: why not just train a classic Machine Learning model to clean this up by fusing well-mapped cities and applying it here? While transfer learning is possible, classical models typically suffer from severe domain shift. A model trained on the consolidated urban fabric of existing cities will struggle to generalize to the unique spectral and radar signatures of a half-built megacity in the desert. Correcting this shift classically would require an exponential, manual effort to create new labeled data (polygons) for every new environment—reinventing the very human bottleneck we are trying to avoid. Achieving true global generalization requires self-supervised learning on petabytes of raw, unlabeled data.
This is exactly why the industry has shifted toward massive Foundation Models. So, why not simply hand the task over to advanced GeoAI like Google DeepMind’s AlphaEarth?
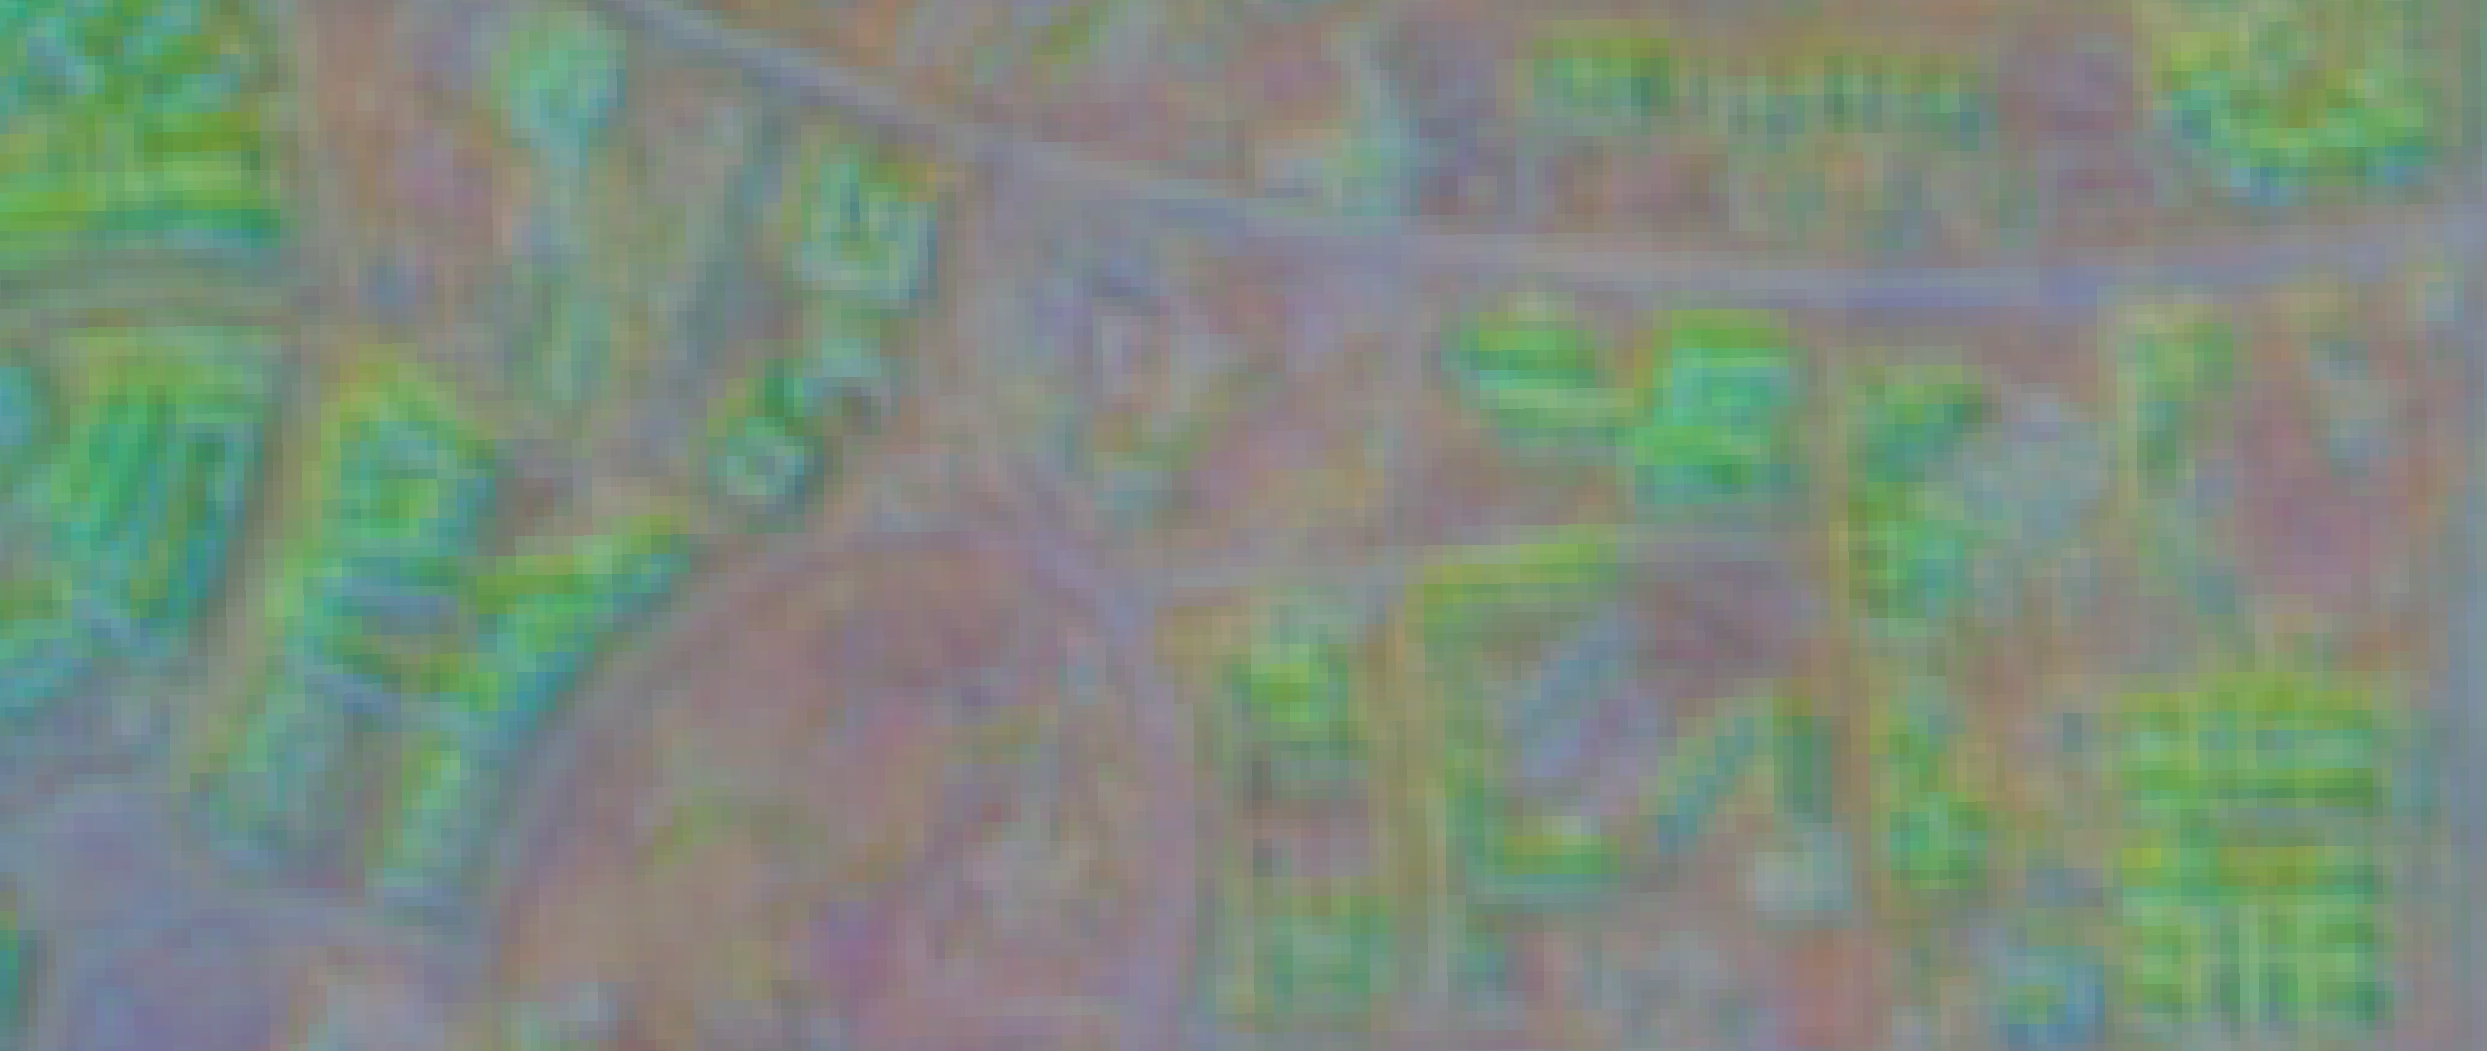
Figure 3: AlphaEarth 2025 multi-dimensional embedding (Bands A01, A16, A09). The GeoAI perfectly captures the consolidated urban context but misses the newest residential blocks visible in 2026, highlighting the temporal lag of annual foundation models.
If you look closely at the AlphaEarth visualization, you will notice a fascinating limitation. While the AI brilliantly captures the consolidated urban footprint in its multidimensional embedding, it completely misses the newly built grey residential blocks visible in the 2026 optical image. Why? Because computing 64-dimensional embeddings for the entire planet requires ingesting petabytes of multi-modal data, forcing these massive models to be published as annual composites. AlphaEarth is currently showing us its “memory” of 2025. It possesses deep contextual intelligence, but it operates with its own temporal lag.
The solution to the Cartographic Lag is not to choose between fast radar or smart AI, but to build a continuous, hybrid monitoring pipeline. We must use the high-frequency, cloud-penetrating SAR data as a real-time ‘tripwire’. When the radar detects fresh concrete today (2026) in an area where the latest GeoAI baseline (2025) sees only desert, it flags an immediate discrepancy. The system can then clean the noise, cross-reference it with the AI’s contextual knowledge, and instantly output accurate urban vectors. To keep up with the megacities of tomorrow, we must transition from manually drawing static maps to continuously computing living infrastructure.
Try it yourself: Visualizing the Cartographic Lag
This article proposes a theoretical hybrid pipeline to solve the Cartographic Lag. To help you visualize the exact problem we are trying to solve, I have written a Google Earth Engine script that overlays the real-time physical backscatter of Sentinel-1 (2026) with DeepMind’s AlphaEarth embeddings (2025).
Read the code: You can review the exact data extraction logic in this GitHub Gist: https://gist.github.com/rinvictor/93806c694118daf348556c4ee134e75a
Run the interactive map: You don’t need to set up a local environment or write any code to see this in action. Click the link below to open my public GEE workspace and explore the Cartographic Lag in real-time in our sample zone: https://code.earthengine.google.com/06b7710445999e0dbf6a3f961a215aef
Did you like this post? Read more and subscribe to our monthly newsletter!


#Contributing Writers


Next article
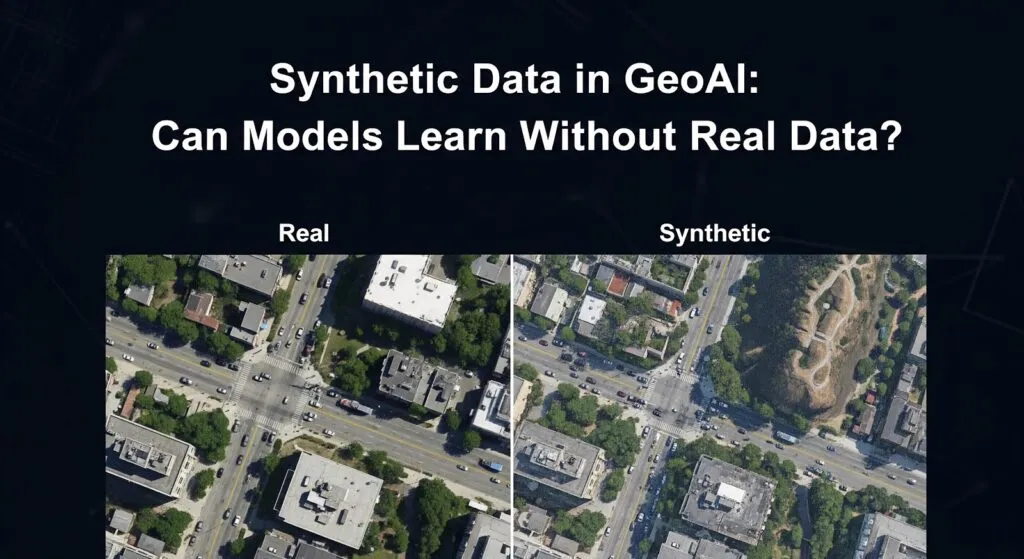
Synthetic Data in GeoAI: Can Models Learn Without Real Data?
Geospatial AI (GeoAI) depends on data. The more examples a model sees, the better it becomes at recognizing patterns in satellite imagery, maps, and sensor data. In practice, however, high-quality geospatial training data is limited. Training modern models requires thousands or millions of labeled examples, and producing those labels is slow and expensive. Analysts often have to manually outline buildings, roads, or land-cover classes in imagery, a process known as satellite image annotation.
Even when labeled datasets exist, they are rarely perfect. Ground truth information can be incomplete or inconsistent, especially when imagery is affected by clouds, shadows, or resolution limits. Problems caused by noisy or inaccurate labels are well known in satellite imagery analysis with imperfect ground data. The challenge becomes even greater for rare events such as floods, infrastructure failures, or wildfire damage. These events do not occur frequently enough to produce large labeled datasets, yet they are exactly the scenarios where reliable GeoAI systems are needed. At the same time, privacy rules and restricted datasets limit data sharing, a challenge discussed in AI for geospatial data exploitation and GeoAI applications in environmental epidemiology.
If collecting enough real-world data is too slow, too expensive, or sometimes impossible, a natural question emerges. Can we generate the data ourselves? This article examines how synthetic environments and simulated data are being used to train geospatial AI systems. It explores when synthetic data helps, when it fails, and how it can complement real observations. The article is written for geospatial practitioners, data scientists, and GeoAI researchers who want a practical understanding of the promise and limits of synthetic data in GeoAI.
What Synthetic Data Actually Means in Geospatial Contexts
In GeoAI, synthetic data does not simply mean fake images. It refers to data generated by computers that follow the rules of geography, physics, and human behavior. The goal is to create realistic training examples when real observations are limited.
One common approach is building simulated cities and road networks, where entire urban environments are generated in 3D. Because the computer creates every building, tree, and road, the exact location of each object is already known. This means every pixel comes with a perfect label, removing the need for manual annotation.
Another form is artificial satellite imagery generated with generative models such as GAN-based geospatial image synthesis. These systems learn visual patterns from real satellite images and generate new ones that resemble forests, cities, or agricultural landscapes.
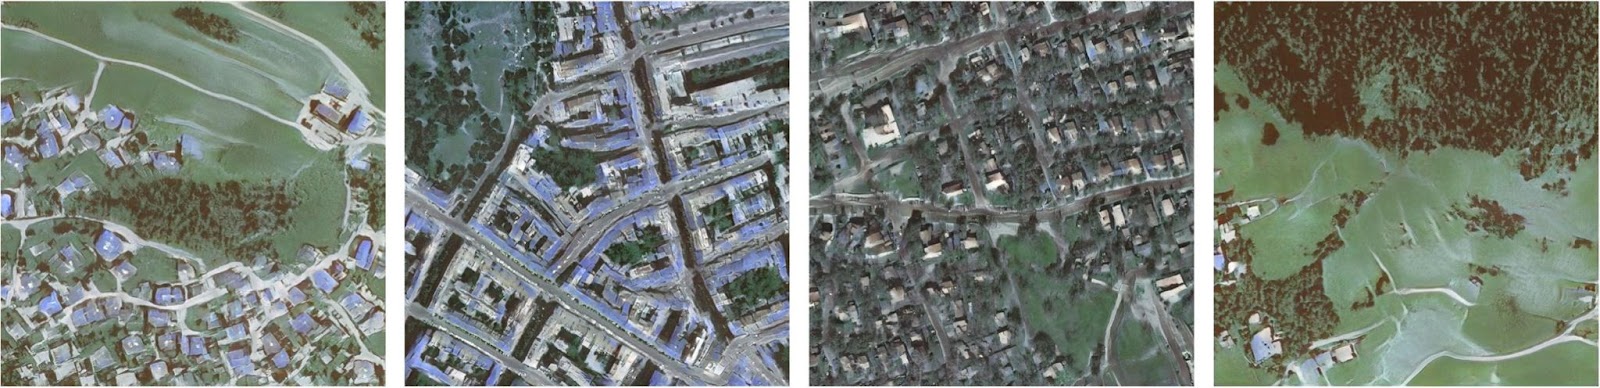
Example of GAN-generated aerial imagery. Source: Yates et al., 2022
Synthetic data can also come from physics-based simulations. Hydrological models simulate how water flows across terrain, while wildfire models reproduce how fires spread through forests. Examples include AI-assisted wildfire simulations and hybrid physics–AI hydrological modeling used to generate realistic disaster scenarios.
A fourth category involves synthetic mobility data, where virtual agents move through simulated cities to reproduce traffic and travel patterns. These agent-based models are increasingly used in synthetic mobility simulations for urban planning.
In practice, synthetic data is not meant to replace real observations. It provides additional training examples, allowing GeoAI models to learn patterns before they encounter the complexity of the real world.
Why Synthetic Data Is Attractive for GeoAI
Synthetic data is appealing because it addresses many of the challenges behind the GeoAI data bottleneck.
First, it allows researchers to study rare events. Disasters such as floods, earthquakes, or infrastructure failures occur infrequently, which means there are very few labeled examples for training models. With simulation, thousands of scenarios can be generated, allowing models to learn patterns of extreme events before they happen. This approach is increasingly explored in areas like wildfire prediction using synthetic data and AI systems for disaster-resilient infrastructure.
Second, synthetic environments allow controlled experimentation. Researchers can change one variable at a time (e.g., rainfall intensity or terrain slope) and observe how a model reacts. This level of control is impossible in real environments.
Third, simulations provide abundant labels. Because the virtual world is generated by the computer, every object already has a known identity, eliminating the need for expensive manual annotation.
Finally, synthetic datasets support large-scale pretraining. Massive simulated datasets can teach models general visual patterns before they are fine-tuned on smaller real-world datasets, an approach widely used in synthetic data pipelines for physical AI systems.
In practice, synthetic data acts like a training ground where GeoAI models can learn before confronting the complexity of the real world.
Simple Conceptual Example
Consider a simple task: training a model to detect flooded areas in drone imagery. Emergency teams could use such a system to quickly identify streets or neighborhoods that are underwater and plan safe rescue routes.
With real data, the process is slow. Flood events must first occur, drones must capture images, and analysts must manually label every flooded area in the imagery. Building a large training dataset can take years, and labeling mistakes are common.
Synthetic data offers a different approach. Instead of waiting for disasters, researchers can simulate floods using hydrological models and virtual landscapes. These simulations generate thousands of images showing how water spreads across terrain under different conditions. Because the environment is generated by the computer, the exact location of the floodwater is already known, which means every image comes with perfect labels.
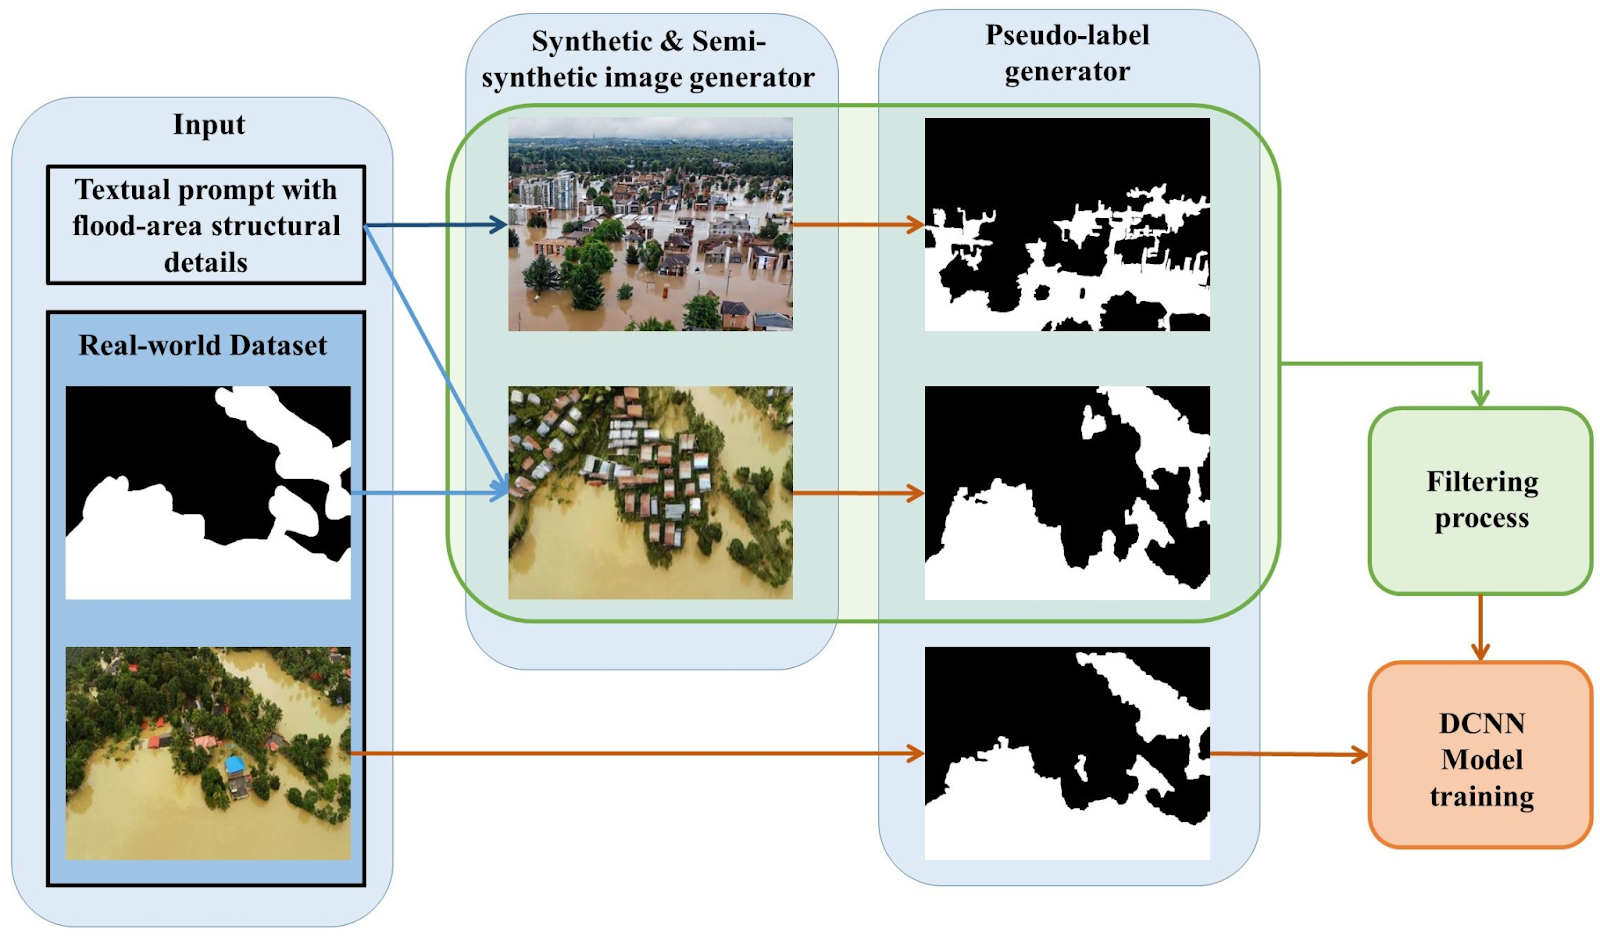
Sample Methodology using synthetic flood images. Source: Simantiris et al.,2025
The critical question remains: will a model trained on simulated floods recognize real ones? The gap between simulated and real environments is the central challenge of synthetic data in GeoAI.
The Domain Gap Problem
The biggest challenge with synthetic data is the domain gap. Synthetic environments are usually clean and controlled, while the real world is noisy and unpredictable. This difference can cause models trained in simulations to fail when applied to real imagery.
One reason is sensor and atmospheric noise. Real satellite images are affected by haze, clouds, lighting conditions, and imperfections in camera sensors. Simulated imagery often lacks these distortions, creating datasets that are unrealistically clean. Research on the simulation-to-reality domain gap highlights how models trained on perfect simulations struggle when confronted with real-world sensor noise.
Another issue is missing complexity. Simulated environments often represent idealized cities or landscapes, while real places contain irregular structures, shadows, vegetation cover, and infrastructure decay. If simulations omit these details, models may learn patterns that do not exist outside the simulator.
There is also the risk of learning simulator artifacts. Models may rely on subtle patterns created by the rendering engine instead of real geographic features. Studies examining the gap between synthetic and real-world imagery show how these artifacts can distort model behavior.
To reduce this gap, researchers often apply techniques like domain randomization and domain adaptation, intentionally adding noise and variability so models learn more robust features.
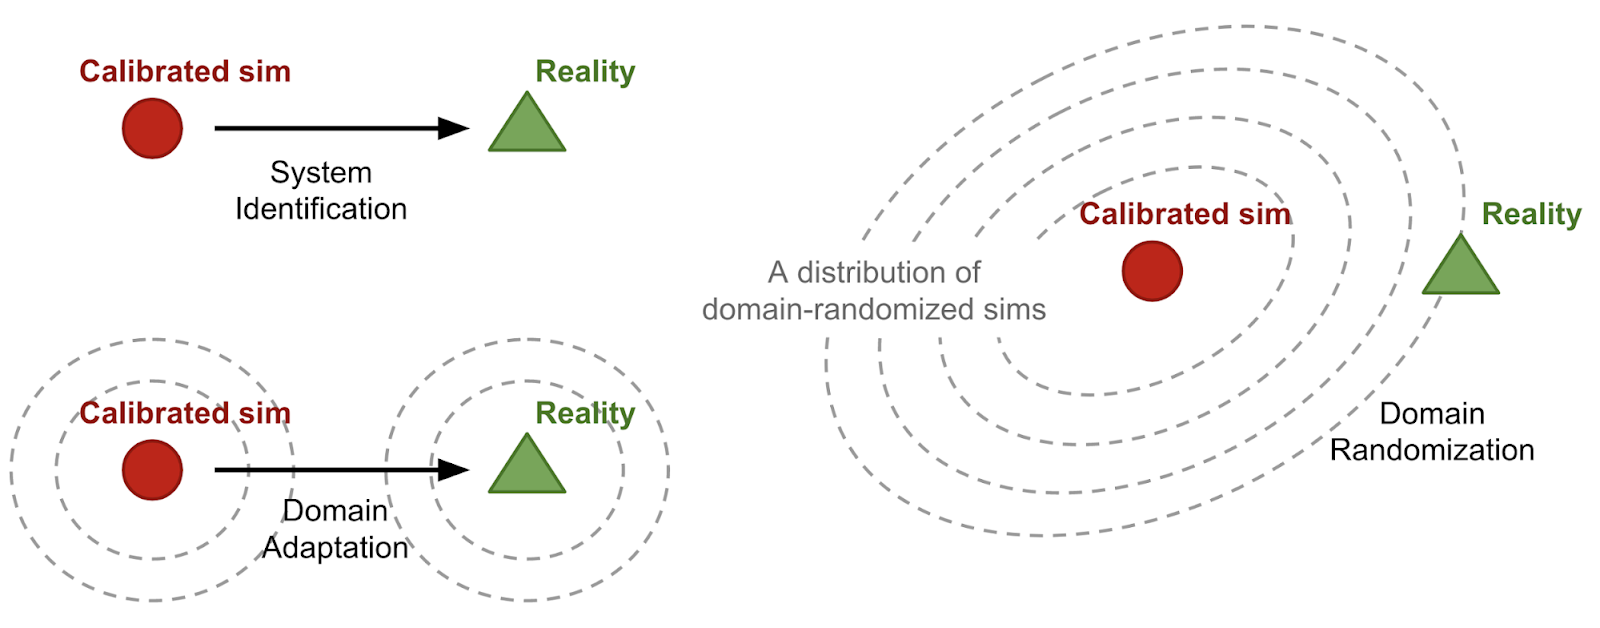
Domain Randomization. Source: Lil’Log
Where Synthetic Data Actually Works Well
Despite the domain gap, synthetic data already performs well in several GeoAI applications when used carefully. One of the most effective uses is pretraining and augmenting rare classes. For example, models designed to detect hurricane damage often lack large labeled datasets. Synthetic augmentation can generate thousands of variations of damaged buildings, helping models learn patterns before encountering real disaster imagery.
Synthetic environments also work well for learning structural patterns, such as road networks. Training on simulated urban layouts allows models to understand how roads typically connect and intersect, which improves performance when extracting roads from satellite imagery in rapidly growing cities.
Another important application is infrastructure resilience modeling. Engineers increasingly build digital twins of cities and simulate floods, earthquakes, or infrastructure failures to identify vulnerable assets before disasters occur.
Synthetic data has also shown strong results in perception systems. NVIDIA demonstrated that simulated imagery can improve the detection of distant vehicles in autonomous driving systems, achieving significant gains in accuracy in synthetic far-field object detection experiments.
Finally, synthetic augmentation is helping map complex urban environments. Methods such as SAMLoRA-based extraction of informal settlements use small real datasets combined with generated examples to improve the detection of dense informal neighborhoods.
In these cases, synthetic data does not replace real observations. It strengthens them.
Hybrid Futures: Blending Simulation and Reality
The future of GeoAI is unlikely to rely on synthetic data or real observations alone. The most effective systems increasingly combine both. Synthetic data provides scale and flexibility, while real data keeps models grounded in reality.
One common approach is fine-tuning synthetic-pretrained models. Models are first trained on large synthetic datasets to learn general visual patterns, then refined using smaller real-world datasets. This strategy reduces the need for large labeled datasets while improving performance in real environments.
Another promising direction involves physics-informed neural networks, which incorporate physical constraints directly into the learning process. These models ensure predictions remain consistent with real-world processes such as fluid flow or energy conservation, an idea explored in physics-informed neural network frameworks and broader PINN research literature.
Researchers are also exploring simulation-in-the-loop training, where models interact with simulators during training and continuously improve through feedback. Combined with techniques such as domain adaptation, which helps models transfer knowledge from synthetic to real environments, these methods aim to bridge the gap between simulated and real data.
In practice, the future of GeoAI is not synthetic versus real. It is synthetic plus real.
What This Means for the Future of GeoAI
Synthetic data is becoming an important part of the GeoAI toolkit. It allows researchers to generate training data for rare events, test new scenarios, and explore environments that would be difficult or impossible to observe in the real world. Simulated environments also open the door to new types of systems that can experiment with urban planning, disaster response, or environmental change before decisions are implemented.
At the same time, synthetic data cannot replace reality. Models must remain grounded in real observations and validated against real-world measurements. If training relies too heavily on simulated environments, models risk drifting away from the complexity and unpredictability of actual geography.
Future GeoAI systems will likely combine simulations, physical models, and real data into integrated environments where planners and researchers can test ideas safely before applying them in practice. These systems will make it easier to study rare disasters, evaluate infrastructure resilience, and explore how cities respond to environmental change.
Synthetic data expands what we can imagine and simulate. Real-world data keeps those simulations honest.
If we combine both responsibly, GeoAI will not only help us understand the world. It will help us prepare for futures that have not happened yet.
Further Resources:
- https://www.youtube.com/watch?v=HIusawrGBN4
- https://www.youtube.com/watch?v=0LWurOJlIAY
- https://www.tandfonline.com/doi/full/10.1080/13658816.2025.2609806
- https://www.sciencedirect.com/science/article/pii/S2666378324000308
- https://www.meegle.com/en_us/topics/synthetic-data-generation/synthetic-data-for-geospatial-analysis
Did you like this post? Read more and subscribe to our monthly newsletter!

