#People

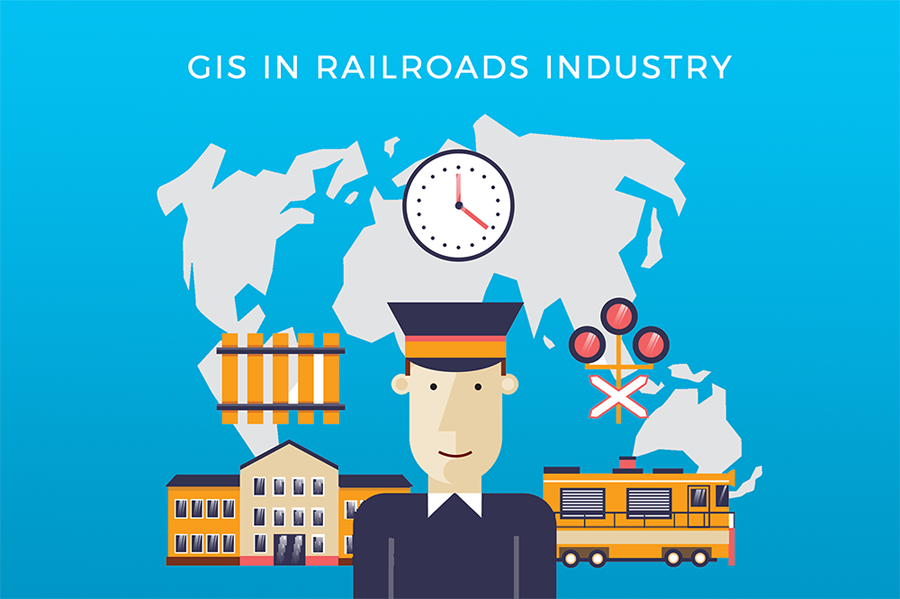
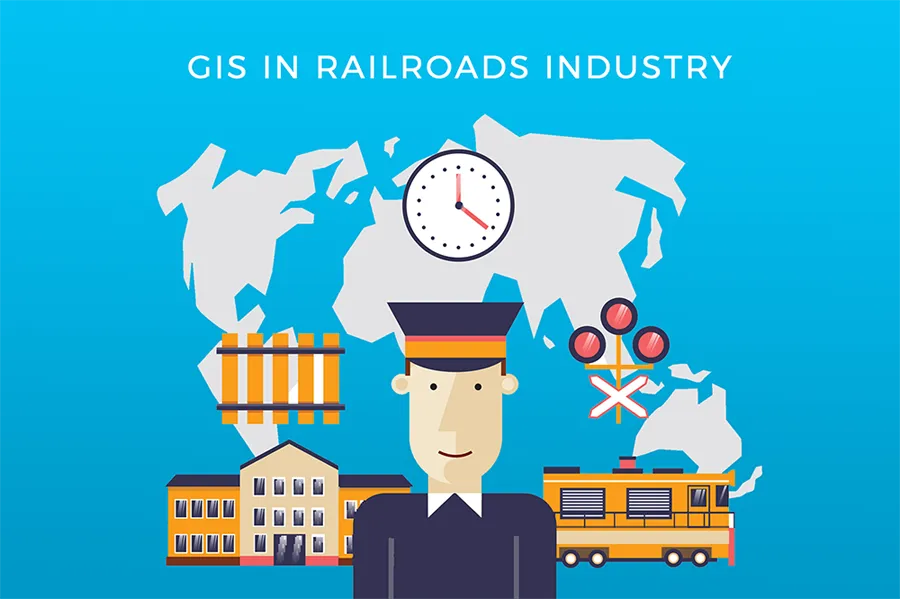
Exploring the use of GIS in the Railroads Industry: Webinar

gis-railroads-cover

GIS and mapping software have  its application in almost all industries, transportation being one of them. One such example is the Railroads Industry, where the use of GIS is intertwined with the real-estate transactions. As Tomy Brown, owner of the geoMobiliti Inc., Florida-based company that, among others, offers GIS solutions for Railroads, explains it:

“There is a considerate amount of revenues generated from utility companies crossing over railroad property which is especially important in US, because the railroads are not nationalized. Private railroad companies have transactions that take place with utility companies and adjacent land owners to lease land that the railroad owns.”

In the past, majority of work in the Railroads Industry had to be done manually, with paper maps and documentation. This made it hard to track properties and determine concrete details navigating through papers with information scattered on different stacks of paper.

By using GIS Cloud, the Railroad and Real Estate departments can get access to data with much more efficiency:

“It is so much easier now that you can, for instance, see an aerial image of the location and associated document to it. It allows a user to do actions in 5 minutes what would have taken them couple of hours usually.” – Tomy Brown

Another great thing is that cloud GIS makes it easier to collaborate on data and share it in just a few seconds to users on remote locations, through all devices. The added benefit is the possibility to use Mobile Data Collection for collecting data directly in the field:

“The ability to record data about their assets and to record property and drainage issues, to collect that information is very valuable for them to understand patterns, trends and the issues that they are dealing with on a daily basis.”

If you wish to find out more about using GIS in the Railroads industry, you can listen to Tomy Brown directly by registering for a free webinar “Using GIS in the Railroads Industry”.

Webinar time and date:

Wednesday, December 7th at:

8am PST   11am EST   5 pm CET

REGISTER HERE.

Say thanks for this article (0)
The community is supported by:
Become a sponsor
#People
#Events #Humanitarian #People
Mapathon @ TU Munich: Mapping At-Risk Regions with Awesome Mappers
Nianhua Liu 07.23.2024
AWESOME 2
#Business #Fun #Ideas #People
History of GIS | Top 6 Figures in GIS and Geospatial
Nikita Marwaha Kraetzig 08.12.2024
AWESOME 2
#Ideas #People #Satellites #Science
AI Assistance in Creating 3D City Visualizations
Sebastian Walczak 04.12.2024
AWESOME 1
Next article
#Featured #GeoDev

Everything you need to add beautiful editable maps to your PowerPoint slides

If you study or work sooner or later you will have to make a PowerPoint presentation. No matter if you work in a mapping industry, you want to present annual results per region in your organization, or you have class project review, the best way to show something that has a spatial component is always a map.

If you need to show some complex phenomena you might need to make your cartographic visualization in a GIS, mapping or graphic software and add it as an image to your slides. If needed you can than draw shapes on the top of the image in PowerPoint. This way you can also add animations on the top of your map background.

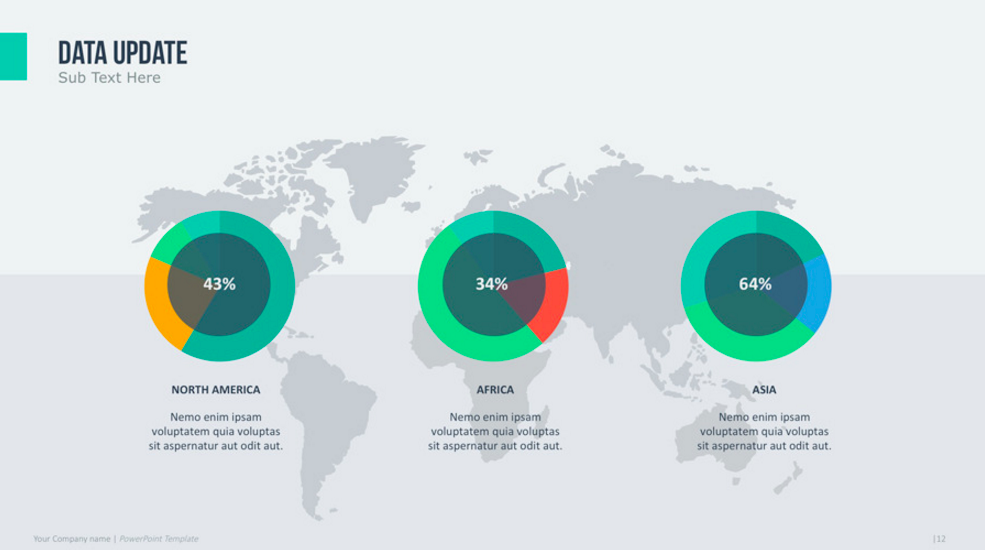
But if you need a cool looking map for your slides to show things on a cartogram or same graphics like pie charts, bubble chart or markers on the top of a map the best method is to use one of the templates available online.

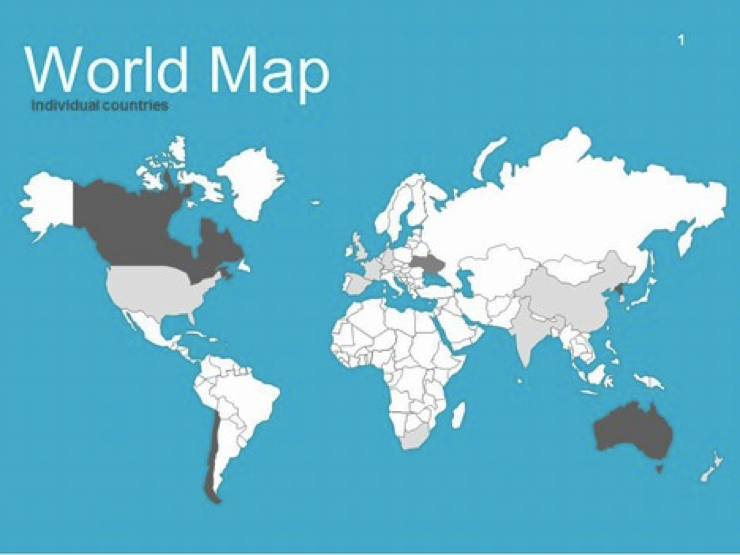
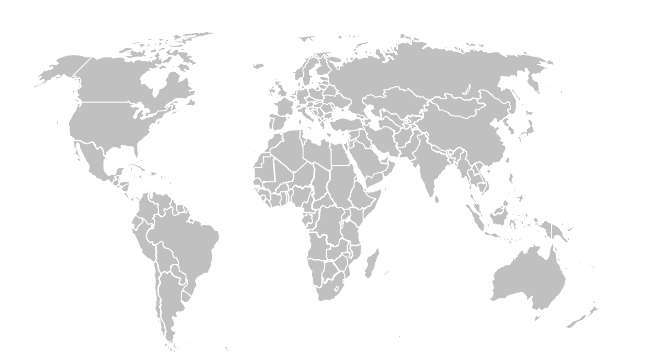
These map templates offer various possibilities but also have some limitations. You can change the color of each element (e.g. country, state), do actions like enlarging a country, you can group, ungroup visual elements, add effects like shadows etc. The biggest limitation is that you cannot connect it to any data, which means that you need to edit colors manually.

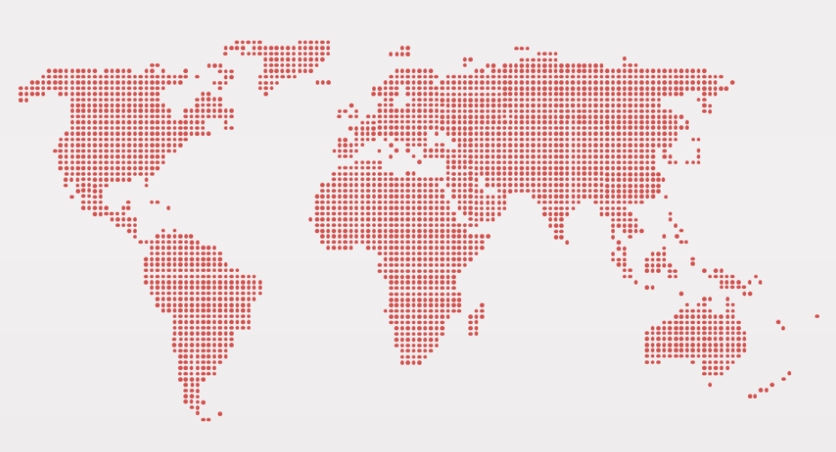
What is found really interesting is that some of these maps are using SVG or vectors so you can edit them with any vector editing tool and copy back to you slides.

Below you find a list of my favourite free and premium templates:

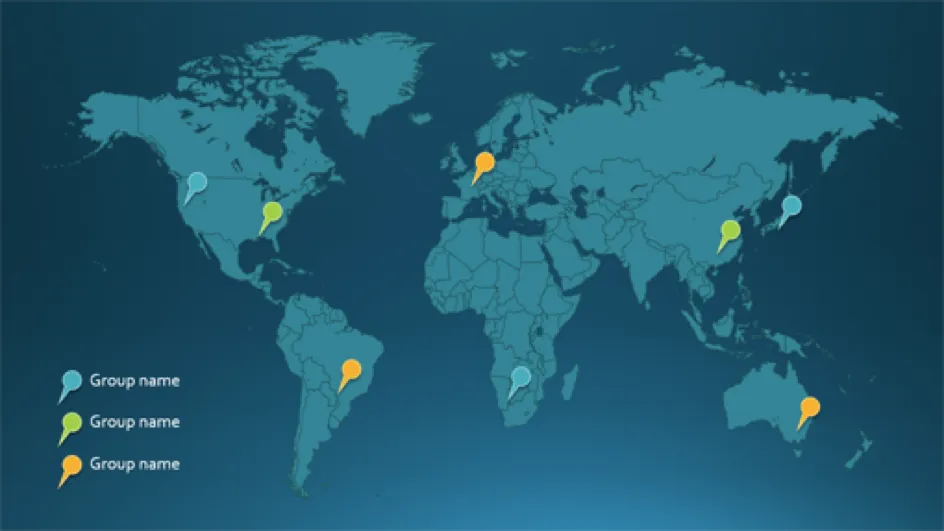
1. MS Office map template with pins from Microsoft

power-point-map-geoawesomeness-template-3

Source: Office
Price: Free

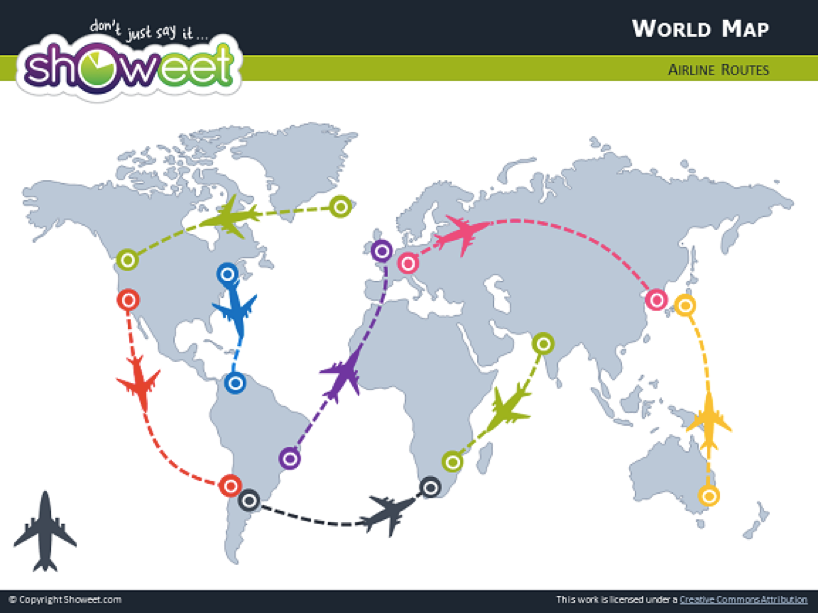
2. Cool generalized 13 templates of world map 
power-point-map-geoawesomeness-template-1

Source: Showeet
Price: Free

3. Simple country-level world map

power-point-map-geoawesomeness-template-2

Source: presentationmagazine
Price: Free

4. Another free country-level map but not in Mercator projection

power-point-map-geoawesomeness-template-5

Source: Presentation SlidesPrice: Free

5. Awesome dotted world map 

power-point-map-geoawesomeness-template-4

Source: Presentationgo
Price: Free


6. Cool premium world map with charts.

power-point-map-geoawesomeness-template-6

Source: GraphicRiver
Price: $12

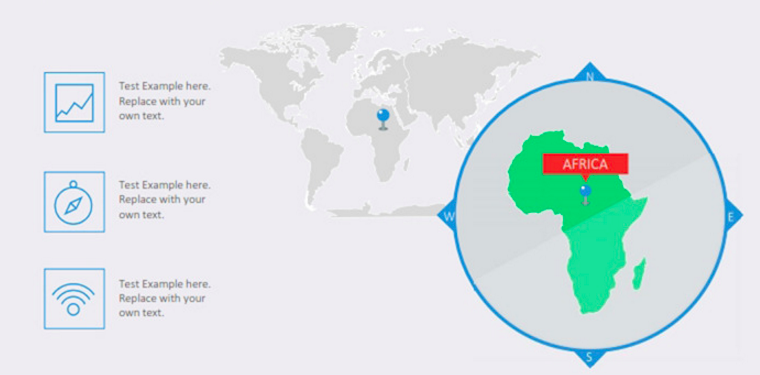
7. Premium world map with zoom

power-point-map-geoawesomeness-template-7

Source: GraphicRiver
Price: $4

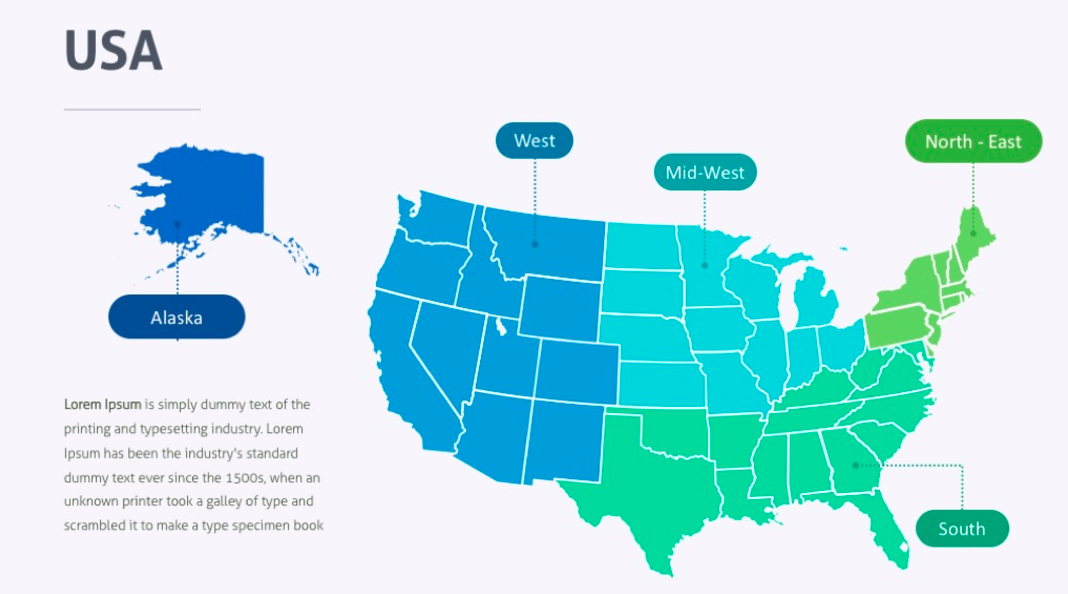
8. Premium country map with states and regions

power-point-map-geoawesomeness-template-8

Source: GraphicRiver
Price: $10

If you feel something is missing, feel free to share it in comments.

Read on
Search