The Critical Role of Ground-Based Data in Regression Model Accuracy for Remote Sensing Applications

Editor’s note: This article was written as part of EO Hub – a journalistic collaboration between UP42 and Geoawesome. Created for policymakers, decision-makers, geospatial experts and enthusiasts alike, EO Hub is a key resource for anyone trying to understand how Earth observation is transforming our world. Read more about EO Hub here.
Remote sensing has revolutionized environmental studies, allowing scientists to gather comprehensive data about the Earth’s surface and atmosphere from afar. From monitoring deforestation and mapping urban sprawl to assessing agricultural health and predicting natural disasters, the applications of remote sensing are vast and varied.
However, despite these technological advances, the accuracy of the regression models used in remote sensing heavily relies on ground-based data. This article delves into the indispensable role of ground-based data in calibrating and validating these models, thereby ensuring the reliability of remote sensing analytics.
Pixel-Level Detail: Categorizing Imagery with Labels and Values
Since the launch of Landsat-1 in 1972, satellite imagery has become increasingly accessible, marking over five decades of open-access satellite imagery covering the globe. With a spatial resolution of 30 meters, the Landsat constellation provides moderate-resolution imagery, enabling applications ranging from land cover classification to environmental monitoring. This resolution allows us to observe landscape features at a human scale while still covering large areas.
Today, multiple sources of open-access imagery, such as MODIS and the Sentinel constellation, as well as commercial options providing sub-meter spatial resolution, are available. These datasets are now easily accessible through platforms like UP42. Increased accessibility has propelled a wide range of applications, particularly in image classification. You’re now able to efficiently assign a class label to each pixel, such as:
- Water bodies
- Vegetation types
- Snow and ice cover
- Urban structures and buildings
- Agricultural fields
From Classification to Regression
Recently, there has been an increasing shift towards using satellite imagery for regression modeling. Instead of assigning a label, regression modeling assigns a quantitative value to each pixel. This is a shift from traditional semantic segmentation, which assigns class labels like ‘building or ‘nonbuilding’. Instead, regression models predict a continuous quantitative value for each pixel, such as crop yield or vegetation indices. This approach allows for:
- More granular information extraction
- Capturing subtle variations within a single land cover type
- Direct quantification of physical or biophysical parameters
Some key applications of regression modeling include estimating forest biomass, examining soil moisture, and looking at water quality parameters. For example, pixel-level regression is ideal in precision agriculture for predicting crop yield. It’s useful in urban planning for estimating building footprint height and can be used in environmental monitoring when quantifying vegetation indices.
A quick review of remote sensing studies indicates that a significant portion of studies focus on classification and change detection, whereas the applications using regression modeling are still being explored.
This trend toward pixel-level regression is driven by several factors:
- Demand for Granularity: There’s an increasing need for more detailed, quantitative information beyond simple categorical labels
- Richer Information: Regression models can provide more nuanced insights into continuous variables like vegetation health, soil moisture, or urban density.
- Improved Decision Support: Quantitative data often translates more directly into actionable insights. the need for more granular and quantitative information, beyond categorical labels.
While promising, the shift towards regression modeling in remote sensing comes with its own challenges. Regression models typically require more finely annotated training data, with continuous ground truth values for each pixel.
This is where ground-based data comes in.
The Critical Role of Ground-Based Data
Ground-based data, or “ground truth” data, is essential for validating and calibrating remote sensing observations. Collected directly from the Earth’s surface, it excludes atmospheric effects and other errors, ensuring accuracy in regression models. Key reasons for its importance include:
- Training Data: Proper calibration with field data minimizes errors. For instance, satellite sensors might misinterpret different surfaces. Ground data helps correct these inaccuracies.
- Model Validation: Validation with ground data ensures predictive accuracy. For example, crop yield models must be validated against actual field data to refine and improve reliability.
- Spatial Extrapolation: Ground data allows model predictions to be applied over larger areas. A model calibrated with soil moisture data from one region can estimate moisture levels in similar regions without direct measurements.
- Data Integration: Integrating ground data with high-resolution imagery from UAVs enhances the validation database, improving model accuracy. For example, combining groundwater quality measurements with UAV data enhances large-area predictions.
- Physical Interpretability: Ground data provides context, making models more transparent and their predictions more understandable.
- Error Correction and Bias Adjustment: Ground data helps identify and correct biases in satellite data, such as adjusting satellite-derived temperature estimates with ground-based readings for better accuracy.
Sources of Ground-Based Data for Remote Sensing Validation
Ground-based data plays a crucial role in calibrating and validating remote sensing models. Two primary sources of this data are field measurements and reflectance measurements.
- Field Measurements: These involve on-site data collection using instruments to measure various environmental parameters, such as soil moisture, vegetation type, and atmospheric conditions. For instance, scientists may use on-site turbidimeters to check the turbidity of the water. Additionally, samples collected from the field can be stored carefully and brought to the laboratory for analysis, such as chlorophyll concentration or the amount of nutrients in the water or soil sample.
- Reflectance Measurements: It is important to collect the reflectance spectra as satellite data is affected by atmospheric composition, these measurements help account for those atmospheric effects—providing a direct link between ground conditions and remotely sensed data.
Reflectance measurements are typically taken using a handheld spectrometer that provides hyperspectral reflectance values (typically from 390nm to 900nm with 1nm bandwidth).
Using Regression Models in Remote Sensing
Now that we have established the importance of ground-based or “in-situ” data for remote sensing applications, it is important to understand how to use regression models and their need. Put simply, regression models are statistical techniques used to predict continuous variables based on the spectral data obtained from satellite imagery.
Inputs for Regression Models
Regression models can utilize one or a combination of inputs:
- Original spectral bands such as Blue, Red, Green, etc.
- Band ratios and indices such as Blue/Green, or NDVI (Normalized Difference Vegetation Index)
- Spectrally transformed values such as PCA (Principal Component Analysis) and (Hue, Saturation, and Value)
- In-situ parameters, for instance, turbidity or suspended particulate matter, can be used in the estimation of water clarity or chlorophyll-a
- Environmental and meteorological parameters such as rainfall, air and water temperature, wind speed and direction
Thankfully, we do not have to manually calculate all these indices as platforms like UP42 offer processing tools for calculating various indices and processing data, streamlining the workflow for regression modeling.
How Do These Models Work?
Regression models establish relationships between dependent variables (e.g., soil moisture, and biomass) and independent variables (e.g., spectral bands from satellite imagery). The goal is to predict the value of the dependent variable for each pixel in an image based on the spectral information. Common types of regression models used include:
- Linear Regression: Establishes a linear relationship between the dependent and independent variables.
- Multiple Linear Regression: Involves more than one independent variable to predict the dependent variable.
- Non-linear Regression: Captures more complex relationships that are not linear, such as polynomial, logarithmic, or exponential.
- Machine Learning-Based Regression: Methods such as Random Forest, Support Vector Regression, and Neural Networks can model complex, non-linear relationships more effectively than traditional regression techniques.
Why Are These Models Needed?
Regression models are crucial for transforming spectral data into meaningful environmental parameters. Unlike classification models, which assign a predictive value to each of the satellite-based pixels and not a class label, regression models can be used to accurately map and monitor an environmental variable on a large spatial and temporal scale.
Challenges in Using Ground-Based Data
- Remote areas and difficult terrain hinder data collection, making it logistically and physically demanding.
- High costs for specialized equipment, travel, and personnel make extensive data collection expensive.
- Temporal discrepancies between ground data collection and satellite overpasses, along with natural environmental changes, lead to potential alignment issues.
Alternative Approaches
Given these challenges, researchers are exploring alternative methods to supplement ground-based data. High-resolution imagery, drone-based data, citizen science initiatives, sensor networks, and data fusion techniques, all mitigate some of the challenges associated with ground-based data collection. Platforms like UP42 offer access to a diverse array of geospatial data sources, enabling users to combine data types.
From drone data and high-resolution satellite imagery to aerial data and IoT sensor data streams—these platforms also offer tools for processing, analysis, and integration.
Real-World Applications and Impact
The integration of ground-based data in remote sensing applications significantly enhances the accuracy and reliability of the results. Here are a few real-world examples:
Vegetation Analysis
In agriculture, remote sensing is used to monitor crop health and predict yields. Ground-based measurements of crop parameters, such as leaf area index, biomass, and chlorophyll content, are essential for calibrating satellite-based vegetation indices.
This calibration ensures that remote sensing models accurately reflect the vegetation or forest conditions on the ground as demonstrated in the figure below. Additionally, tree canopy detection can be easily carried out using platforms like UP42.
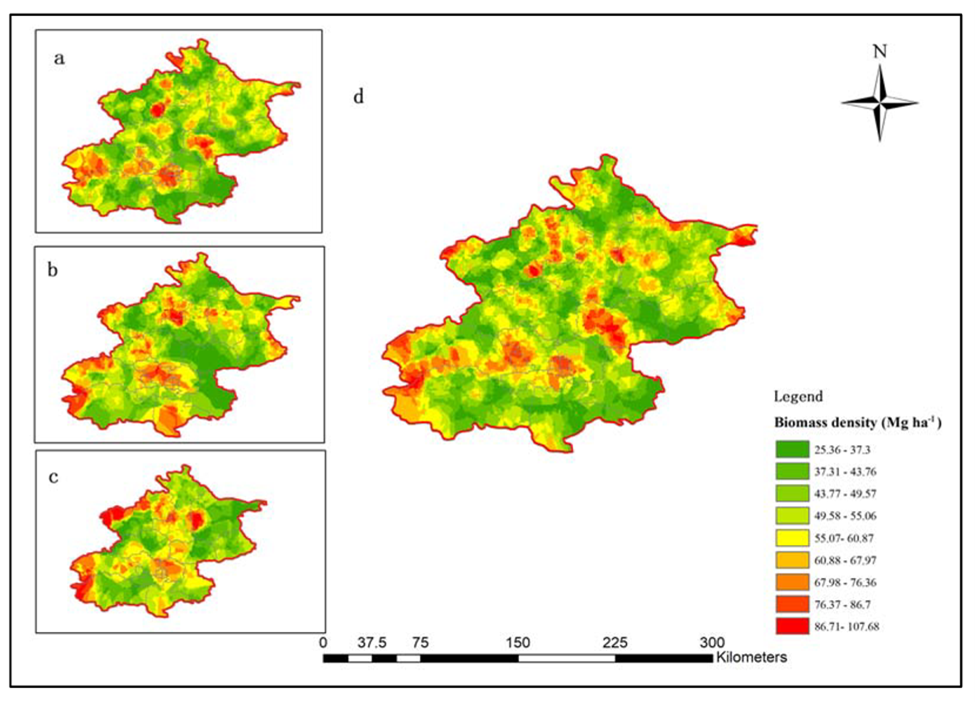
Figure 1: Biomass density distribution in Beijing, China (a) Coniferous forest; (b) Mixed forest; (c) Broadleaf forest; (d) all forest sampling plots.
Water Quality Monitoring
Remote sensing is increasingly being used to assess and monitor water quality in lakes, rivers, and coastal areas.
Ground-based measurements of parameters like turbidity, Secchi Disk Depth (SDD) which is an indicator for water clarity, chlorophyll concentration, and nutrient levels are crucial for calibrating regression models. These models can then predict water quality parameters over large areas, providing essential data for environmental management and policy-making.
For example, satellite-derived estimates of chlorophyll concentration and water clarity in a lake can be validated with in-situ measurements to ensure accurate monitoring of algal blooms, which can be harmful to aquatic life and human health. One such example over Canandaigua Lake is presented in this study and the SDD maps are shown below.
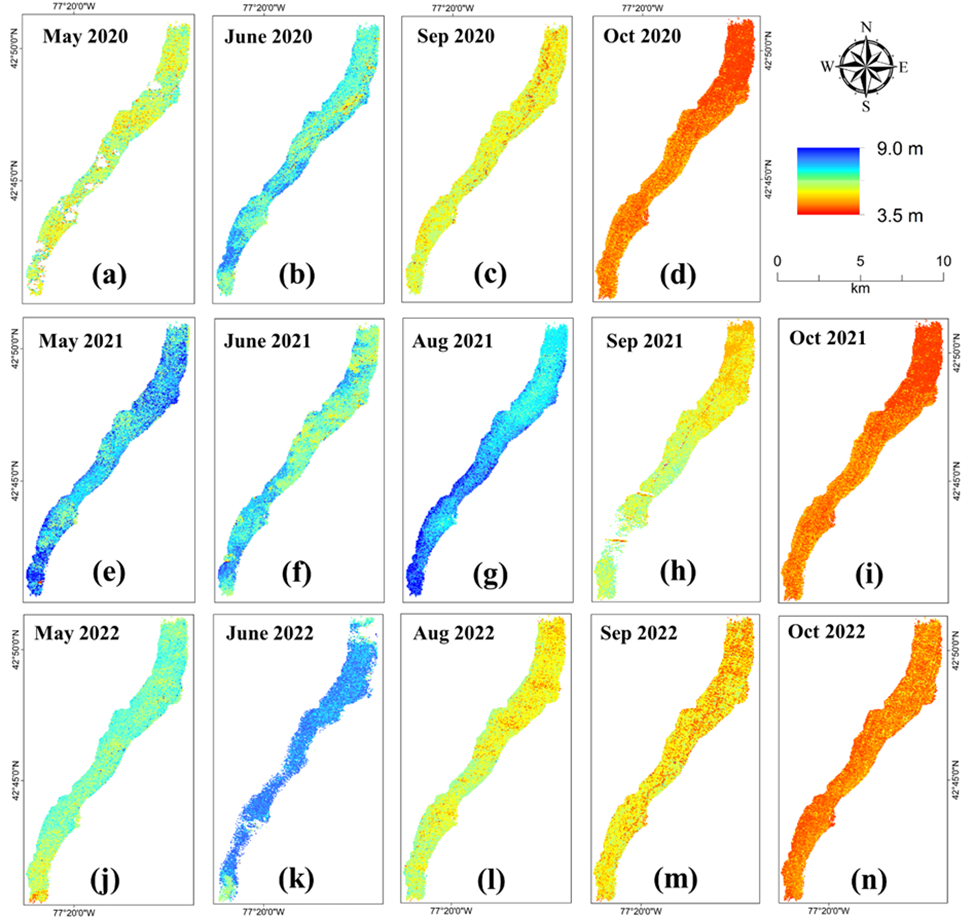
Figure 2: Temporal maps showing the estimated SDD for Canandaigua Lake using one clear imagery for each of the months from June through October for years 2020 (a)–(d), 2021 (e)–(i) and 2022 (j)–(n). The red color indicates the lower values of SDD indicating turbid water and the blue value indicates high values of SDD indicating clearer waters.
Soil Moisture Monitoring
Soil moisture is a critical parameter for agricultural management, drought prediction, and hydrological studies. Remote sensing provides large-scale soil moisture data, but these estimates need to be validated with ground-based measurements as illustrated from a study below.
Ground-based sensors and manual sampling provide accurate soil moisture data that are used to calibrate and validate satellite-derived models. This ensures that the remote sensing models accurately reflect the soil moisture conditions, which is essential for effective water resource management, irrigation planning, and understanding the impacts of climate change on agriculture.
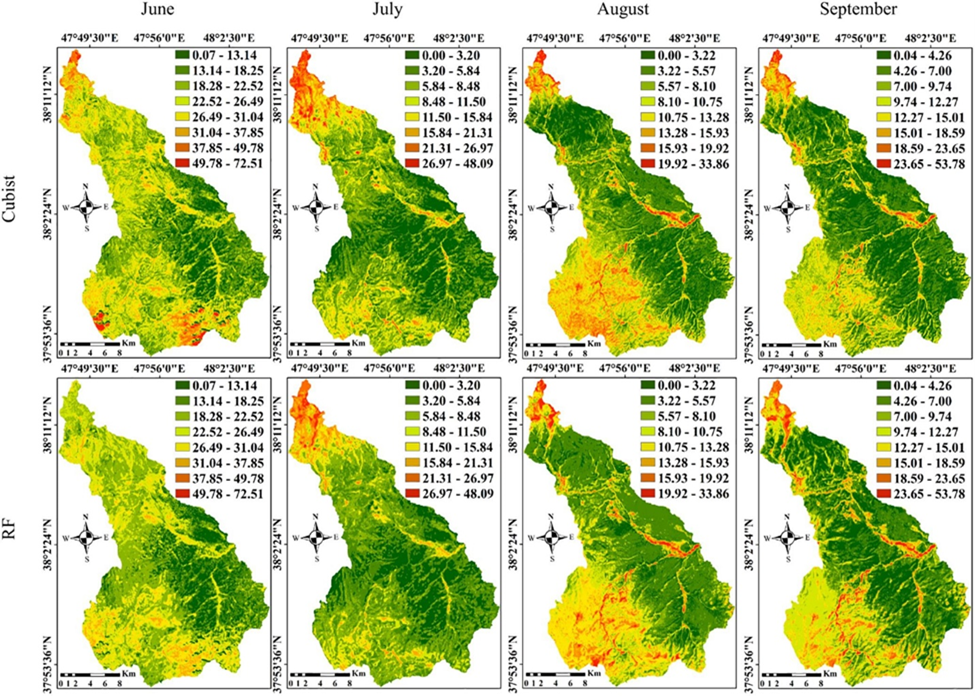
Figure 3: Predictive maps of soil moisture based on the generalized model for both the Cubist and Random Forest MLAs in the study area for the four months.
Conclusion: The Synergy of Ground-Based Data and Remote Sensing
Ground-based data is a cornerstone of ensuring the accuracy and reliability of regression models in remote sensing applications. While remote sensing technology provides a broad overview of environmental conditions, ground-based data offers the detailed, localized information necessary for precise model calibration and validation.
By combining the strengths of remote sensing and ground-based observations, we can achieve more accurate and reliable environmental insights, ultimately leading to better decision-making and resource management. The future of Earth observation and analysis lies in this integrated approach, combining the global perspective of satellites with the detailed, nuanced information provided by ground-based observations.
Emerging technologies like drones, IoT sensors, and AI/ML offer solutions to overcome challenges in ground-based data collection by providing high-resolution data, real-time monitoring, and efficient data processing, reducing costs and enhancing compatibility with satellite data. Therefore, despite the challenges of collecting ground-based data, the integration of new technologies promises to enhance the efficiency and accuracy of this crucial process.
Did you like the article? Read more and subscribe to our monthly newsletter!


#Categories
Next article
Simplifying the Process of Tasking a Satellite

Editor’s note: This article was written as part of EO Hub – a journalistic collaboration between UP42 and Geoawesome. Created for policymakers, decision-makers, geospatial experts and enthusiasts alike, EO Hub is a key resource for anyone trying to understand how Earth observation is transforming our world. Read more about EO Hub here.
If you let your imagination run, the scope of projects that are possible in the world of geospatial data is limitless. Our beautiful earth is an intricate canvas of complexity and satellite imagery offers us a unique vantage point, a lens through which we can reshape our understanding and interactions with the world around us. However, the sad reality is that countless projects, brimming with potential, don’t see the light of day because of apparent resource constraints and bureaucratic processes that stifle creativity and narrow the scope of what is perceived as viable.
One of the major offenders here is satellite tasking — the act of requesting the specific imagery that you need over your Area of Interest (AOI). Despite commercial satellites already covering the majority of the globe, it’s not necessarily a simple process to get the up-to-date satellite imagery that you need. Many users struggle with understanding the potential cost, evaluating the project’s feasibility, and getting the level of control that they need to optimize their financial investment.
In this article, we’ll discuss some of these challenges more specifically and then paint a picture of where the industry needs to go in order to liberate users from the roadblocks they face.
Confronting the Challenges of Satellite Tasking
If you’ve ever gone through the process of satellite tasking, you will likely have experienced some of these obstacles:
- Complex process. A typical satellite tasking exercise is not exactly the seamless experience you might expect given the sophistication of the technology itself. It can often require multiple back-and-forth email exchanges with providers and other partners to clarify the brief, negotiate the pricing, and obtain the results. The process is often opaque and it can be really frustrating to deal with — especially if your project is time-sensitive (which almost all projects are, to some extent). The industry would benefit greatly from improved workflows and more transparent satellite tasking — and it would significantly increase the scope of work that was possible.
- Lack of flexibility and accessibility. Compounding the complexity is the lack of aggregated data networks which means it can be difficult to access and request highly specific and precise satellite imagery. Consequently, many users find themselves ordering more data than they require because they need to fit into the specific offerings that a single provider can deliver. This increases the cost and results in a lot of wastage — all of which serves to stifle potential projects of all types. Users need more flexibility and precision in terms of their satellite tasking and we have the ability to deliver that — if we can transform the way that requests are submitted and actioned across the industry.
- Opaque pricing. When you’re dealing with individual satellite imagery providers the question of price can be a very delicate dance. As a user, you often don’t have much bargaining power so evaluating what a particular project is going to cost and how to craft your brief that fits into your budget is exceedingly difficult. This lack of transparency is a major hurdle for many projects and it could be wholly avoided if users had a better sense of the drivers and considerations when it comes to pricing satellite imagery. As an industry, we need better controls here and aggregation of resources so that we can cultivate a healthier marketplace overall. This will not only reduce prices for users (due to healthy competition) but it will speed up feasibility studies, reducing the wasted time and money spent on proposals, quotes, and pilots that were never going to be affordable in the first place.
- A need for faster delivery to enable real-time insights. It’s completely cliché at this point to talk about how fast the world is changing, but it’s a serious challenge that affects the vast majority of geospatial projects. In order to complete accurate and timely analysis that can deliver actionable insights, users need to be able to get their imagery quickly and efficiently. Unfortunately, the current processes don’t deliver this and you can often be waiting days or weeks for your data — which completely eliminates your ability to make near real-time decisions. The industry needs more reliable timelines and smoother tasking procedures so that we can utilize the most up-to-date information possible. Just that one change alone would radically change what is possible with this technology and open things up to a wide range of new possibilities.
These four barriers to entry have a significant impact on how satellite imagery is used across many different industries and users are crying out for solutions. If the industry can make meaningful steps toward solving some of these challenges, it can be a catalyst for innovation and it can revitalize projects that were previously discarded because of the tedious, expensive, and complicated procurement process.
Where are the Green Shoots?
It’s safe to say that there are a lot of people in the industry who have recognized the challenges and who are working to create solutions that can streamline the tasking process and make it easier for everyone involved. One example of this comes from the team at UP42, who have built a platform that aggregates many of the top satellite imagery providers and then serves up an easy-to-use interface for users to interact with. By opening access like this, users have complete flexibility when it comes to pricing, data types, and other parameters — because they can compare providers against each other and find the best fit for them. But, perhaps more importantly, the platform makes satellite imagery more accessible than ever – turning a tedious process into one that feels like a natural extension of many of the best GIS software solutions out there.
Transitioning to a more modern GUI (and away from email exchanges) and integrating providers to allow for more advanced tasking seems inevitable at this point if you look at the way that technology has advanced in other industries. But another positive step forward in geospatial data specifically is the ability to combine different types of sensors and data so that a user can access a more holistic dataset for their needs. What this looks like in practice is a user being able to integrate data from multiple providers into one data pipeline, including their own proprietary data if they wish.
For example, UP42 allows a user to define their specific AOI and then gather different types of data in one place. This optimization goes a long way toward enabling more nuanced and sophisticated geospatial use cases, and it greatly accelerates the speed of available analysis.
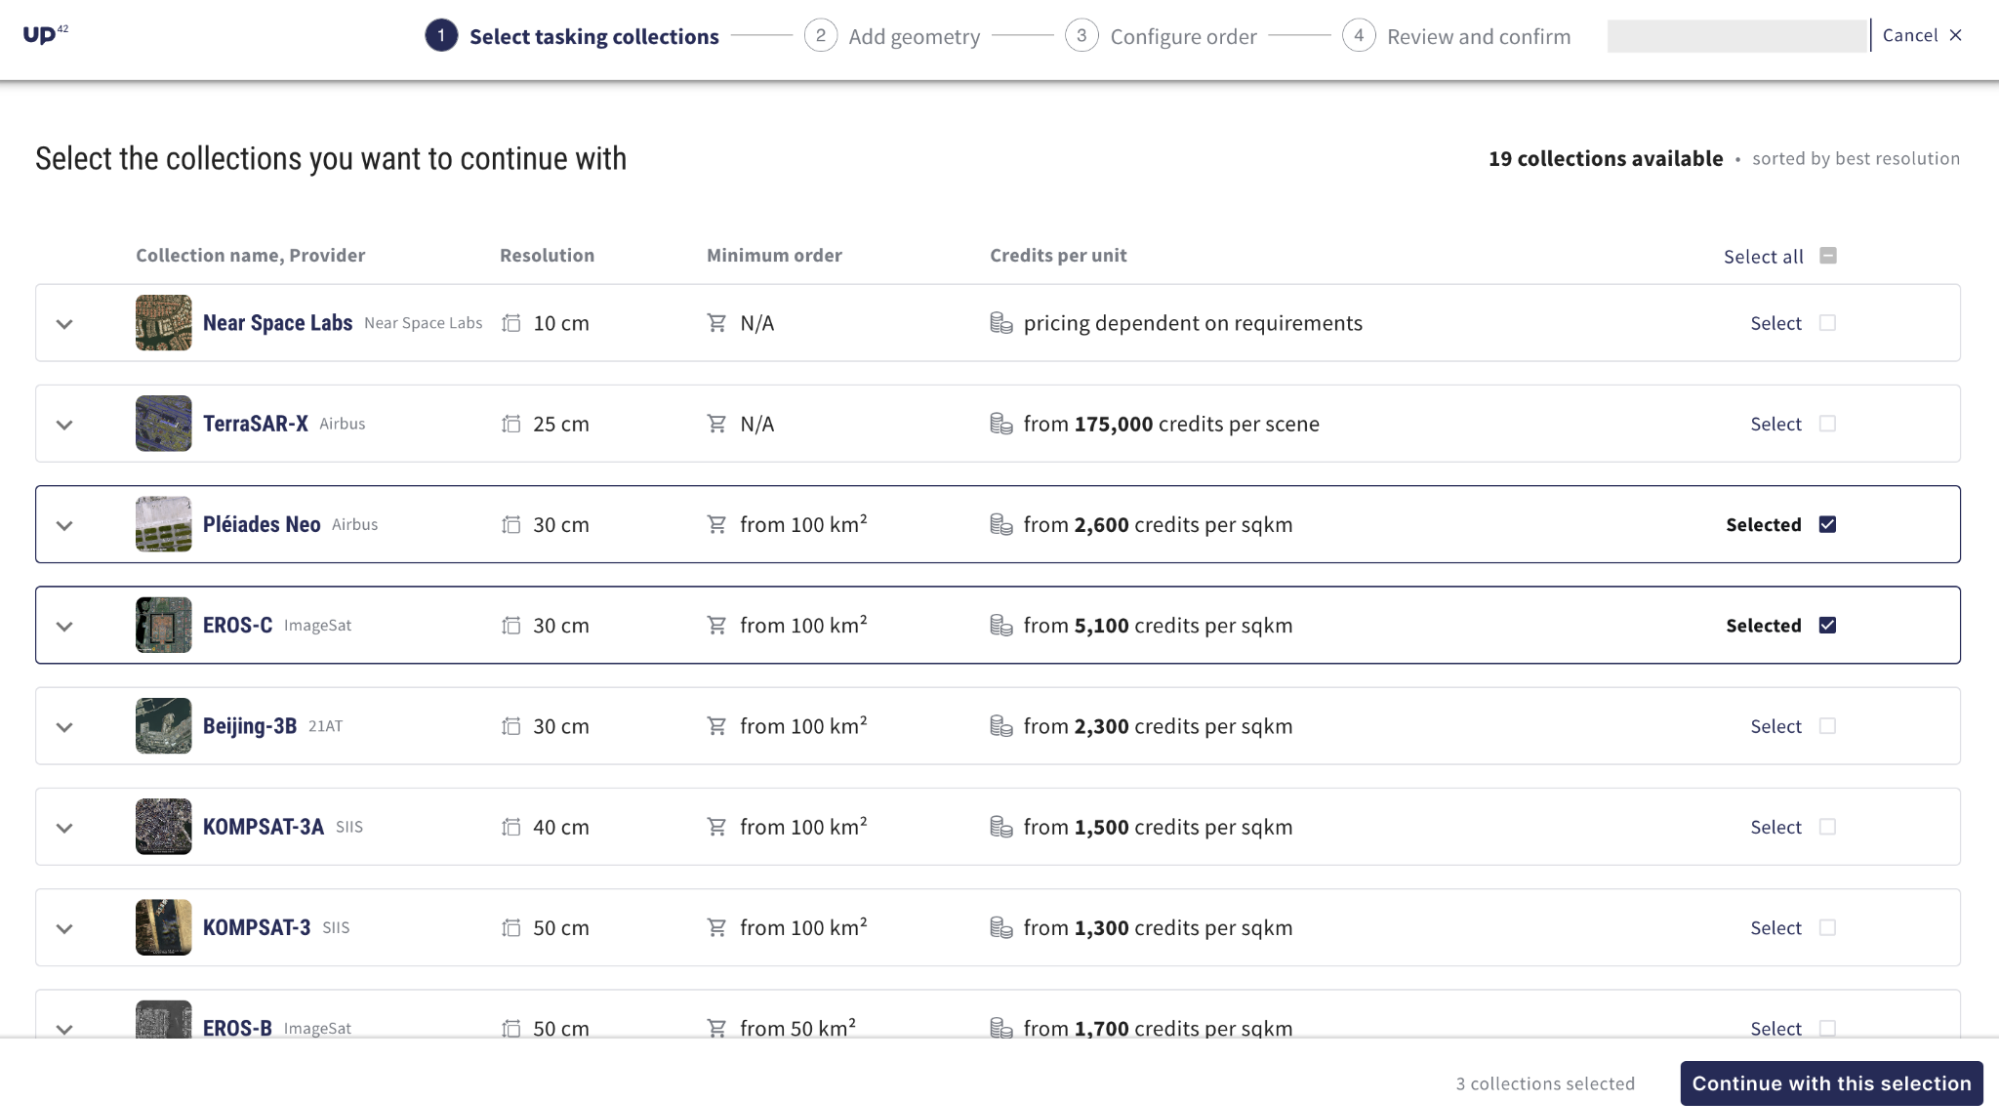
Additionally, UP42 unveiled a new tasking ordering flow that addresses the industry challenge of opaque pricing. A lack of clarity, combined with long waiting times for tasking quotes, can disrupt projects and budget planning. Now, users have a broad overview of all the different providers, collections they offer, resolution, minimum order restrictions, and cost beforehand.
Gone are the days of endless emails for tasking orders. Hassle-free tasking with UP42 streamlines the entire process with a single, integrated solution. You can place tasking orders, get instant price estimates, and then download imagery into your workflow on the platform. By reducing the complexity in this way, it’s now possible to better focus on the task at hand. The team has written detailed documentation about tasking, including how to make the most of the wealth of data sources available on their marketplace and platform to analyze and innovate.
With more effective analysis comes better results and more meaningful change across a wide range of use cases. In fact, it feels like the efficiencies being achieved through some of these modern platforms might just be the unlock that can dramatically increase the utility of the wonderful satellite data that providers are gathering. Of course, more still needs to be done here to truly achieve the potential that modern satellite tasking has for us, but it’s good to see that there are companies out there who are building solutions that stride toward this future.
We’ve already seen major improvements in areas such as data storage, privacy protection, data quality, collaboration, and more — but this feels like the next frontier. As a community, we need to continue lobbying for improvements to satellite tasking because it is one of the major pain points that we all feel. By supporting the organizations that are making things easier, we can catalyze wide-scale change to the model of how things are done, and the industry can reap tremendous rewards as a result.
The Future of Satellite Tasking
If we let ourselves dream a little, the future of satellite tasking might resemble the experience of ordering our favorite food on an app. We’d select from a wide range of options, specify exactly what we wanted, have immediate price transparency, and then — with one click — it would be delivered to us. That’s what the future of satellite tasking needs to look like.
Having accurate price estimations, intuitive order processes, and a significant increase in accessibility can make a world of difference to what is possible. And with a combination of technological advances, software integrations, and customer-led innovation – we can definitely get there.
When we do, then the only limit will be our imagination. With a simpler and more effective process, access to satellite imagery ceases to be a barrier and instead becomes an enabler for so many of the exciting projects that we have yet to discover. Let’s get the tools in the hands of our community and watch them change the world.
Did you like this article? Read more and subscribe to our monthly newsletter!

