Disaster management is an area where the use of satellite data can literally make a difference and even save lives. Copernicus, the European Union’s Earth Observation Programme, has a dedicated service for this purpose – the Copernicus Emergency Management Service (EMS). The service is free of charge and available for emergency actors anywhere in the world.
Copernicus Emergency Management Service
The Copernicus Emergency Management Service is one of the six main services that the Copernicus Programme, the European Union’s Earth Observation programme, provides on a global scale. The service supports crisis managers, Civil Protection authorities and humanitarian aid actors dealing with natural disasters, man-made emergency situations, and humanitarian crises, as well as those involved in disaster risk reduction and recovery activities.
The EMS consist of five main components:
Risk & Recovery Mapping for disaster management
The Risk & Recovery Mapping component provides maps, digital geoinformation and reports that can be used for preparedness, prevention, and Disaster Risk Reduction activities, but also to monitor reconstruction after a disaster. The products include reference maps, hazard, vulnerability, exposure and other risk assessment maps that provide emergency planners as well as national or local authorities with an in-depth look into the situation of any defined Area of Interest (AoI). The service also provides post-disaster maps for potential recovery and reconstruction activities, for example, post-disaster needs assessment, recovery plans, reconstruction/rehabilitation monitoring, Internally Displaced Persons (IDP) monitoring, Refugee Camp monitoring.
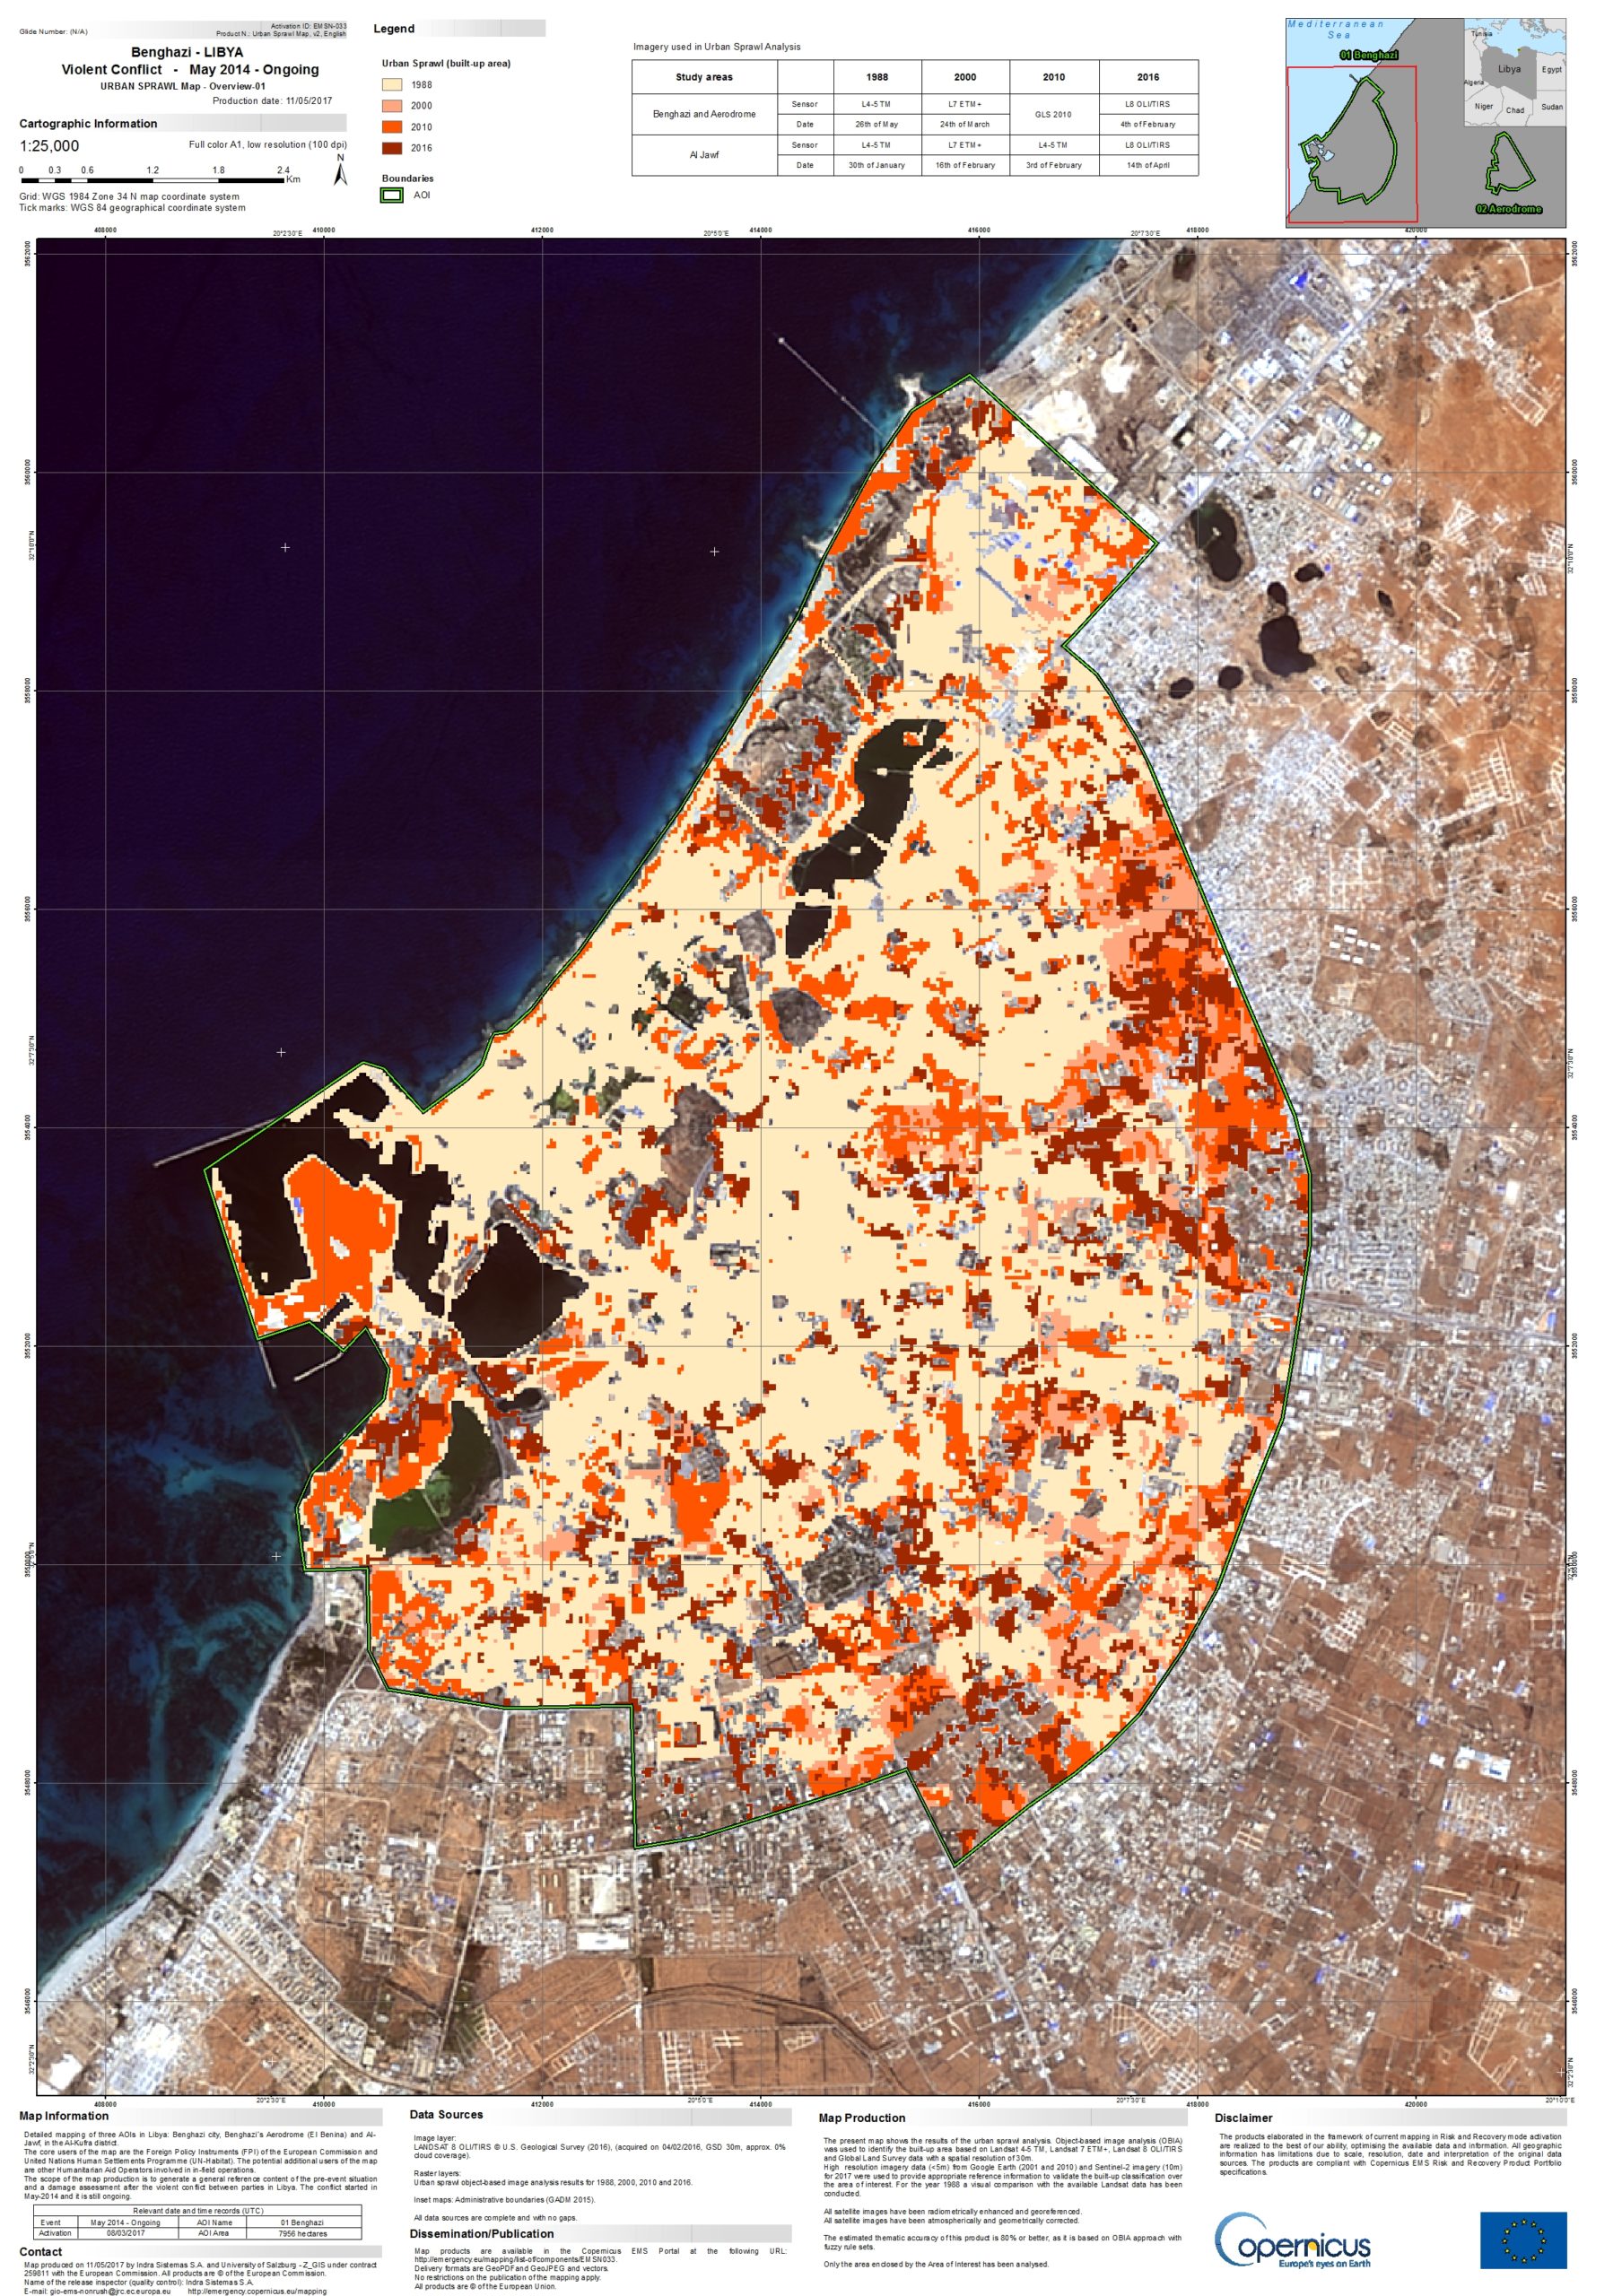
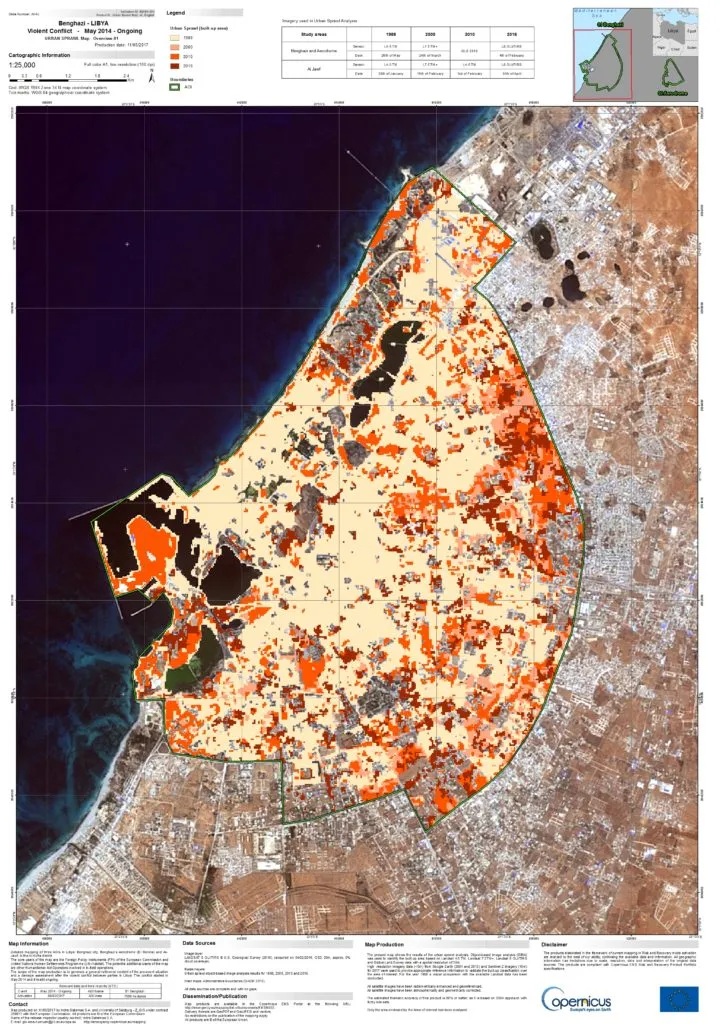
Example of Risk & Recovery mapping: Benghazi Urban Sprawl map (Copernicus EMS © 2018 EU, [EMSN033] Benghazi: Urban Sprawl map (Overview A1))
Copernicus EMS Risk & Recovery Mapping activation EMSN033 is a satellite-based conflict damage assessment of two selected areas in Libya: Benghazi and Al-Jawf in Al-Kufra district. The purpose was to generate maps and a spatial database related to damage assessment following the violent conflict that started in May 2014. You can find the full activation report, maps and vector data on the EMS website.
Rapid Mapping
The Rapid Mapping service provides maps and digital geoinformation (vector data) within hours or days after an emergency – depending how quickly as the necessary satellite imagery can be acquired while processing is performed in a few hours by a team of contractors that are on call 24h a day, every single day of the year.
There are three standard categories of rapid maps:
- Reference Maps, which show the situation prior to an event and are based on archive satellite imagery of the area prior to an emergency event;
- Delineation Maps, showing the extent of the event (for example, in case of wildfires, the perimeter and area of a burn scar or in case of floods – the flood extent);
- Grading Maps that estimate the magnitude of the damage after a disaster (for example, the severity of the burn in case of a forest fire, the number of buildings, roads affected by an earthquake and their damage grade, etc.).
For long-lasting events, monitoring maps can be requested so as to follow the evolution over time based on the latest available satellite imagery.
The Rapid Mapping component is mostly used in cases of floods, forest fires, earthquakes, hurricanes or tropical cyclones. However, the service can also be used for humanitarian crises. For example, the Danish Emergency Management Agency (DEMA) activated the Copernicus EMS to produce Reference Maps based on recent optical satellite imagery that it will use for the initial planning of its aid for Rohingya refugees in Bangladesh (EMSR272).
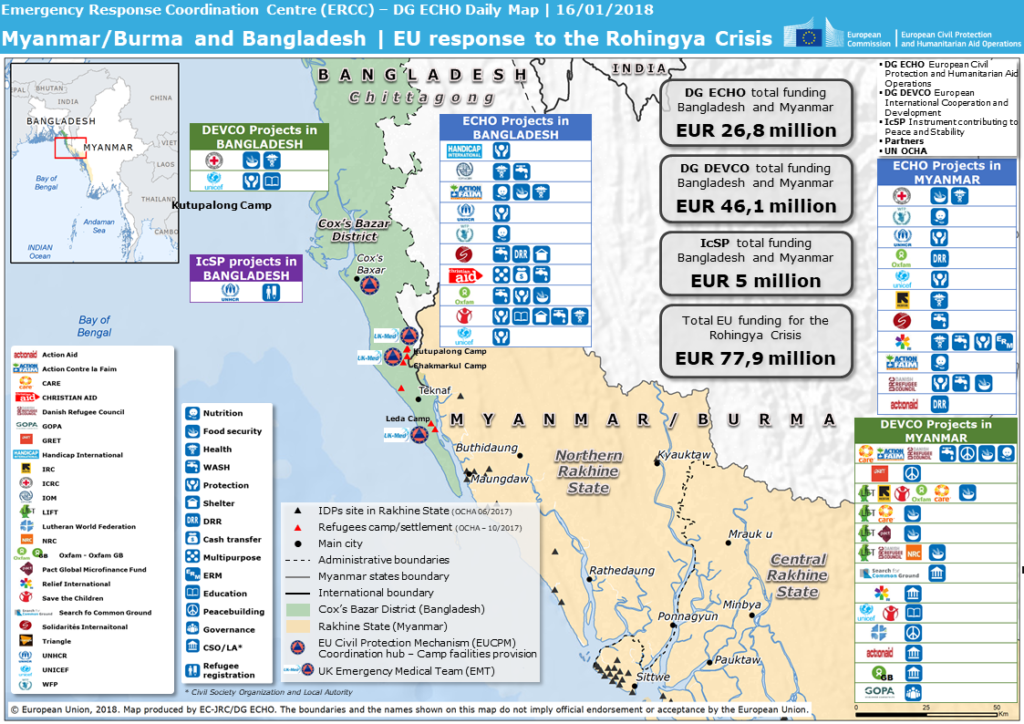
Disaster Management: Myanmar/Burma and Bangladesh | EU response to the Rohingya Crisis (ECHO Daily Map of 16 January 2018, source: ERCC)
Early Warning & Monitoring Systems for Forest Fires
The European Forest Fire Information System (EFFIS) and the Global Wildfire Information System (GWIS) can support forestry and firefighting services globally. Though called the European Forest Fire Information System, the EFFIS network involves a total of 40 countries in Europe and beyond. EFFIS is fully operational and GWIS operates on a pre-operational basis. Both systems provide a tool called the Current Situation Viewer – an in-browser view of Fire Risk Indexes (for example, Fire Weather Index, Initial Spread Index, Build Up Index, etc.), and active fires monitoring by satellite at medium resolution. The products are developed on the basis meteorological information, such as temperature, precipitation or wind, to forecast fire danger.
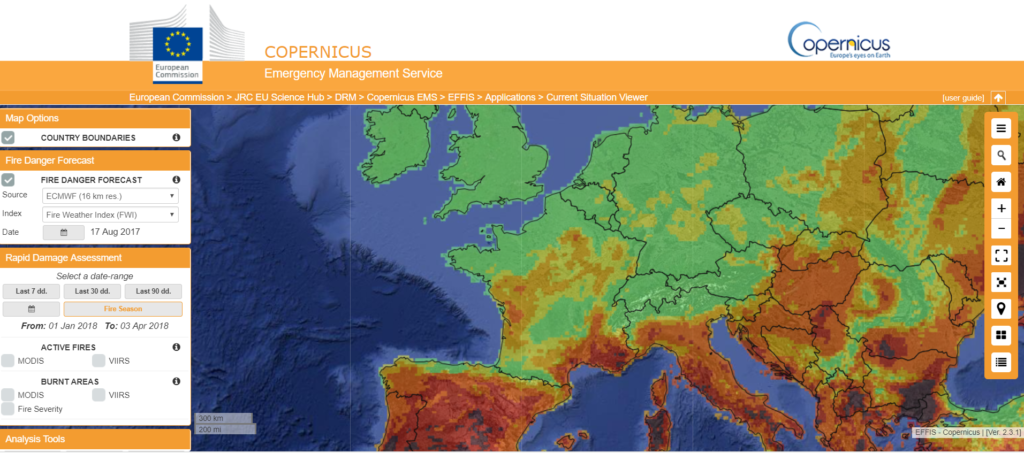
EFFIS current situation viewer (Copernicus EMS © 2018 EU, EFFIS)
The EFFIS website also includes forest fire news, annual fire reports, fire history, forest focus studies and other historical information. When required, users can request data (in particular in digital format) from both portals by filling a Data Request form online.
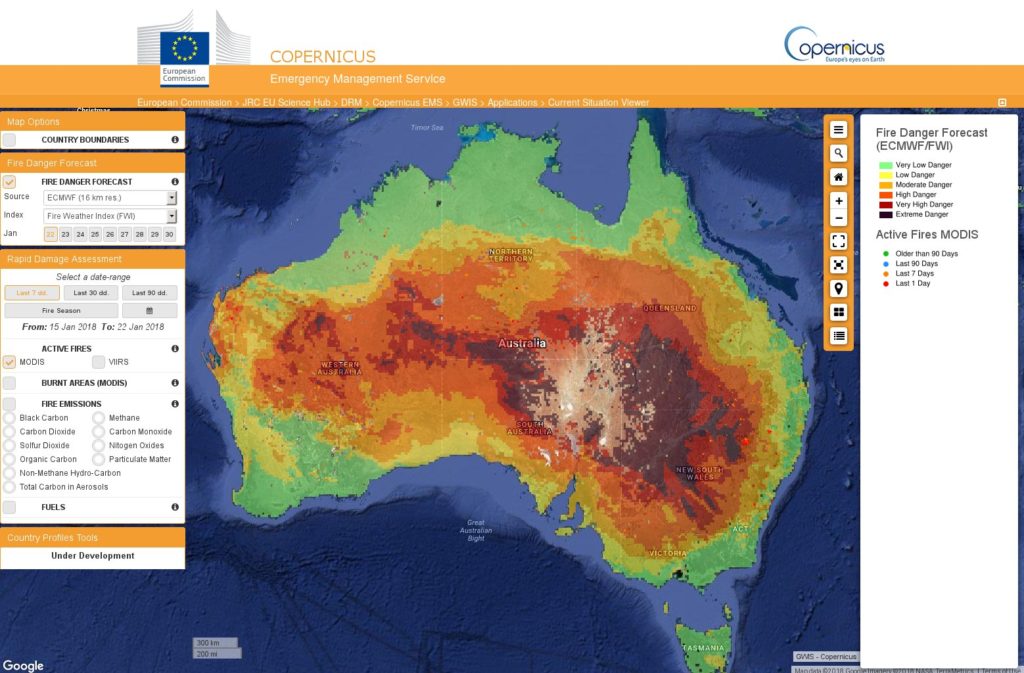
Fire danger forecast shows high to extreme values in most of the states in Australia (Copernicus EMS © 2018 EU, GWIS)
Early Warning & Monitoring Systems for Floods
The European Flood Awareness System (EFAS) provides flood probability forecasts for all European river basins. The System has 68 partners, which are mostly national hydro-meteorological centres responsible for national/regional warnings, or Civil Protection institutions in Europe and beyond. National authorities in partner countries receive pan-European flood forecast information twice a day which provides a 10-day outlook. A pan-European overview of ongoing floods is posted on the EFAS website and updated daily. The real-time EFAS access is currently limited to the authorities responsible for flood alerts in their countries. But you can still find archive information, EFAS bulletins and videos on the portal.
The EMS GloFAS system is the global counterpart of the European EFAS. It is composed of an integrated hydrometeorological forecasting chain and of a worldwide monitoring system that analyses daily results and displays forecasts for flood events on a dedicated web platform. To use the GloFAS Forecast Viewer, you will need to create a free account on the website. The website also has links to YouTube videos introducing the system and explaining how to use it, case studies for downloading and other information. Unlike EFAS, GloFAS is freely accessible to anyone.
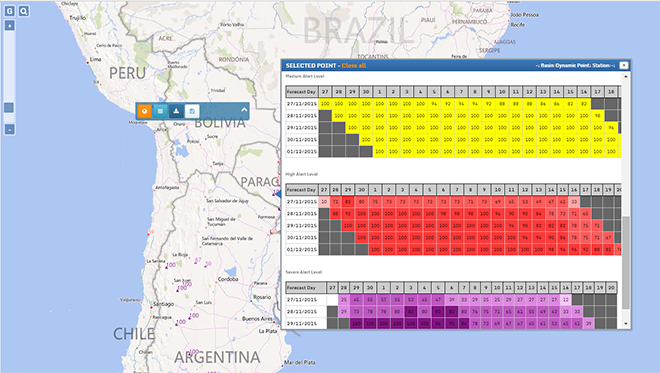
Global Flood Awareness System (Copernicus EMS © 2018 EU, GloFAS)
European Drought Observatory
The European Drought Observatory (EDO) is a new service released in January 2018. The EDO provides drought-relevant information such as maps of indicators derived from different data sources: precipitation measurements, satellite measurements, modelled soil moisture content and others. Graphs and Compare Layers tools allow for displaying and analysing the information and Drought News give an overview of the situation in case of imminent droughts.
The Compare Layers tool of the European Drought Observatory (Copernicus EMS © 2018 EU, EDO)
The benefits & limitations of satellite imagery in disaster management
There are many advantages that satellite imagery can provide:
- It allows to acquire information about difficult to access locations (e.g. remote, disaster and conflict-stricken areas)
- Radar satellites (such as the Copernicus Sentinel-1) can acquire imagery at night and irrespective of weather conditions (e.g. even when clouds are present over the Area of Interest)
- Large areas can quickly be assessed for damages to transport and building infrastructure – this can be particularly valuable in dense urban areas with large populations
- It is possible to monitor an area over a period of time to observe changing phenomena such as the expansion of urban areas or settlements, the movements of displaced populations, and the progress of construction activities
However, there are some limitations of satellites that have to be considered. These include:
- Optical satellites can only acquire images during daytime, and image quality can be affected by the presence of clouds, haze or smoke. In many of such cases, radar satellites can be used, however not all mapping products can be produced using radar imagery
- The accuracy and quality of the mapping results can vary depending on the nature and scale of the phenomena observed. For example, in case of floods, the satellite overfly can be too late to capture the maximum extension of a flooding event
How to access & activate the Copernicus EMS
The EMS Mapping component can be triggered for any part of the world by or through an Authorised User. These are the National Focal Points in the EU Member States and Copernicus Participating Countries, as well as the EU Delegations throughout the world.
Activations can also be triggered directly by or (for countries in which there is no National Focal Point) through the Emergency Response Coordination Centre (ERCC) of the European Commission’s Directorate General of Humanitarian Aid & Civil Protection. In all cases, a Service Request Form (available on the Copernicus EMS website) must be completed.
The EFFIS and GWIS systems are accessible online to users, but also to the general public (no password or registration required), and to access GloFAS you will need to create a free account. EFAS information is restricted; access can be provided on request.
For more information about disaster management
Copernicus EMS portal
Mapping portal
EFFIS portal
GWIS portal
EFAS portal
GloFAS portal
User Request Form for Rapid Mapping and Risk & Recovery Mapping
If you enjoyed this article about disaster management, read more and subscribe to our monthly newsletter!


