New high resolution mosaic from the Arctic and Antarctic

There is new notice from the sixth and ‘seventh’ continent: The Polar Geospatial Center (PCG) at University of Minnesota has accomplished a high resolution mosaic from the Arctic and Antarctic showing the poles at an unprecedented detail. Since the launch of the LANDSAT mosaic of Antarctica six years ago (LIMA), which employed the panchromatic mode on a sub-pixel level for achieving a resolution of 15m, the latest product has a never seen horizontal resolution of around half a meter applying imagery of commercial satellites such as WorldView-1, WorldView-2, QuickBird-2 and GeoEye-1.

One of the biggest challenges was to cope with the high number of images, over 30000, from different companies requiring the correction for the orientation and the automatisation of ‘orthorectification’, in order to obtain one single mosaic. The images are implemented in web-based mapping applications of the National Science Foundation for viewing high-resolution, commercial satellite imagery mosaics of the polar regions. Since the launch of the new bedrock topography of Antarctica ‘bedmap2’ in spring this year it’s the second important remote sensing achievement within short time.

According to PCG director Paul Morin those images reveal every penguin colony and every glacier crevasse. PCG Imagery Viewers are accessible to any researchers who have US federal funding. The imagery is licensed for federal government use and is not available to the general public. Other requests involve specific requirements and will be linked to a certain purpose and date. In general, the benefit goes to scientific and governmental activities.

The new imagery collection obviously will be beneficial for science such as climate research and glacier studies. As the spatial resolution permits to even detect penguin colonies, ecological research will also profit from the images as for instance the number of animal groups can be counted better than ever before. At this point I want to stress that knowledge extracted from research always implies to be aware of new (political) responsibilities. I am pointing to the soaring interest of adjoining states in Arctic oil reserves and the environmental problems that have to be linked to this topic. Therefore, the new level of information (PCG maps, bedmap2,…), which is going to be beneficial for different questions and parties, needs a strong discussion about the usability and potential consequences of practical applications.
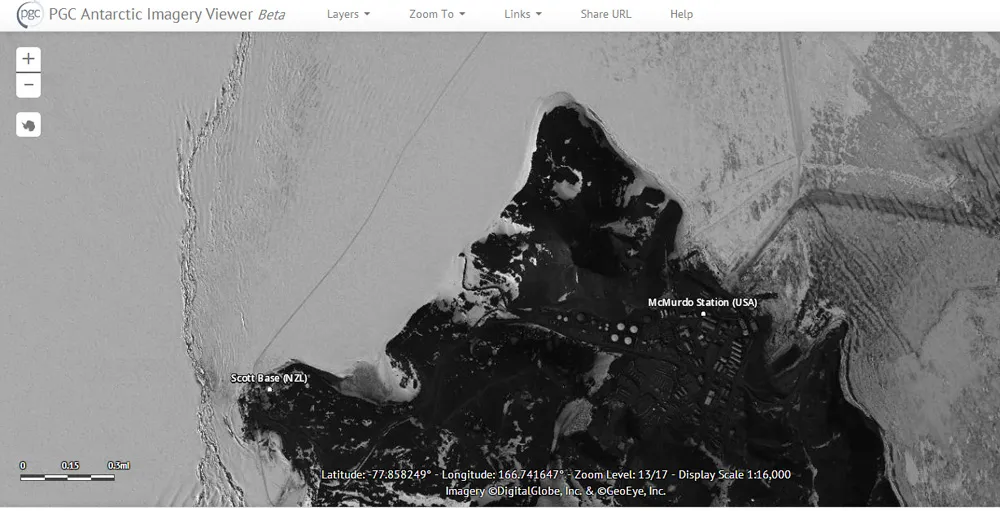
The Polar Geospatial Center Imagery Viewer allows scientists and others with federal funding or affiliations to create maps from a high-resolution satellite mosaic of Antarctica. Pictured here is Ross Island, home to McMurdo Station and Scott Base. Photo Credit: PGC Antarctic Imagery Viewer

The Polar Geospatial Center Imagery Viewer allows scientists and others with federal funding or affiliations to create maps from a high-resolution satellite mosaic of Antarctica. Pictured here is Ross Island, home to McMurdo Station and Scott Base. Photo Credit: PGC Antarctic Imagery Viewer. Source: Directionsmag.
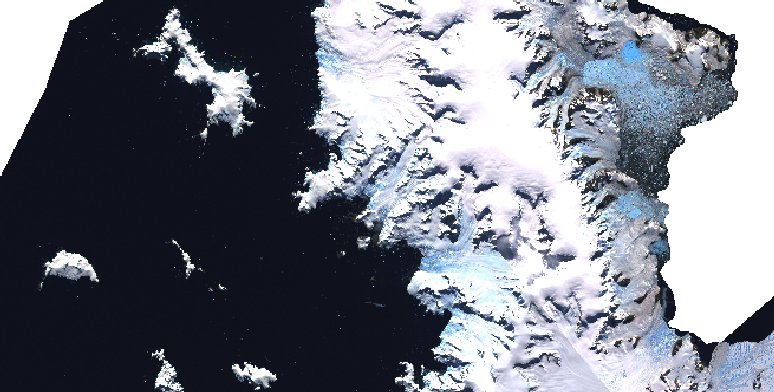
LANDSAT IMAGE MOSAIC of ANTARCTICA (LIMA). Image from the Antarctic Peninsula. Source: USGS.

LANDSAT IMAGE MOSAIC of ANTARCTICA (LIMA). Image from the Antarctic Peninsula. Source: USGS-LIMA.

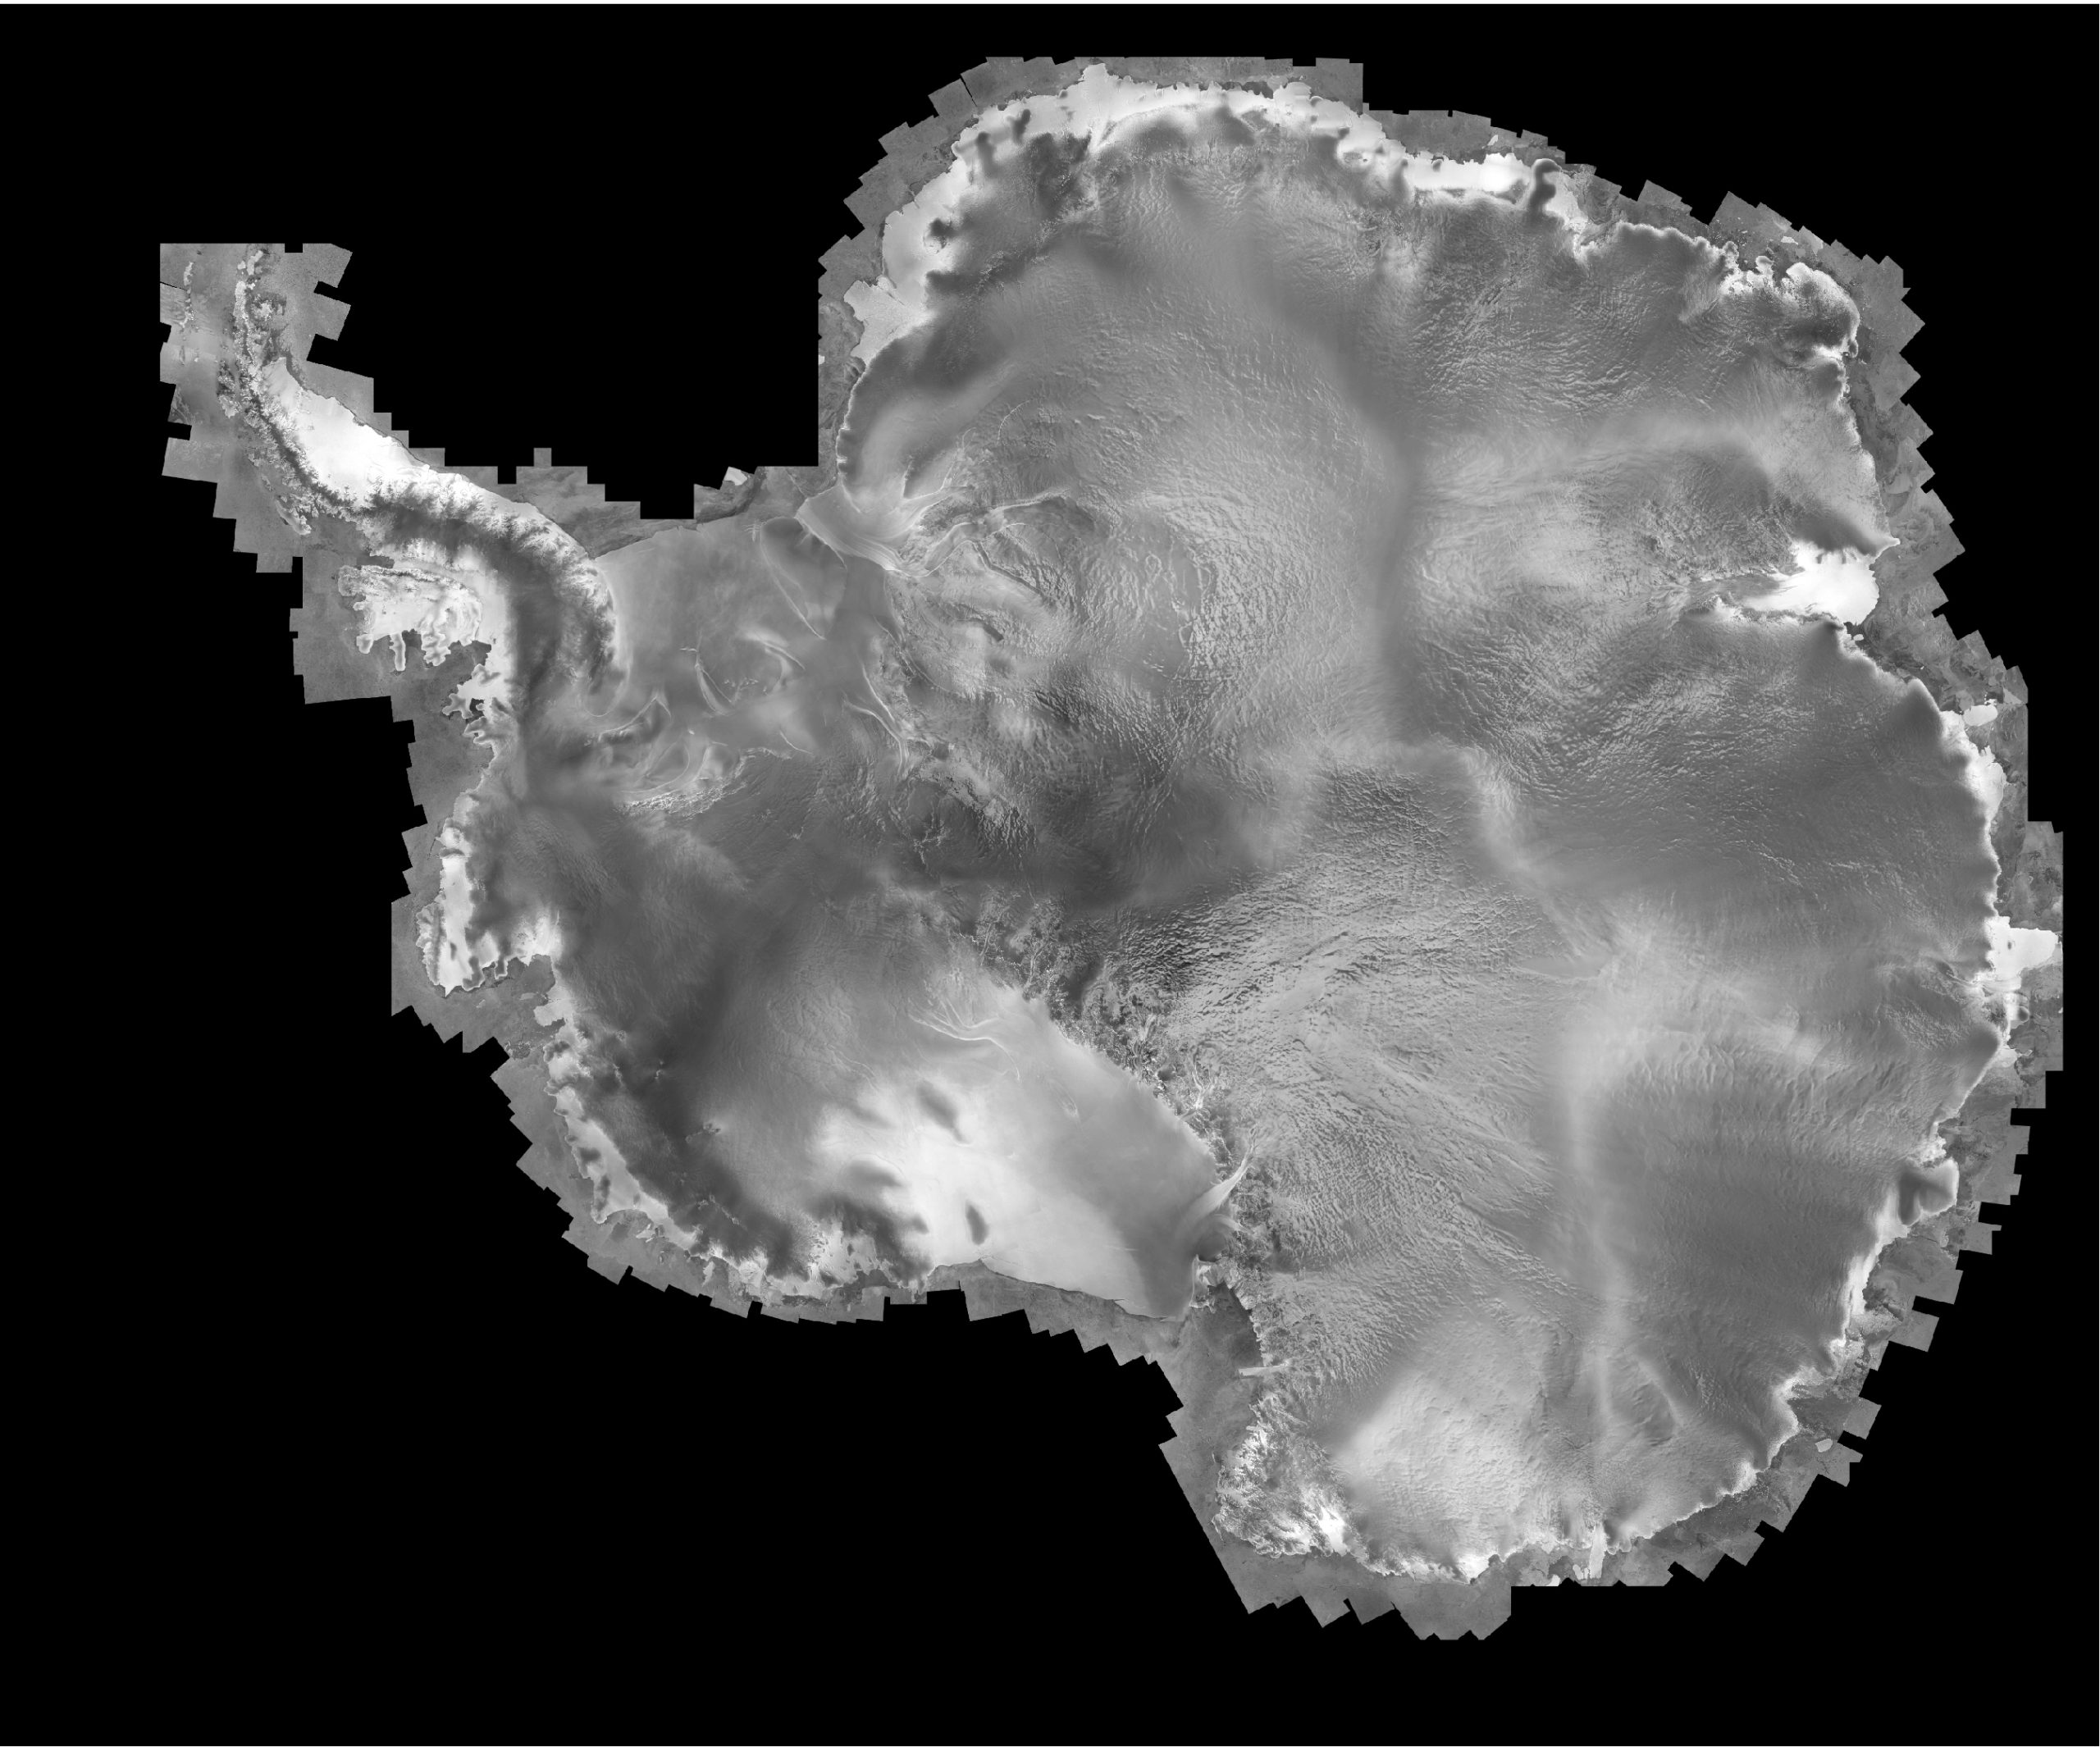
SAr Image from the Antarctic Mapping Mission of RADARSAT-1. The mosaic was coompiled by Byrd polar Research Station. The images were taken in 1997 and have a groudn resolution of 125m. Source: PGC.

SAR Image from the Antarctic Mapping Mission of RADARSAT-1. The mosaic was coompiled by Byrd polar Research Station. The images were taken in 1997 and have a groudn resolution of 125m. Source: PGC.

Source: Directionsmag


Did you like this post? Read more and subscribe to our monthly newsletter!


Say thanks for this article (0)
The community is supported by:
Become a sponsor
#
#Agriculture #Business #Construction #Data processing #Energy #Environmental Protection #ESG #Financial Services #Geospatial analytics #Geospatial for Good #Government #Health Care #Military #Natural Resources #Real Estate #Transportation
Making Sense of Satellite Imagery: How Can We Process Data at Scale?
Avatar for Barry Morisse
Barry Morisse 05.13.2024
AWESOME 2
#Agriculture #Construction #Energy #Environment #Environmental Protection #Financial Services #GeoDev #Government #Humanitarian #Ideas #Natural Resources #Orthorectification #Satellites #Transportation
Why Orthorectification is Key for Real-World Terrain Mapping and How To Use It
Nikita Marwaha Kraetzig 10.14.2024
AWESOME 2
#Business #Geospatial analytics #Other
Making Geospatial More Approachable Through Clear Documentation: Meet UP42’s Documentation Lead, Daria Lutchenko
Nikita Marwaha Kraetzig 09.27.2024
AWESOME 5
Next article

Processing “tons of data / big data” while you are sleeping: GDAL and Shell Scripting

Handling and processing big data is awesome but always questions the physical system capacity, dataset processing software, memory availability, efficient algorithm, processing time and so. If any of these go wrong Oh! dear, you are in trouble with big data.

Among geo-people, its very common, dealing with satellite/raster/gridded data. Now-a-days most of freely available huge datasets comes in grid format and if it’s an spatio-temporal data set Oh! boy it could be TB of data with thousands millions of records and thats a real nightmare. For an instance, GRidded Information in Binary (GRIB) data; basically weather data dateset, very useful for any sort of research involving temperature, humidity, precipitation and so. You can get the daily data for free in 0.5×0.5 degree spatial resolution, for whole world. So, now you know where to get huge amount of free data but question is how to process this data mass?

To make the long story short, lets pick a question to answer, “how can we create a weekly long term average (LTA) from 20 years of daily data? And what we need to make the processing efficient?” – simeplest way would be using shell script and make use of gdal library. Following is some steps and directions:

first to download the daily dataset using grib api (and …maybe with little bit of shell script for naming and organizing the data for more convenience) for the time period and perimeter we are interested in. then create a grid using gdal_grid function and make geoTIFF or any other format you are interested in (we also can do point wise calculation and grid it at the end)

for convenience we can define three directories src_path (where the geoTIFFs are), stage_dir (this is staging area where the intermediate processing file will be kept) and dest_path (where we want to find output). Besides bash script here I have used some gdal functions like that gdal_calc.py, gdalinfo and gdal_translate etc. details are discussed bellow:

# its always a question while processing raster datasets how to deal with no data pixels. here’s a solution how to assigning 255 as NoDataValue to different unwanted pixels:

assigning 255 as NoDataValue - Processing "tons of data / big data"# To create a long term Temperature average its necessary to summarize the weekly Tavg images. we do that here:

summarize the weekly Tavg images - Processing "tons of data / big data"# after we have created the summarized image its necessary to create status bitmap image (SM) with 0 for unusable and 1 for usable pixel values; using this SM image we can exclude the unwanted pixels from the LTA estimation:

create status bitmap image (SM) with 0 for unusable and 1 for usable pixel values - Processing "tons of data / big data"# Now we have to summarize the status bitmap (SM) images:

summarize the status bitmap images

# finally we use the summarized Tavg image and SM image and create the long term image average (LTA) and save it in destination folder:

create the long term image average (LTA) and save it in destination folder (1)

create the long term image average (LTA) and save it in destination folder (2)

Here the scripting ends. now you can use these scripts and use some global variables like International Week (iw) and put it in a loop. Run the script than go to party and sleep tension free 🙂 . hopefully in next days you will get tons of data processed and stored in the destination folder.


Did you like this article? Read more and subscribe to our monthly newsletter!

Read on
Search