Earth Explorers mission: Aeolus, “The Keeper of Winds”

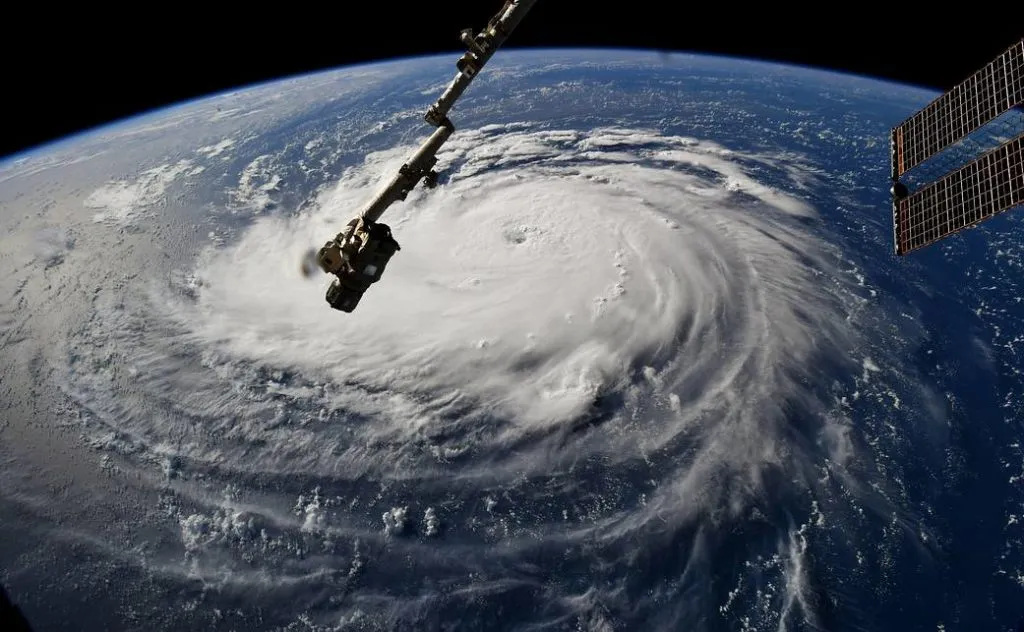
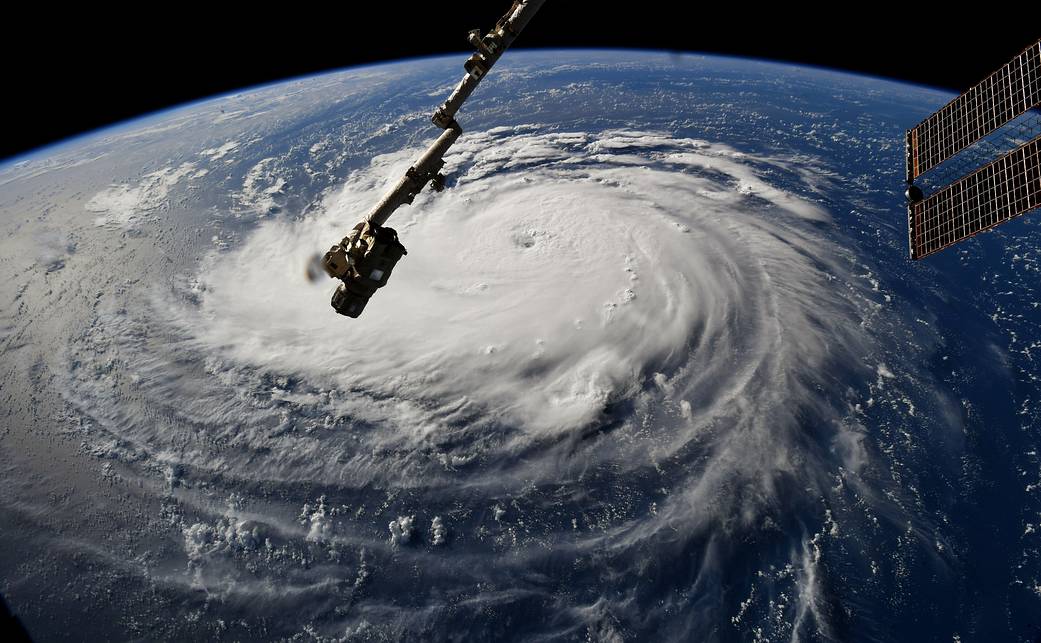
ESA’s new satellite was named after Greek mythology Aeolus. Image source: https://www.pinterest.ie/pin/515662226067007335/
At the end of August this year, European Space Agency was happy to announce the successful launch of their Aeolus satellite, creating an unprecedented possibility to measure wind speed around our planet. The story behind tremendous effort put into this mission by ESA and parties involved is as impressive as window of possibilities opened by the new sensor. The path leading to placing this satellite in orbit was paved with obstacles that required to go beyond the state-of-the-art numerous times. This mission is a perfect example of why space industry is at the forefront of the race to improve our everyday life through pushing the boundaries of what’s possible.
Earth Explorers
Aeolus — named after Greeks mythology keeper of winds — is fourth launched satellite from ESA’s own Earth Explorers mission. The idea behind EE program was to focus on a number of Earth’s spheres including also Earth’s interior. Previously launched satellites are:
- SMOS(Soil Moisture and Ocean Salinity), launched on 2nd of November 2009 to measure the moisture held in soil and salinity in the surface layers of the oceans
- GOCE(Gravity field and steady-state Ocean Circulation Explorer), launched on 17th of March 2009 to provide high spatial resolution gravity-gradient data improving global and regional models of Earth’s gravity field and geoid
- CryoSat, launched on 8th April 2010 to measure fluctuations in ice thickness
On 22nd of August 2018 Aeolus became the fourth Earth Explorer and first in 8 years launched for this programme. Back in 2002 however, Aeolus was meant to be the second.
Let’s measure the wind
The mission was planned before the beginning of the 21st century, initially as Atmospheric Dynamics Mission, with main goals of better understanding phenomenas such as El Niño and Southern Oscillation. The sensor however was promising much more, allowing to understand in a more complete manner, the behaviour of our atmosphere. Putting it simple, data provided by this satellite can potentially result in better weather forecast prediction, air pollution monitoring, global warming analysis and more.
The study of mission’s feasibility was completed at the end of 1999 which lead to development and design stage in 2002. From that point the potential launch date was estimated to be October 2007 and on 22nd of October 2003 ESA has signed a contract with EADS Astrium UK to develop Aeolus. The initial estimate turned out to be undershot by almost 11 years…
Tough blows for wind satellite

ALADIN(Atmospheric Laser Doppler Instrument). Image source: link
The crucial component of the satellite was naturally it’s sensor — ALADIN(Atmospheric Laser Doppler Instrument). Initial tests for thermal and structure resistance to space conditions began in 2005 and were successful which lead to beginning of development of sensor’s hardware. By the end of 2005, ALADIN’s prototype emitted its first UV light pulses however the launch date was for the first time pushed back a year, to 2008.
The troublemaker
ALADIN’s measurement of wind is based on doppler effect similar to e.g. SAR sensor but using laser-emitted UV light instead of radio waves.
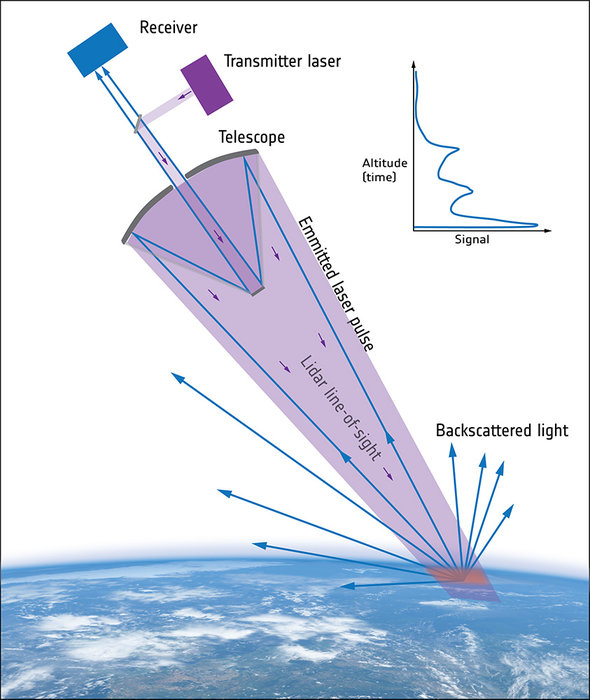
ALADIN’s lidar concept. Image source: link
Unfortunately measuring scattered particles is a bit trickier than solid objects and so was the development of the sensor. One of the basic requirements for the laser in the sensor was initially to emit 100 light pulses per second over operational period of the satellite which is usually couple of years. You can ask Google
seconds in year times hundred
and it will give you an answer of approximately 3.15 * 10⁷ pulses per year. Adding couple more requirements like high pointing stability, ability to survive the launch, remote control and monitoring capabilities made the development even more difficult. Oh, and you remember that it had to do it all in not very welcoming space environment right? Optical components are not big fans of vacuum conditions.
As later in 2013 ESA’s ALADIN instrument manager, Denny Wernham would say:
“This issue was tackled on multiple fronts: new UV coatings were developed, the energy density of the laser in the UV section was reduced while keeping the total output energy constant by improving the efficiency of the crystals that convert infrared to UV light, and it was decided that the new UV optics would be ‘screened’ to guarantee their performance.
Manufacturing was certainly a huge challenge but not the only one. Once the sensor was rough and ready it had to be thoroughly tested.”
Heavy light test
To test the concept of the sensor in the real world before going beyond atmosphere, Aeolus team first developed ALADIN Airborne Demonstrator(A2D) that could be attached to an airplane for test flights. A2D was built to collect data in pre-launch campaigns. The data had to be analysed and validated against ground station measurements which would also allow for better sensor calibration. Test campaigns were performed in such extreme locations as Schneefernerhaus observatory situated 2650 meters above sea level and over Greenland and Iceland territories near the Arctic Circle.
Moving to 2010, the experiments allowed to improve mathematical model used for interpreting measurements from LIDAR. Initial model, created in early 1970s was updated allowing to describe shape of backscattered light up to accuracy of 98% which translates into improved accuracy of measurement of molecules speed in the atmosphere — the main purpose of ALADIN. The improvement not only allowed to better Aeolus sensor but also improve state-of-the-art for other lidar sensors using this model.
Light in the tunnel
After over 5 years of testing, improving and pushing the boundary of what’s possible, the development of the sensor destined for orbit could progress. In April 2013 ESA announced successful test where the sensor was turned on for 3 consecutive weeks emitting some 90 million laser shots which brightened the future of the mission. The launch was expected to happen in 2015. Additional test for ALADIN and the development added couple more to already long journey. On 7th of September 2016 ESA secured the launch with Arianspace and ESA’s Director of Earth Observation Programmes Josef Aschbacher summarised:
Aeolus has certainly had its fair share of problems. However, with the main technical hurdles resolved and the launch contract now in place, we can look forward to it lifting off on a Vega rocket from French Guiana, which we envisage happening by the end of 2017
It actually took a year longer but on 22nd of August, 2018, after so many years of developing the technology that was never developed before…
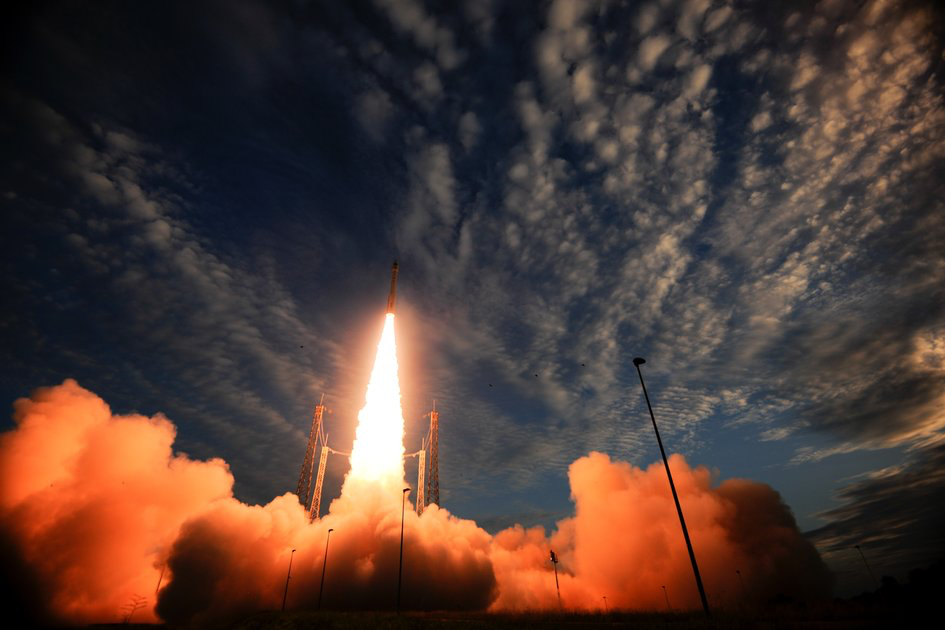
Aeolus launch fromEurope’s Spaceport in Kourou, French Guiana. Image source: link
The future
The Earth Explorers mission continues with three new explorers announced last week by ESA. Looking at an amazing history of Aeolus we may doubt the timeliness but we can be sure about successful delivery.
References: ESA
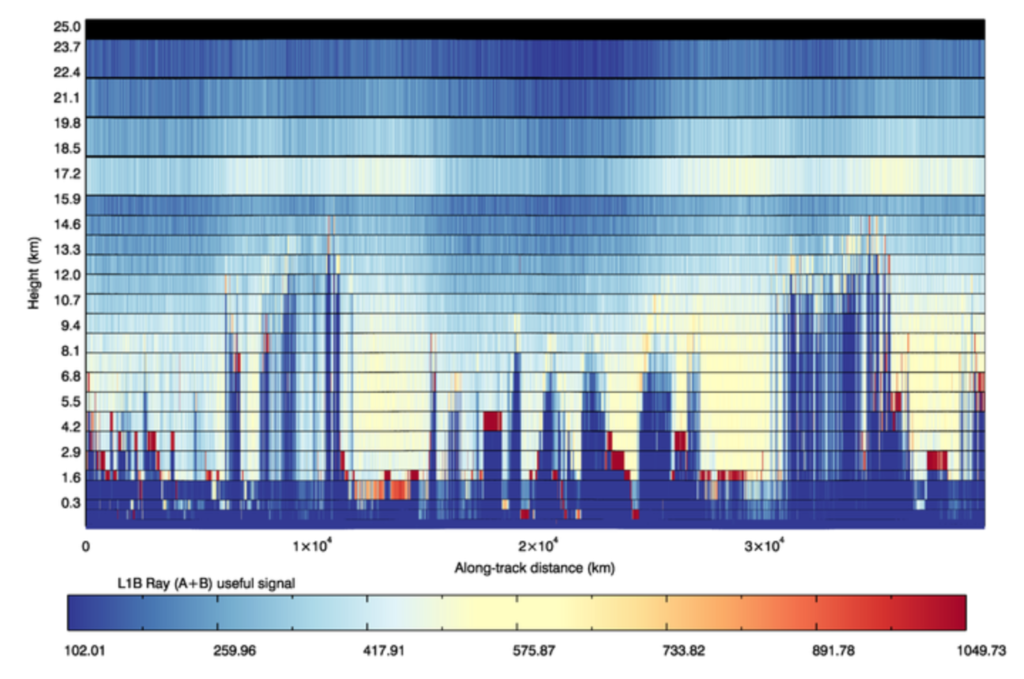
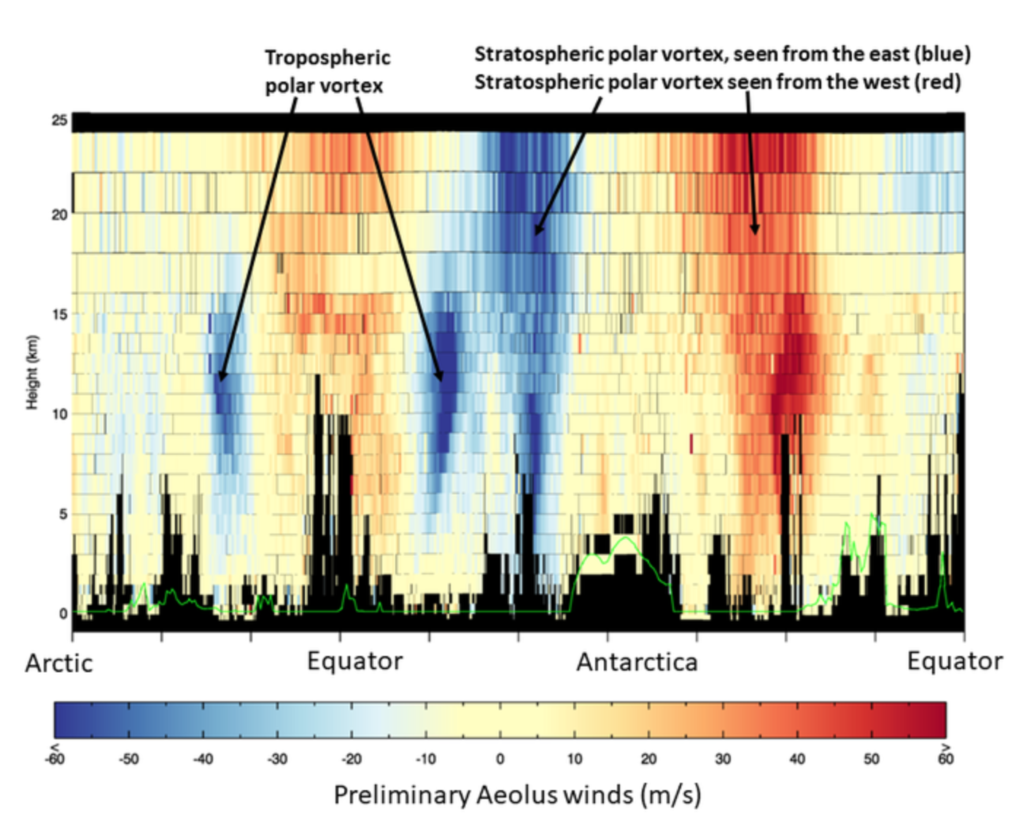
Appendix—first results already available!
If you enjoyed this article, read more and subscribe to our monthly newsletter!


